AGB stars in the Magellanic Clouds. III. The rate of star formation across the SMC.
Abstract
Aims. This article compares the magnitude distribution of Small Magellanic Cloud asymptotic giant branch stars obtained from the DENIS and 2MASS data with theoretical distributions.
Methods. Theoretical magnitude distributions have been constructed using up-to-date stellar evolution calculations for low and intermediate-mass stars, and in particular for thermally pulsing asymptotic giant branch stars. Separate fits of the magnitude distributions of carbon- and oxygen-rich stars allowed us to constrain the metallicity distribution across the galaxy and its star formation rate.
Results. The Small Magellanic Cloud stellar population is found to be on average Gyr old but older stars are present at its periphery and younger stars are present in the direction of the companion galaxy the Large Magellanic Cloud. The metallicity distribution traces a ring-like structure that is more metal rich than the inner region of the galaxy.
Conclusions. The C/M ratio discussed in Paper I is a tracer of the metallicity distribution only if the underlying stellar population is of intermediate-age.
1 Introduction
Asymptotic Giant Branch (AGB) stars are useful indicators of galactic structure and evolution for a series of reasons: first, they are easily noticed in near-infrared surveys, second, they trace stellar populations over a large range of ages (from to several Gyr) and hence are widely distributed among galaxies, and third, their distributions of pulsational and chemical properties are sensitive to population parameters such as age and metallicity. Cioni & Habing (crat (2003)) – herewith Paper I – showed that the number ratio between carbon-rich (C-rich or C-type) and oxygen-rich (O-rich or M-type) AGB stars varies over the face of the Magellanic Clouds. Interpreting C/O changes as changes in the mean metallicity, they concluded that in the Small Magellanic Cloud (SMC) contrary to the Large Magellanic Cloud (LMC) there is no clear gradient in metallicity. The results for the LMC have been revised by Cioni et al. (cio2 (2006)) – herewith Paper II – with the aid of up-to-date stellar models and taking into account different age distributions. It was suggested that a fit to the -band magnitude distribution of both C- and O-rich AGB stars should be particularly useful to detect variations on the mean age and metallicity across the face of nearby galaxies. For some well-defined LMC regions, both the mean age and metallicity were found to span the whole range of grid parameters.
This work, similar to Paper II, focuses on the stellar population in the SMC field. The SMC is also an interesting test study to our method based on the near-infrared photometry, since the global star formation history in this galaxy has been recently studied by Harris & Zaritsky (harr (2004)) using photometry in the optical. Below, we provide a summary of previous work on the star formation history of the SMC.
Section 2 describes our selection of the sample of AGB stars from the DENIS catalogue towards the Magellanic Clouds and from the 2MASS catalogue. Section 3 summarises the theoretical models used to construct a magnitude distribution while Sect. 4 compares the observed and theoretical distributions. Section 5 contains a comparison of our results with the information known from the literature and Section 6 concludes this paper.
1.1 SFR in the SMC - Review
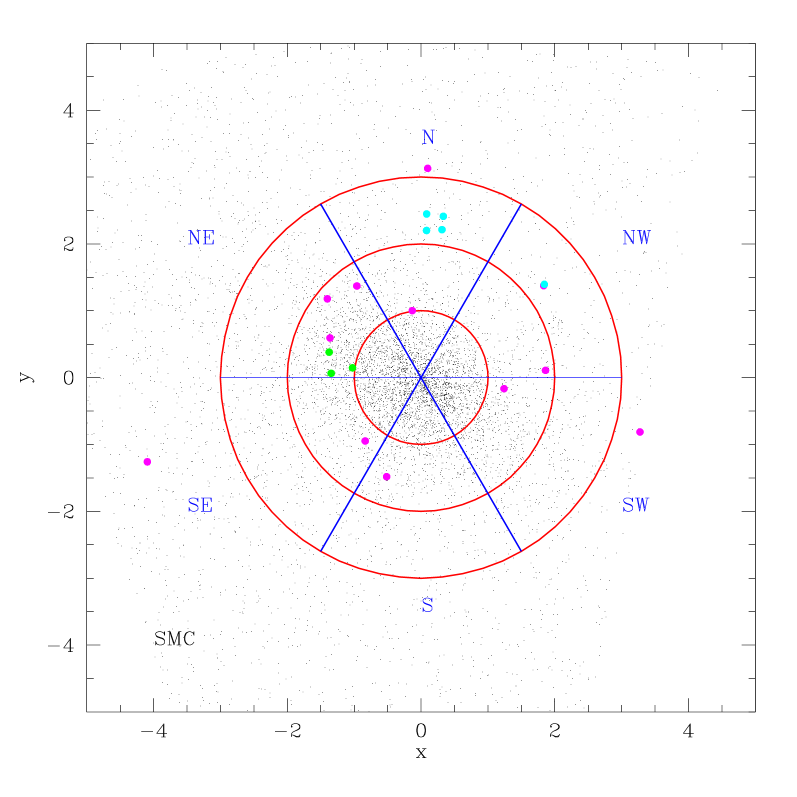
The SMC, like its companion LMC galaxy, is also characterised by a bar, that is probably of tidal origin, with a position angle of and a wing situated about East of the bar about kpc closer to us than the main body of the galaxy (van den Bergh vdbe (1999)). The SMC is kpc thick along the line of sight (Crowl et al. cro (2001)) and appears as a smooth elliptical galaxy from star counts of giant stars compared to the irregular shape traced by younger components (i.e. Rebeirot et al. reb (1993), Morgan & Hatzidimitriou morhat (1995), Cioni et al. 2000b ). This galaxy, compared to the LMC, has a lower metallicity, a higher gas mass fraction, and the mean age of its field stellar population is older. It contains only one globular cluster (NGC 121; Gyr old). All these are indications that the SMC is more primitive and less evolved than the LMC (van den Bergh vdbe (1999)). The birth rate of clusters in the SMC has been rather constant in time (i.e. Frantsman fra (1988)). Two peaks in the age distribution of SMC clusters have been found: one Gyr ago and the other Gyr ago. Both are associated with a close passage of the LMC (Piatti et al. pia (2005)). Despite the apparent abundance of young ( Gyr) clusters Rafelski & Zaritsky (rafzar (2005)) suggest that the dominant epoch of cluster formation was the initial one. Prior to their work which include about clusters across the SMC the distribution of young clusters was biased towards the East (Crowl et al. cro (2001), see our Fig. 1). However, because of the limited precision in the age measurements using integrated colours Rafelski & Zaritsky (rafzar (2005)) fail to establish a correspondence between the cluster age function and the field star formation history. But their Fig. suggests that clusters older than Gyr occupy the SMC bar region while younger clusters define a thicker bar almost tracing the whole extent of the galaxy.
Hardy & Durand (hardur (1984)) studied the (, ) colour-magnitude diagram of several fields in the wing of the SMC (Fig. 1) and concluded that the underlying population is of intermediate-age (older than Gyr). On the other hand from the analysis of blue and red UK Schmidt Telescope photographic plates, covering approximately the whole galaxy, Gardiner & Hatzidimitriou (garhat (1992)) found that a population younger than Gyr is more prominent in the eastern side of the SMC facing the LMC than elsewhere in the galaxy, a population Gyr old is present in the innermost region of the galaxy, while an older population (about Gyr old) dominates the outer regions. Dolphin et al. (dol (2001)) observed the outer SMC (see our Fig. 1) using the Hubble Space Telescope (HST) and derived a wide range of ages (from to Gyr old) for its stellar population. Large scale photometric observations by Harris & Zaritsky (harr (2004)) provided for the first time a picture of the global star formation history across the SMC. They have shown that about half of the stars in the SMC formed more than Gyr ago; star formation then became quiet until about Gyr ago after which several bursts of star formation, superimposed on a continuous process extending to the present time, occurred at look-back times of , and Gyr. The first two bursts are associated with tidal interactions with the Milky Way Galaxy and the latter with an interaction with the LMC (Zaritsky & Harris zarhar (2004)). Harris & Zaritsky (harr (2004)) also detected a ring-like morphology in the intermediate-age population ( Gyr) that may suggest an inward propagation of star formation or the remnant of a gas-rich merger event.
Thus, apart from the quite comprehensive study by Harris & Zaritsky (harr (2004)), based on relatively shallow photometry, there have been considerably fewer (and less detailed) observations of the SMC field stellar population and clusters than of its more proximate companion (i.e. the LMC). Both clusters and field stars forming times span a broad and continuous range of ages. The underlying stellar population is also of intermediate age but there is a much older population in the outer regions and perhaps a younger component in the wing region. The global picture provided by Harris & Zaritsky (harr (2004)) provides an extremely useful reference to future studies of the SMC population, including the present work.
2 Observational sample of AGB stars
Following the same criteria as in Paper I & II we selected an almost complete sample of AGB stars. From the DENIS catalogue towards the Magellanic Clouds (DCMC - Cioni et al. 2000a ) we extracted candidate AGB stars including O-rich AGB stars of early M spectral subtype (i.e. M0-M1) but excluding AGB stars with thick circumstellar envelopes. First, we dereddened the data adopting an average as given by Westerlund (west (1997)), which using the extinction law by Glass (glas (1999)) results in the following absorptions: , and mag. Then, we adjusted the data to the 2MASS photometry using the systematic shifts derived by Delmotte et al. (delm (2002)). Finally, we selected AGB stars using the colour-magnitude diagram (see Fig. 1 of Cioni, Habing & Israel 2000b and Paper II). Besides accounting for the different distance moduli of the Clouds (i.e. mag) no correction was applied to compensate for the different average metallicity (i.e. [Fe/H] and [Fe/H] – van den Berg vdbe (1999)). The effect of metallicity on the colour is comparable to the photometric errors at the AGB magnitudes (i.e. and mag).
From the 2MASS all sky survey (Skrutskie skru (1998)) we extracted candidate AGB stars. However, in this case selecting them from the diagram we accounted for both differences in distance and metallicity between the LMC and SMC. The latter causes a significant effect on the () colour of red giants: mag where the factor is derived from our theoretical simulations at different metallicities.
To study the shape of the magnitude distributions as a function of spatial coordinates we divided the SMC area into rings and sectors (Fig. 1): three concentric rings centred at and at a radius of , and , respectively, as well as six sectors at an aperture of . Rings are numbered with increasing radius and sectors by compass direction (SE, S, SW, NW, N, NE).
In each sector of each ring simple averages of DCMC and 2MASS distributions of C and M stars as a function of magnitude have been calculated for magnitudes above the TRGB (). Irrespective of their or magnitudes both data sets should have detected the same AGB star candidates, and the averaging accounts for migration between adjacent bins and variability effects. At only DCMC data provide a reliable description of the AGB population because the initial selection criterion using -band measurements rejects RGB stars with similar infrared magnitudes and colours. More details about the comparison between DCMC and 2MASS data are given in Paper II.
3 Theoretical models
The -band photometry of the SMC has been simulated using the TRILEGAL population synthesis code (Girardi et al. gi05 (2005)), that randomly generates a population of stars following a given SFR, age-metallicity relation (AMR) and initial mass function (IMF). The stellar intrinsic properties are interpolated over a large grid of stellar evolutionary tracks, based on Bertelli et al. (bert (1994)) and Girardi et al. (2003) for massive stars, Girardi et al. (gi00 (2000)) for low- and intermediate-mass stars, and complemented with grids of thermally pulsing AGB (TP-AGB) tracks calculated by means of Marigo et al.’s (ma99 (1999)) synthetic code. Improvements to the code are described in detail in Marigo et al. (ma03 (2003)) and in Paper II. We use complete grids of tracks for different metallicities comprised between and , interpolating to generate stars of any intermediate metallicity.
The photometry has been simulated from the bolometric magnitudes by applying the extended tables of bolometric corrections (BCs) from Girardi et al. (gi02 (2002)) for O-rich stars (with C/O), and by empirical relations for C-rich stars (with C/O). For O-rich stars, the magnitudes and colours correspond to the DENIS and 2MASS filters; they are based on ATLAS9 model atmospheres (Castelli et al. cast (1997)) for K, and on the empirical spectra and –colour scale by Fluks et al. (fluk (1994)) for cooler stars. For C-type stars, the BC in the band is taken from the relation by Costa & Frogel (cost (1996)), whereas the colour is derived from the –()–C/O relation from Marigo et al. (ma03 (2003)), which itself is based on a fit to the empirical data by Bergeat et al. (berg (2001)). Photometric errors were simulated as in Paper II.
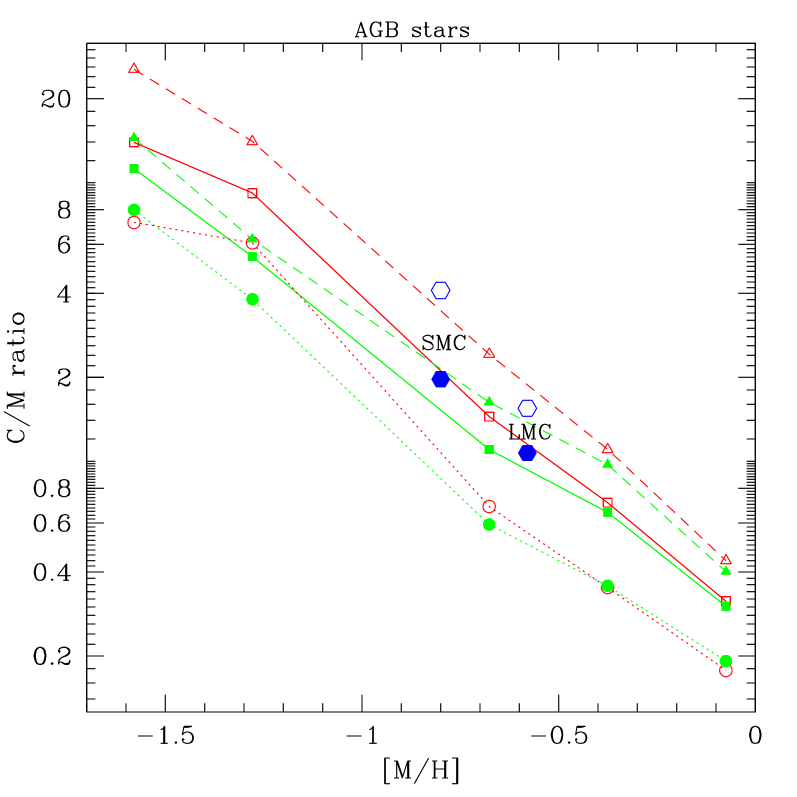
More details about the properties of theoretical models as well as the number and distribution of AGB stars for varying metallicity at a constant SFR, and viceversa, are given in Paper II. For the sake of simplicity, we adopt a simple family of exponentially increasing/decreasing SFRs, , where is the stellar age, and a free parameter. Table 1 of Paper II presents the correspondence between and the mean age of all stars formed in a model. Figure 2 shows the variation of the C/M ratio as a function of [M/H] for different cases of SFR. This ratio has been calculated in two different ways: first using the numbers found from a given model, and second from the number of stars falling in the C-rich and O-rich AGB regions in the near-IR CMD (see Paper II). These two selection criteria (the “model” and “photometric” ones, respectively) produce C/O ratios with a similar behaviour for different [M/H] and SFR, as can be seen in Fig. 2. The photometric criterion is the same as the observational one described in Sect. 2.
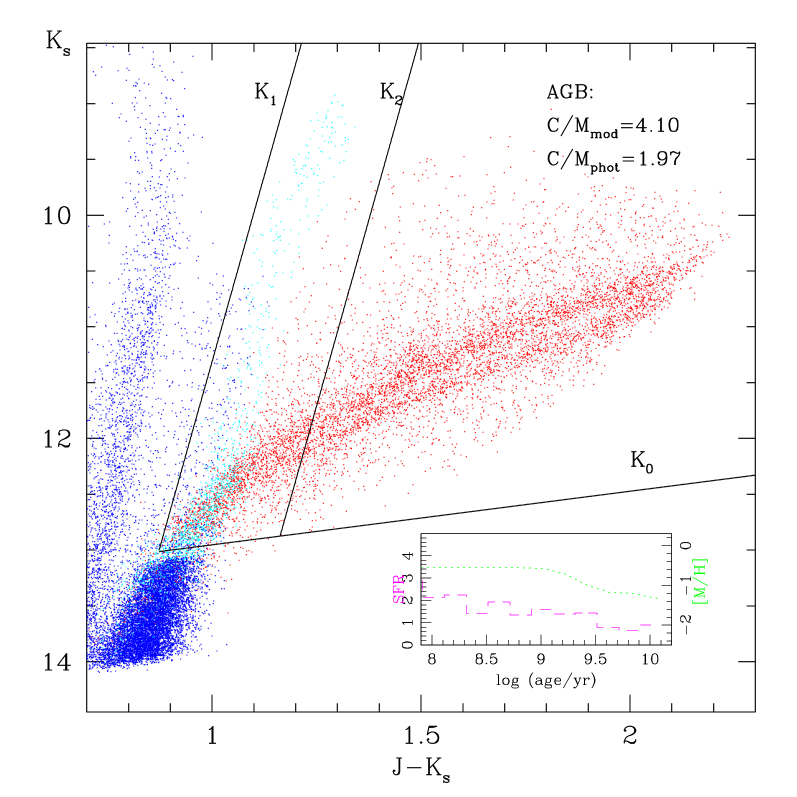
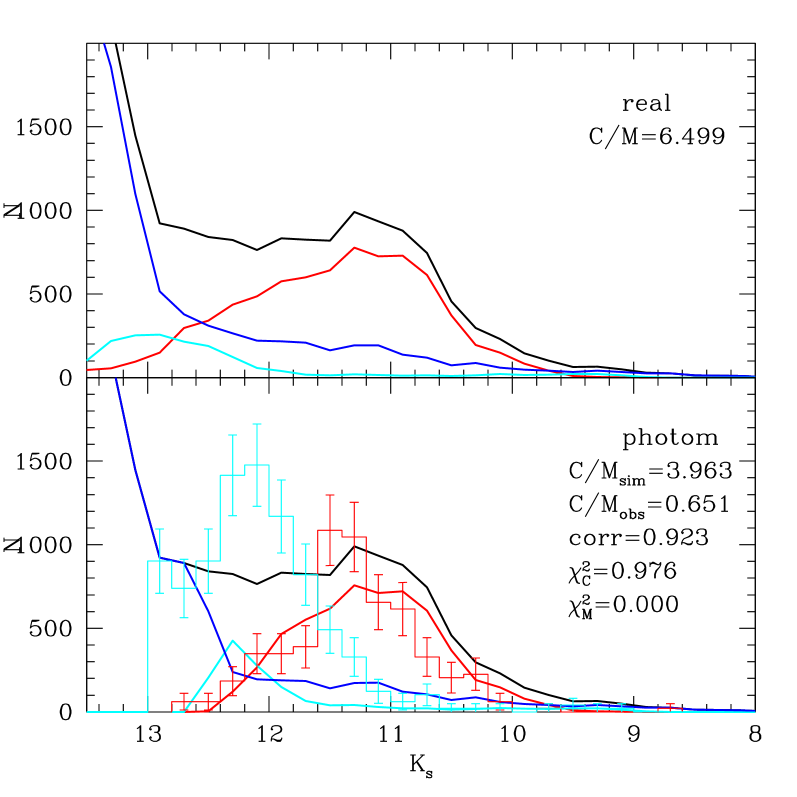
The distinction between AGB stars of a different chemical type is clear in the CMD of Fig. 3. This figure shows a simulation that adopts the SFR and the AMR we use in the “realistic” case – as derived from Harris & Zaritsky (harr (2004)) in the entire body of the SMC, and from chemical evolution models (Pagel & Tautvaisiene page (1999)). The corresponding luminosity functions (LFs) are presented in Fig. 4.
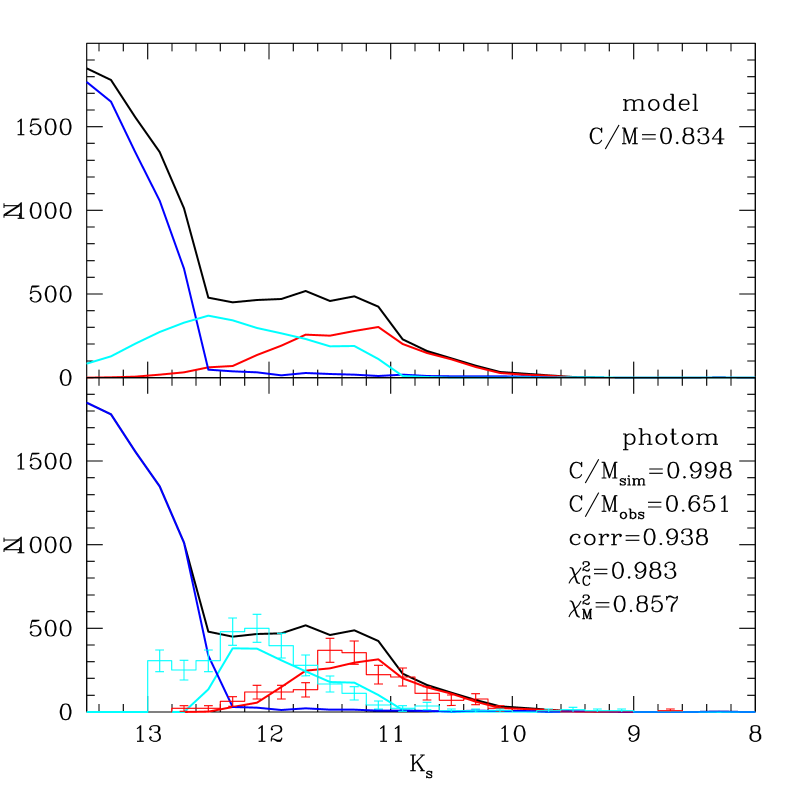
4 Comparison between observed and theoretical distributions
Although the photometric criteria for selecting C and M AGB stars provide LFs in good agreement with the model distribution (Fig. 4) the number of M-type AGB stars predicted by the models is just about half of the observed ones. This was also the case in the LMC and it is either due to inappropriate SFR and AMR for the investigated AGB population or to uncorrected lifetimes of the C- and O-rich phases of TP-AGB evolution. Foreground contamination is negligible. Similarly to Paper II we proceed by fixing the AMR relation of the SMC, and change the family of SFR. Then for each simulation we compare, using the test, the derived and observed LF, separately for C and M stars in each sector of each ring. Figure 4 shows a model (left panel) that represents rather well the distribution of C stars but fails to recover the distribution of M stars while on the right panel both distributions are recovered with a probability above %. For the sake of simplicity, we adopt a constant AMR, i.e. the same for all ages. This is not the best approximation for the case of the SMC, since both cluster and field data indicate that a substantial chemical enrichment occurred in the last 3 Gyr of its history (Harris & Zaritsky 2004, and references therein). However, the adoption of a single reference is necessary to unequivocably locate the lines that are used to select C and M stars in the CMD.
In Fig. 5 maps of metallicity, separately for C and M stars across the whole SMC area are shown for each SFR. Contour values directly correspond to metallicity expressed as values of . The distribution of probability is also shown and indicates how significant a metallicity map is. These maps were created following three steps: (i) create a grid of points in the plane (, ) equally spaced with a step of , (ii) assign to each point the quantity we are interested (for example the most probable metallicity) accordingly to which sector a point belongs to, and (iii) re-bin the distribution of values in bins equal to (this corresponds to a resolution of deg2) and apply a box car smoothing of width. Finally, we constructed grey scale maps where darker regions correspond to higher numbers. Combining the information in each of the maps in Fig. 5 we show in Fig. 6 the metallicity that corresponds to the maximum probability among the different SFRs as well as the map of SFR and the corresponding probability. Note that to each SFR we have assigned the mean age of all stars formed accordingly to that particular SFR because this quantity, contrary to the mean age of AGB stars only, does not depend on metallicity. Therefore contour values correspond to the mean age of the local population.
Figure 7 shows the distribution of the number of C and M stars and of their C/M ratio across the SMC with the same binning as in the other maps. A high resolution version of the distribution of the C/M ratio as obtained in Paper I is also shown. The effect of binning in smoothing galaxy features is clear however major trends are conserved. For example a comparison of both C/M ratio distributions shows dark regions (i.e. regions with a high C/M ratio) to the NE and NW of the SMC connected by a southern bridge of relatively high ratio values. These two darker patches are recognisable also in the high-resolution map as well as another dark patch to the S of the galaxy centre. The outer SMC has a low C/M ratio in both maps. High resolution maps of all AGB stars (C plus M stars) can be found in Cioni et al. (2000b ).
The distribution of C stars is described by a broken ring-like structure of high metallicity corresponding to an average with higher values to the N. The centre and the wing region correspond to an average metallicity as low as or lower. The mean age of the stellar population is Gyr in the wing (SE) and to the W. Younger ( Gyr) populations are present in the NE and perhaps in the centre of the SMC while the outermost regions are perhaps influenced by a low number statistics. These suggestions about the distribution of metallicity and mean age of the underlying stellar population deduced from C stars correspond to a % confidence level within most of the galaxy. This is true also for the individual maps shown in Fig. 5 (first & second row). It is interesting to note that a ring-like metal-rich structure is present for any SFR considered. However the specific location of the peak value of Z moves clockwise from the SE to the NW as a function of increasing look-back time. A much lower confidence level is associated to the maps obtained from M stars in particular along the bar of the galaxy. These indicate that most of the population has an average metallicity corresponding to with higher values to the NW ( or higher) and lower values E of the galaxy centre () and in the outermost regions. This metallicity distribution corresponds to an older ( Gyr) stellar population in the SE and to the N, while in the NE, NW and SW the stellar population appears younger. Although results obtained from M stars are less reliable than those obtained from C stars they both suggest that the NW of the galaxy has a higher metallicity compared to the rest of it, and that there is an old population in the wing region compared to a younger population in the centre of the galaxy.
5 Discussion
5.1 How well does the C/M ratio alone traces metallicity?
In Paper I the distribution of the C/M ratio has been interpreted purely as a tracer of metallicity concluding that in the SMC, probably because of its complex structure, there is no clear trend but patches of varying metallicity, perhaps a metal rich outer ring and metal poor regions in the centre of the galaxy. In Paper II we have shown that the C/M ratio depends also on the SFR and we have created maps of metallicity, separately for C and M stars for the LMC, that account for this effect. Here we have modified our algorithm to produce similar maps for the SMC. Contrary to the LMC analysis the distribution of the C/M ratio across the SMC (Fig. 7) and the distributions of metallicity shown in Fig. 6 have little in common. The region with high C/M values (i.e. a low metallicity) E of the centre corresponds to a metal poor (Z ) Gyr old population. On the other hand a region with a similarly high C/M ratio to the NW corresponds to with a controversial mean age, either very young from M stars or very old from C stars, but the confidence level in this area is poor (%). The bridge connecting the two regions of high C/M ratio are low in metals also from the interpretation of the LF of C stars, while the LF of M stars in this area suggests a higher metallicity and a population Gyr old. To the N of the galaxy the C/M ratio has a low value that corresponds to a metal rich () population also of intermediate-age ( Gyr) in the maps obtained from C stars while M stars maps indicate a lower metallicity () but a similar mean age. We conclude that the C/M ratio is a good tracer of metallicity only where the underlying stellar population is of intermediate-age ( Gyr). Considering the difference between the low and high metallicity contour in Fig. 6, converted into [M/H] assuming , we obtain a spread of at least dex. Perhaps when we will understand the orientation of the SMC, including its extension along the line of sight, we may reach a different conclusion.
5.2 Comparison with the literature
Combining the information about the distribution of the mean age of the stellar population across the SMC obtained interpreting the LF of both C and M stars we conclude that the overall SMC stellar population is of intermediate age (in agreement with Hardy & Durand hardur (1984)) and that the outermost stellar population, including the wing region, appears older. In fact here we do not detect a younger component as suggested by Gardiner & Hatzidimitriou (garhat (1992)) although results overlap partly only in the inner wing region (see their Fig. 5 and Fig. 7). However, we cannot exclude that part of the stellar population towards the direction of the LMC (NE) is as young as a few Gyr, on average younger than the overall SMC population. In the region observed by Dolphin et al. (dol (2001)) using HST we confirm a mean-age of about Gyr.
Even more interesting is the comparison of our results with those of Harris & Zaritsky (harr (2004)), because they also provide maps of the star formation history and mean metallicity of the SMC populations, maps which are a factor of four more detailed on both the spatial and age distributions ( deg2 versus deg2). Their results were derived from an extensive analysis of optical photometric data, which better sample stars that we have eliminated from our analysis, namely dwarfs, subgiants and giants of spectral type earlier than M. AGB stars, which are the only stars considered by us, are likely to play a negligible role in their study. Harris & Zaritsky (harr (2004)) suggest that the main body of the SMC is surrounded by a ring of moderately metal rich stars () about Gyr old (see their Fig. 6). This structure corresponds to the broken ring-like structure outlined by the distribution of metallicity obtained from the LF of C stars (Fig. 6) eventhough the ring is not connected and indicates a more metal poor population towards its southern part. The mean age that we derive for this structure is also not homogeneous and seems to indicate the presence of older stars in the W and in the SE of the broken ring compared to other locations. In addition Harris & Zaritsky (harr (2004)) derive that the population in the centre of the galaxy spans a large range of ages: from Gyr old, to the NE of it, to Gyr and as young as Myr old in the SW of it. This explains why we attribute to the stars in the central region an average age of Gyr although we conclude that this region is relatively metal poor and, accordingly to a gradual and monotonic increase of the age-metallicity relation, is supported by a predominantly old stellar population.
It is common practice to attribute to the SMC an overall metallicity corresponding to . The results discussed in this paper, as well as those obtained by Harris & Zaritsky (harr (2004)), prove that it is not sufficient to describe the whole galaxy with a unique metallicity. The spread as a function of position is not negligible as well as the age of the stellar population that contributes to it. Thus, there seems to be a good overall agreement between the main results reached by Harris & Zaritsky (harr (2004)) and ours, at least regarding those features discussed above. This is certainly reassuring and supports the validity of our approach based on AGB stars. There are however some differences between the two methods. For instance, Harris & Zaritsky provide SFR and metallicity maps with a finer resolution which is unreachable using our method because AGB stars are simply too few compared to “normal stars” – mainly dwarfs and subgiants – used by them. Moreover, by relying on star counts of normal stars, Harris & Zaritsky (harr (2004)) provide star formation histories with an age-resolution corresponding to age bins of just dex wide; such age details are unlikely to be reached using AGB stars only, since effects such as long-period variability and model uncertainties still hamper the use of AGB stars as accurate stellar clocks.
However, the use of AGB stars provides interesting possibilities, either unreachable by, or complementary to, those using optical data. First, it is easier to sample the complete AGB population of a Local Group galaxy in the near-infrared than obtaining its optical photometry complete down to the oldest turn-off across the whole galaxy; therefore, the global analysis of the AGB population might be presently applied to a larger number of galaxies. Second, in using the near-infrared photometry, we reduce considerably the complications induced by differential reddening. In fact, Harris & Zaritsky (harr (2004)) were able to apply suitable reddening corrections to their data just because they had photometry in four pass-bands () resulting from a remarkable observational effort. Even though, in the course of their work they found a previously unsuspected variation of extinction with the stellar population (Zaritsky zar99 (1999), Zaritsky et al. zar04 (2004)). It is clear that reddening constitutes a major complication in the analysis of stars formation histories using optical data, and that this is not the case when using AGB stars. Finally another advantage is represented by crowding, -band images of most galaxies that can be resolved into stars are not affected by crowding compared to their -band counterpart. Harris & Zaritsky (harr (2004)) estimated photometric errors via a linear correlation with the stellar density, which is certainly a major component of the error but not the only one.
6 Summary and Conclusions
In this paper we compare the observed magnitude distribution of C and M stars within sectors covering entirely the SMC, of a suitable size to provide a statistical significant sample, with theoretical distributions. These are derived employing suitable stellar evolutionary tracks for stars of different mass and in particular using an improved version of Marigo et al. (ma03 (2003)) models for TP-AGB stars. This allows us to well describe the behaviour of both C and M type stars as a function of magnitude. Details about the models are given in Paper II of this series as well as a similar study across the LMC. The quality of the comparison has been quantified using a test.
Surface maps indicating the most probable metallicity and mean age distribution have been obtained varying one or both parameters at the same time. Results have been compared with the information available from previous studies. With respect to the conclusions reached in Paper I, the C/M ratio is influenced by the age of the population where it is calculated, however, it remains a good tracer of the metallicity only if the population is of intermediate-age ( Gyr old). Note that here we refer to the mean age of the population in a given spatial location and not to the precise age at which that particular population began forming stars.
Our best fit models indicate that stars in the SMC are overall older and metal poorer than stars in the LMC. The average SMC population is Gyr old with older stars in the outermost regions except perhaps towards the LMC where younger stars may be present. Note that a close passage of the LMC occurred about Gyr ago and may have triggered star formation in the SMC, many clusters were also formed at this epoch (Piatti et al. pia (2005)). The metallicity along a ring-like structure surrounding the main body of the galaxy varies from to with peak values towards the NW while towards the S, comprising the centre of the galaxy, the metallicity is probably lower. However, since TP-AGB models are not perfect, and since we are testing just a family (the exponential ones) among many possible SFR histories, these values of age and metallicity may be affected by systematic errors, and are likely to change as we adopt improved TP-AGB models, and test other possible SFR functions. Instead, we consider to be more significant the detected variations of the values of these parameters (i.e. age and metallicity) across the SMC. Information about the structure of the SMC as well as about its dynamical history are also desirable to constraint its star formation history distribution.
References
- (1) Bergeat, J., Knapik, A., & Rutily, B. 2001, A&A, 369, 178
- (2) Bertelli, G., Bressan, A., Chiosi, C., et al. 1994, A&AS, 106, 275
- (3) Castelli, F., Gratton, R.G., & Kurucz, R.L. 1997, A&A, 324, 432
- (4) Cioni, M-R.L., & H.J., Habing. 2003, A&A, 402, 133 (Paper I)
- (5) Cioni, M.-R.L., Loup, C., Habing, H.J., et al. 2000a, A&AS, 144, 235
- (6) Cioni, M.-R.L., Habing, H.J., & Israel, F.P. 2000b, A&A, 358, L9
- (7) Cioni, M-R.L., Girardi, L., Marigo, P., & Habing, H.J. 2006, A&A, in press (Paper II)
- (8) Costa, E., & Frogel, J.A. 1996, AJ, 112, 2607
- (9) Crowl, H.H., Sarajedini, A., Piatti, A.E., et al. 2001, AJ 122, 220
- (10) Delmotte, N., Loup, C., Egret, D., et al. 2002, A&A, 396, 143
- (11) Dolphin, A.E., Walker, A.R., Hodge, P.W., et al. 2001, ApJ, 562, 303
- (12) Fluks, M.A., Plez, B., Thé, P.S., et al. 1994, A&AS, 141, 313
- (13) Frantsman, I.L. 1988, Ap&SS, 145, 287
- (14) Gardiner, L.T., & Hatzidimitriou, D. 1992, MNRAS 257, 195
- (15) Girardi, L., Bressan, A., Bertelli, G., & Chiosi, C. 2000, A&AS, 141, 371
- (16) Girardi, L., Bertelli, G., Bressan, A., et al. 2002, A&A, 391, 195
- (17) Girardi, L., Bertelli, G., Chiosi, C., Marigo P., 2003, IAUS, 212, 551
- (18) Girardi, L., Groenewegen, M.A.T., Hatziminaoglou, E., da Costa, L. 2005, A&A, 436, 895
- (19) Glass, I.S. 1999, in: The Handbook of Infrared Astronomy, Cambridge University Press
- (20) Hardy, E., & Durand, D. 1984, ApJ 279, 567
- (21) Harris, J., & Zaritsky, D. 2004, ApJ, 127, 1531
- (22) Marigo, P., Girardi, L., & Bressan, A. 1999, A&A, 344, 123
- (23) Marigo, P., Girardi, L., & Chiosi, C. 2003, A&A, 403, 225
- (24) Morgan, D.H., & Hatzidimitriou, D. 1995, A&AS, 113, 539
- (25) Pagel, B.E.J., & Tautvaisiene, G. 1999, Ap&SS, 265, 461
- (26) Piatti, A.E., Sarajedini, A., Geisler, D., et al. 2005, MNRAS, 358, 1215
- (27) Rafelski, M., & Zaritsky, D. 2005, AJ, 129, 2701
- (28) Rebeirot, E., Azzopardi, M., & Westerlund, B.E. 1993, A&AS, 97, 603
- (29) Skrutskie, M. 1998, in: The Impact of Near-Infrared Sky Surveys on Galactic and Extragalactic Astronomy, N. Epchtein, ed., Astrophysics and Space Science library, Vol. 230, 11 (Dordrecht: Kluwer)
- (30) van den Bergh, S. 1999, in: The Galaxies of the Local Group, Cambridge Astrophysics Series 35
- (31) Westerlund, B.E. 1997, in: The Magellanic Clouds, Cambridge Astrophysics Series 29
- (32) Zaritsky, D. 1999, AJ, 118, 2824
- (33) Zaritsky, D., & Harris, J. 2004, ApJ, 604, 167
- (34) Zaritsky, D., Harris, J., Thompson, I.B., Grebel E.K. 2004, AJ, 128, 1606