The correlations between BL Lacs and ultra-high-energy cosmic rays deflected by using different GMF models
Abstract
Some studies suggested that a correlation between locations of BL Lacertae objects (BL Lacs) and the arrival directions of the ultrahigh energy cosmic rays (UHECRs) exists. Especially by assuming the primary particles charged and using a galactic magnetic field (GMF) model to calculate the deflections of the UHECRs, the significance of correlation is improved. We construct a new GMF model by incorporating all progresses in the GMF measurements in recent years. Based on a thorough study of the deflections of the UHECRs measured by the AGASA experiment, we study the GFM model dependence of the correlation between the UHECRs and the selected BL Lacs using the new model together with others. It turns out that only specific one of those GMF models makes the correlation significant, even if neither GMF models themselves nor deflections of the UHECRs are not significantly different. It indicates that the significance of the correlation, calculated using a method suggested in those studies, is intensively depending on the GMF model. Great improvement in statistics may help to suppress the sensitivity to the GMF models.
keywords:
ultrahigh energy cosmic rays , BL Lacertae objects , magnetic fieldPACS:
98.70.Sa , 98.35.Eg , 98.54.Cm1 Introduction
Search for sources of ultrahigh energy cosmic rays (UHECRs) is very important and many researches have been done recently, including searches for correlations between the UHECRs measured by AGASA and HiRes experiments and BL Lacertae objects (BL Lacs) [1, 2, 3]. Identifying the sources will provide us direct information about the acceleration mechanisms of the UHECRs that is essential to understand phenomena such as Greisen-Zatsepin-Kuzmin (GZK) cutoff [4, 5]. The distribution of arrival directions of UHECRs, however, is remarkably isotropic. There is no correlation between astronomical objects and cosmic rays being confirmed. Arrival directions should not point back to sources unless the UHECRs are neutral, e.g. ’s or neutrinos. The charged cosmic ray primaries will be deflected while propagate through the galactic and intergalactic magnetic fields (GMF and IGMF). UHECRs above eV might be considered for small-scale anisotropy searching. Deflections of them would be so small that the uncertainty of the deflection estimation would not be harmful. If there was any correlations between the UHECRs and any known objects, the correlation should not be strongly dependent on specific GMF models. However, this has yet to be seriously tested. This paper is devoted to test the model dependence. At first, a new GMF model is constructed by incorporating all recent progresses in GMF measurements. Secondly, the deflections of UHECRs using different GMF models, including the models used for the AGASA data analysis, are compared. Finally, the correlations between the UHECRs and the selected BL Lacs are investigated to check the influences from the different GMF models.
Active Galactic Nuclei(AGNs) have been considered as UHECR sources by authors [6, 7, 8]. The AGASA data set [9] has exhibited clustering in the experimental resolution. Some authors have suggested that the clusters may be due to point sources (although no cluster has been confirmed by the HiRes experiment[10, 11] ). It has been argued that those clusters might be aligned with BL Lacs [1, 2, 3]. In those papers, significant correlations are expressed no matter what primary particles of those UHECRs are assumed, neutral or charged. In case of the proton primary is assumed, deflections of the protons in the GMF are estimated using a specific model. Even more significant correlation is claimed with the proton primary assumption.
BL Lacs are blazars (AGNs with relativistic jets directed along the line of sight) characterized in particular by absence of emission lines. This indicates low ambient matter, therefore it is a favorable condition for accelerating particles to ultra high energies. Studies have suggested that the acceleration of particles in jets can be explained using pinch mechanism and the maximum energy of particles can be greater than eV[12]. The AGASA results seem to enhance the hypothesis. However, the correlation between the UHECRs and the BL Lacs must be concretely confirmed. If the UHECRs are not neutral, the GMF model dependence needs to be investigated thoroughly before drawing any conclusion on this mechanism.
Deflections of charged UHECRs in the intergalactic magnetic fields are assumed random and unpredictable due to lack of knowledge about the magnetic fields. The deflections in the GMF are better understood because the knowledge about the GMF is greatly enhanced in the last ten years using rotation measures (RMs) of radio polarization from pulsars and extragalactic radio sources. The RM data reveals many new features of the GMF, such as a central rotating bar in the galactic plane, a dynamo structure in the galactic halo, a magnetic dipole at the galactic center (G.C.) and so on. The GMF model could be improved by taking all of the features into account. There are many GMF models available in the market depending on implementations of those observational facts. This offers an opportunity for investigating the model dependence of the correlation between the BL Lacs and the UHECRs. The GMF model is improved by incorporating the latest updates of the RM measurements in this paper, then the GMF model dependence is studied using the AGASA data and the new model and other available GMF models. This study is essential for further investigation using HiRes data.
This paper is organized as following. Improvements of the GMF model and differences between models are described in Sect. 2. Deflections of the UHECRs using different GMF models are analyzed in Sect. 3. Correlations between the BL Lacs and the UHECRs are re-estimated for the GMF model dependence testing in Sect.4. Conclusions are drawn based on the comparisons in Sect. 5.
2 Galactic Magnetic Field
The Galactic Magnetic Field (GMF) is composed of regular field and turbulent field. The regular field keeps no change in time and distributes close to matters in our galaxy. The turbulent field that is due to localized activities of objects in our galaxy. Recent studies [13] has discovered that the turbulent fields exist on all scales from a few pc’s to the whole galaxy. Strengths of the turbulent fields can be up to twice of the regular field at the same place. Directions of the turbulent fields are isotropic. To model the turbulent fields, their directions are randomly chosen and their strengths are randomly sampled from a half to twice of the regular field strength at the same place.
The regular field includes three components according to their sources and regions where they are distributed. The main component is located inside the disk of our galaxy where a majority of the galactic matter is distributed in a spiral structure. The magnetic field is also distributed in the same 2-dimensional spiral structure. Outside the galactic plane, the filed strengths decrease with the distance from the plane as the galactic matter distribution does. Directions of the fields are parallel to the disk. In the galactic halo, a pair of toric structures of the GMF are found. The toruses are located in regions about 4kpc from the disk in both upper(north) and lower(south) hemispheres. Directions of the toric fields are also parallel to the disk, rotating in a clockwise direction in the upper hemisphere but reversed in the lower. Moreover, evidences indicate that there is a dipole field at the center of our galaxy. All three components are described in details in the following subsections.
2.1 The 2-dimensional magnetic field component in the galactic disk
The field is distributed in a spiral structure as the baryonic matter does in the area beyond 4 kpc from the G.C. The model of the magnetic field component in the galactic disk is described by the following parameters :
-
•
Distance from the Sun to the Galactic center, kpc,
- •
- •
- •
The field strength at a point () in the galactic disk is
| (1) |
where , the constant phase is given by
| (2) |
and describes the change of the strength with distance from the center of our galaxy. The strengths of the fields exponentially fall off with the distance from the G.C. and reads as
| (3) |
where the scale radius kpc [18]. The direction of the field at is determined by the pitch angle and described by the two components
| (4) |
Recently, there is a clear evidence from GLIMPSE (Galactic Legacy Mid-Plane Survey Extraordinaire) about a bar-like structure, consisting of relatively old and red stars, in the central area of our galaxy. The bar is about 27,000 light years (8kpc) long, longer than previously believed. This survey also shows that the bar is oriented at 45∘ respect to a line connecting the sun and the center of the galaxy[23]. This bar-shaped structure has been built in the new GMF model for . A Gaussian is used for the description, i.e.
| (5) |
where the field strength is 4 G in the bar area that is about 1kpc wide.
2.2 The magnetic fields outside the galactic disk
There are two components in the region of . The first part is the extension of the spiral and bar-shaped field. Outside the galactic disk, the strengths of the fields decreases following a Gaussian function of , i.e.
| (6) |
Where the Gaussian width =0.6 kpc[17] being consistent with the matter distribution. Directions of the fields are the same as the 2-dimensional fields at in both the upper and lower hemispheres. This is a natural description.
The magnetic fields in the halo near the galactic disk are dominated by the extensions of the spiral field. In regions further away from the disk, the magnetic fields are found to have a dynamo-like structure which is described better by a toric field model[16]. The magnetic fields are distributed in two toruses located in the upper and lower hemispheres, respectively. The fields of the two toruses are in opposite directions. The centers of the toruses are about 1.22 kpc from the disk and are parallel to the disk. There are also evidences showing that the strengths of the fields are about 1 around z=1.5 kpc[24]. The toric fields can be modelled by
| (7) |
where is 8.5 kpc, is 1.22 kpc and is 1.85 G.
2.3 dipole magnetic fields located at the galactic center
The local magnetic fields in the vicinity of the solar system have been found to have a small vertical component about 0.3 and pointing from the South to the North [15]. This observational fact can be interpreted as that there exists a dipole at the center of our galaxy and points to the north. The dipole fields are
| (8) |
| (9) |
| (10) |
where the constant must be 184.2 , and , , are spherical coordinates at the center of galaxy and is the direction of the sun. This is a very strong dipole moment determined only by a small value measured at 8.5 kpc away from the dipole. It has to be tested with great care.
There is not enough experimental data to provide sufficient constraint on the model beyond 20kpc from the G.C., therefore the new model is only valid in a range of 20 kpc from the center of our galaxy in all directions.
In order to compare the new model with others, two models that are used in Ref. [2] (model-T) and Ref. [19, 20, 21, 22] (model-M) are chosen. Those models are widely used in the correlation analyses between the BL Lacs and the UHECRs.
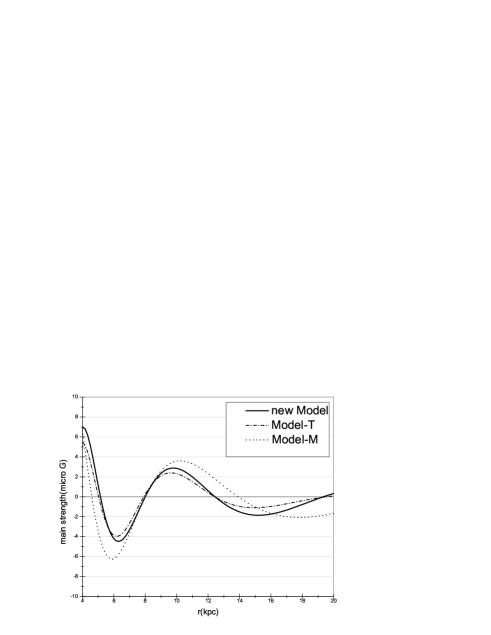
At first, the fields in the galactic disk are compared. In Fig. 1, the field strength is plotted against the distance from the G.C. along the direction . The model-T has very similar behavior compared with the new model beyond 4 kpc, including the strengths, reversals and the phases of the fields. This similarity indicates that the spiral structure and the reversals of the fields are essentially same in those two models. The model-M shows a slightly different behavior. The reversals occur at different locations and more importantly the field strengths remain quite strong at large distances, e.g. near 20kpc from the G.C., where the field strengths are reduced to very weak in the other two models. The rather large and flat field strengths between 16 kpc and 20 kpc may have strong consequences in deflections of the UHECRs. The other major difference is that the latest progress about the bar-shaped baryonic matter distribution near the G.C. has been incorporated in the new model. It may cause significant differences in the deflections of UHECRs passing by the G.C.
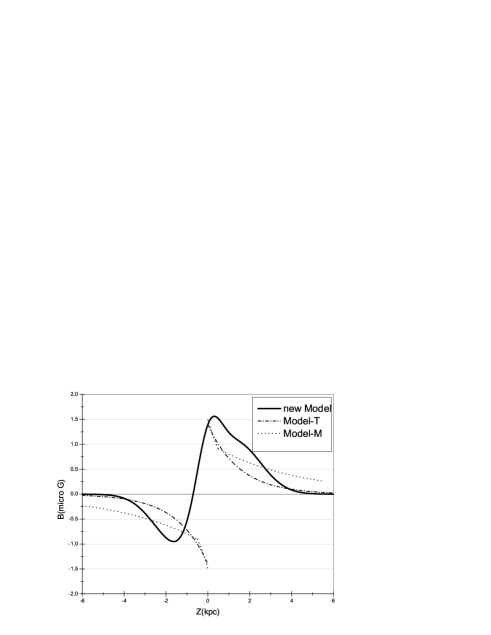
It is noticed that the strengths have discontinuities at in the descriptions of the halo fields in both the model-T and model-M. Those discontinuities occur also at all reversals of the fields in the galactic disk. Those discontinuities are not natural and cause the deflections of the UHECRs in different ranges to cancel each other. In the new model the strength has a smooth transition cross the disk at everywhere in our galaxy. In Fig. 2, the GMF strengths are plotted as functions of distances from the disk in the vicinity of the sun. It is important to note that the halo fields have similar behaviors beyond 4 kpc from the galactic disk in the new model and the model-T, however, the model-M assumes that the fields are quite strong in a larger region of the halo. The strengths of the fields are much stronger than other models beyond 3kpc from the disk. Those features cause much stronger deflections for most UHECRs that come from high galactic latitudes.
3 Analysis of deflections using three GMF models
A deflection angle is defined as the difference between the observed UHECR direction and the primary direction of UHECR i.e. the direction outside our galaxy which is calculated by using time reversing symmetry by assigning a charge to the cosmic ray particle, e.g. assuming it is a proton. The 57 UHECR events observed by AGASA experiment () adopted from Ref. [9] are used as examples for studying the deflections of the UHECRs in the GMF and model dependence in this paper.
Using the new GMF model, most of AGASA events are found to be bent less than with a peak at , only one event is bent about ( Fig. 3 ). With or without the turbulent components of the GMF, the deflection angles of the cosmic ray samples are compared in the same figure. It is shown that turbulent fields systematically shift the deflection angle by about . It is so small compared with the effect of different GMF models that the turbulent component is negligible for the UHECR samples. The average bending angle is 3.16∘.
The dipole field at the galactic center is so strong that any particles passing by the G.C. could be bent severely. In Fig. 4, the deflections are compared with or without the dipole fields. The most deflected cosmic ray is from the direction with the galactic longitude and latitude of (l,b)=(22.8∘,15.7∘) and is bent by 13.6∘ using the new model. The bending is mainly caused by the dipole field, since the trajectory is close to the G.C., i.e. the angle between the trajectory and a connection from the G.C. to the sun is about 27∘. Once the dipole field is turned off in the deflection calculation, this event is bent with a smaller angle, while the most deflected cosmic ray is replaced by another from (l,b)=(154.5∘,15.6∘) and is bent by 9.53∘. According to this analysis, one should cautiously treat those events that their trajectories are close to the G.C. with models that the dipole fields are included. To avoid a great uncertainty associated with the dipole component, those events that pass by the G.C. with close distances should be cut.
For comparison, the model-T and model-M are used to the same data set for deflection estimation. Deflections of all events are confined to using model-T (dotted dash line in Fig. 4). The average bending angle is about 3.3∘ which is not significantly different from the new model. Within the statistic fluctuations, one might draw a conclusion that the deflection estimations are essentially same by using those two models. However, using the model-T, the bending angles are populated around about , which differ from the new model. Using the new model, most of cosmic rays are bent with angles less than 4∘. 5 cosmic ray events are bent more than 7∘, which are caused by the dipole component. There is no event being bent more than 7∘ if the dipole component is turned off in the new model.
Deflections are scattered in a wide range using model-M. Many cosmic rays are bent more than (dotted line in Fig. 4). Statistically, this model has different behavior from the new model and the model-T. The wide distribution is mainly caused by the halo field. From Fig. 2, one can see that the halo field of model-M has a very large tail extending 8kpc away from the disk. On the other hand, both new model and the model-T have similar behaviors beyond 4kpc from the disk, so that the comic rays have the similar deflections even if the halo fields are very different near the disk. This indicates that the fields in the halo, for instance beyond 4kpc, are crucial for UHECR deflections. It is expected that the GMF measurements in the high galactic latitude region will be improved in the future. They are essential for understanding the cosmic ray deflections.


4 The correlation between UHECRs and BL Lacs
Using the chance probability function introduced in Refs. [1, 2, 3, 25, 26], the correlations between the UHECR events and sources were quantitatively estimated for given angular interval . The probability is calculated by counting how often the numbers of MC events and source pairs are equal or greater than numbers of real events and source pairs, i.e. , where the and the are numbers of pairs of real cosmic rays matching with sources and simulated events matching with sources, respectively. A pair is defined as an event falls in a circle with an angular radius of centered any source in a selected samples. The smaller is this probability, the more significant the correlation is. The Monte-Carlo events are generated in the horizon reference frame with a geometrical acceptance , where is zenith angle and the coordinates are transformed into equatorial frame assuming random arrival time. All events are generated with zenith angles , same as the real event samples are selected[27]. The deflections of both data and MC samples are calculated by assuming pure proton primary. If the function exists a minimum nearby the experimental resolution(about for the AGASA experiment), it indicates a correlation between the observed UHECR’s and the sources. The value of the is an estimation of the chance probability. Ten thousand sets of the MC events are generated for each case.
From the data of QSO catalog [28], 178 BL Lacs are selected according to a criterion of apparent magnitude less than Ref.[2]. The focus of this paper is the GMF model dependence of the correlation between selected BL Lacs and the 57 AGASA events with deflections. First of all, the result in Ref.[2] is reproduced using the model-T as the dash-dotted line in Fig. 5. It clearly shows a minimum around . Based on this, the authors claimed a significant correlation between the UHECRs and the selected BL Lac samples. However, the same chance probability calculated using the new GMF model and model-M do not show any correlation between the AGASA cosmic ray events and the BL Lac samples as solid and dotted lines in the same figure. This shows that the GMF model dependence is nontrivial.

As described in Sec.2, the models themselves are very similar between the new model and the model-T, except for the fields both in the galactic disk and halo is improved based on more modern observations in the new model. The artificial discontinuities at are replaced by a smooth transition between the upper and lower hemispheres and the singularity at is overcome by introducing the bar-structure in the central area in the new model.
Those small improvements are not expected to significantly change the deflections of UHECRs. This has been shown in the comparison in Sec.3. Although the deflections are not exactly same, within statistical fluctuation, the deflection angle distributions from those two models agree well with each other. This also shows that the deflection of UHECRs are correctly treated which maintains the consistency.
It is noted that the GMF model-T does not include the dipole field component. It is also aware of that the dipole field component might be determined with a great deal of uncertainty. Therefore, the deflection behaviors are studied using the new model without the dipole component. From the Fig.4, it is found that the distribution of the deflection angles is even more close to that from the model-T. Only for those the deflection angles are less than 1∘, the two models have different behaviors. Without the dipole component, a similar analysis of the correlation between the UHECRs and the BL Lacs is still not significant.
To understand the discrepancy between results of the correlation analyses from different models, the numbers of the event-source matching pairs around the AGASA resolution are listed for different GMF models in Table 1. The differences between the new model and the model-T are small. However, the chance probability jumps 2 orders of magnitudes from 10-4 to 10-2. This indicates that the function is too sensitive. A usual problem of such a sensitive method is poor stability or robustness. It may be very useful for a big sample of UHECRs where more matching pairs are expected.
It is noticed that the numbers of pairs are not affected by the dipole field component.
5 Conclusions
Using AGASA 57 UHECR () and the new GMF model, model-T and model-M, the GMF model dependence of the correlation analysis between the BL Lacs and the UHECRs are tested in this paper. To calculate the deflection of the UHECRs , charge is assigned to all events and deflections by IGMF are assumed negligible. Using the model-M, the deflections are found significantly larger than other two models. The reason is that the magnetic fields in the galactic halo extend much further from the galactic disk than the other models. The deflection behaviors of the UHECRs are very similar using the new GMF model and the model-T. Within the statistical fluctuation, the two models agree with each other in terms of the deflection angle distributions. However, the numbers of event-BL Lac matching pairs by using those two models are different, i.e. slightly larger than one Poissonian standard deviation. This difference causes a discrepancy of about 2 orders of magnitudes in the chance probability function between the two models. Both the new GMF model and the model-M does not support correlations between the AGASA UHECRs and the selected BL Lacs. This indicates that the correlation analysis method might be too sensitive to the model, especially at the stage where there is not enough statistics for the UHECR samples. To draw a conclusion on the correlation between the UHECRs and the BL Lacs, there needs to be many more UHECR event samples. There have been lots of UHECR events collected by the HiRes Experiment and Auger Experiment recently. To complete this study, however, more constraints on the GMF models based on further observations are crucial according to the discussion in this paper.
| angle | new model | model-T | model-M | |
|---|---|---|---|---|
| 12 | 12 | 6 | ||
| 12 | 15 | 6 | ||
| 12 | 15 | 8 | ||
| 12 | 16 | 9 | ||
| 12 | 18 | 9 | ||
| 12 | 19 | 11 |
Acknowledgments
We are grateful to Dr. J. L.Han for his valuable comments and discussions with us. This work is supported by NSFC under contract 10445001, Knowledge Innovation fund (U-526) of IHEP, China and by Hundred Talents & Outstanding Young Scientists Abroad Program of CAS, China(U-610).
References
- [1] P. G. Tinyakov and I. I. Tkachev, JETP Lett. 74, 445 (2001) [Pisma Zh. Eksp. Teor. Fiz. 74, 499 (2001)].
- [2] P. G. Tinyakov and I. I. Tkachev, Astropart. Phys. 18, 165 (2002).
- [3] D. S. Gorbunov et al., JETP Lett. 80, 145 (2004) [arXiv:astro-ph 0406654].
- [4] K. Greisen, Phys. Rev. Lett. 16 748 (1966).
- [5] G.T. Zatsepin and V.A. Kuzmin, Pisma Zh. Eksp. Teor. Fiz. 4 144 (1966).
- [6] V. S. Berezinsky et. al., Astrophysics of cosmic rays, Amsterdam: North Holland (1990).
- [7] J. P. Rachen and P. L. Biermann, Astron. Astrophys. 272 161 (1993).
- [8] V. Berezinsky, A. Z. Gazizov and S. I. Grigorieva, arXiv:hep-ph/0204357.
- [9] M. Takeda et al., (AGASA Collaboration) Astrophys. J. 522, 225 (1999) [arXiv:astro-ph/0008102].
- [10] R. U. Abbasi et. al., Astropart.Phys. 22, 139 (2004)[arXiv:astro-ph 0404366].
- [11] R. U. Abbasi et. al., Apj, 610, L73 (2004)[arXiv:astro-ph 0404137].
- [12] V. Berezinsky et al., arXiv:astro-ph 0509069.
- [13] J. L. Han et. al., Apj, 610, 820 (2004)[arXiv:astro-ph 0404221].
- [14] R. Beck, Space Sci. Rev. 99, 243 (2001), [arXiv:astro-ph 0012402].
- [15] J. L. Han and G. J. Qiao, Astron Astrophys. 288, 759 (1994).
- [16] J. L. Han, AP&SS, 278, 181 (2001) [arXiv:astro-ph 0110319].
- [17] J. L. Han, private communication (2005).
- [18] J. L. Han reported in Institute of High Energy Physics Chinese Academy of Sciences in 08 2004.
- [19] H. TAKAMI et al., arXiv:astro-ph 0506203.
- [20] M. Prouza and R. mda, A&A. 410,1 (2003).
- [21] J. Alvarez-Muiz et al., Astrophys. J. 572, 185 (2002).
- [22] H. Yoshiguchi et al., Astrophys. J. 614, 43 (2004).
- [23] R. A. Benjamin, et al., arXiv:astro-ph 0508325.(2005)
- [24] Han, J. L. Manchester, R. N.,and Qiao, G. J., MNRAS, 306,371-380 (1999).
- [25] P. G. Tinyakov and I. I. Tkachev, JETP Lett. 74, 1 (2001) [arXiv:astro-ph 0102101].
- [26] D. S. Gorbunov et al., Astrophys. J. 577, L93 (2002) [arXiv:astro-ph 0204360].
- [27] Y. Uchihori et al., Astropart.Phys. 13, 151(2000).
- [28] M.P. Veron-Cetty and P. Veron, Quasars and Active Galactic Nuclei, ESO Scientific Report 11th Ed. (2003).
- [29] N. W. Evans, et al., Phys.Rev. D67 103005 (2003)