Star formation feedback and metal enrichment by SN Ia and SN II in dwarf spheroidal galaxies: the case of Draco
Abstract
We present 3D hydrodynamic simulations aimed at studying the dynamical and chemical evolution of the interstellar medium in dwarf spheroidal galaxies. This evolution is driven by the explosions of Type II and Type Ia supernovae, whose different contribution is explicitly taken into account in our models. We compare our results with detailed observations of the Draco galaxy. We assume star formation histories consisting of a number of instantaneous bursts separated by quiescent periods. Diverse histories differ by the number of bursts, but all have the same total duration and give rise to the same amount of stars. Because of the large effectiveness of the radiative losses and the extended dark matter halo, no galactic wind develops, despite the total energy released by the supernovae is much larger than the binding energy of the gas. This explains why the galaxy is able to form stars for a long period ( Gyr), consistently with observations. In this picture, the end of the star formation and gas removal must result from external mechanisms, such as ram pressure and/or tidal interaction with the Galaxy. The stellar [Fe/H] distributions found in our models match very well the observed ones. We find a mean value [Fe/H] with a spread of dex. The chemical properties of the stars derive by the different temporal evolution between Type Ia and Type II supernova rate, and by the different mixing of the metals produced by the two types of supernovae. We reproduce successfully the observed [O/Fe]-[Fe/H] diagram. However, our interpretation of this diagram differs from that generally adopted by previous chemical models. In fact, we find that the break observed in the diagram is not connected with the onset of a galactic wind or with a characteristic time scale for the sudden switchover of the Type Ia supernovae, as sometimes claimed. Instead, we find that the chemical properties of the stars derive, besides the different temporal evolution of the SNe II and SNe Ia rates, from the spatial inhomogeneous chemical enrichment due to the different dynamical behaviour between the remnants of the two types of supernovae.
keywords:
galaxies: dwarfs – galaxies: kinematics and dynamics – galaxies: abundances – galaxies: individual (Draco) – Local Group – hydrodynamics: numerical1 Introduction
Dwarf galaxies are the most common class of galaxies in the local Universe (Marzke & da Costa, 1997) and they probably were much more numerous at past epochs (Ellis, 1997). Dwarf spheroidal/elliptical galaxies (dSph/dE) are found preferentially in high density environments and can be studied in nearby clusters (Popesso et al., 2006) like Coma (Secker & Harris, 1997), Fornax (Rakos et al., 2001), Virgo (Binggeli & Cameron, 1991; Phillipps et al., 1998) and Perseus (Conselice et al., 2003). However, due to their proximity, dSphs of the Local Group (see Mateo 1998 for a review) offer an unique opportunity to study in detail their structural properties, formation and chemical evolution.
Dwarf spheroidals are the least massive galaxies known, but yet, their velocity dispersions imply mass to light ratios as large as 100 . This is usually explained assuming that these systems are dark matter dominated. Actually, in the past few years both observational evidences (e.g. Łokas, 2002; Wilkinson et al., 2002; Kleyna et al., 2002; Walker et al., 2005) and theoretical works (Kazantzidis et al., 2004; Mayer et al., 2005; Mashchenko et al., 2005a, b) confirm the possibility that these galaxies are relatively massive bounded system with virial masses in the range M⊙; but, for a dissonant view see Kroupa (1997), Kroupa et al. (2005), or the review by Gallagher & Wyse 1994.
Such galaxies are very metal poor and lack of neutral hydrogen and recent star formation. Thus they were initially believed to be very similar to Galactic globular clusters and to have a very simple star formation history (SFH). Recent studies have shown, instead, that these systems are much more complex, with varied and extended SFHs. High resolution spectroscopy of several dSphs showed the presence of a wide range in metallicity (Harbeck et al., 2001). For example, abundance analyses of stars belonging to Draco and Ursa Minor have shown values of [Fe/H] in the range [Fe/H] (Stetson, 1984; Shetrone et al., 1998, 2001) with a mean value in the interval [Fe/H], depending on the authors (Aparicio et al., 2001; Shetrone et al., 2001; Bellazzini et al., 2002).
The above ranges are consistent, for some dSphs, with a single period of star formation extended in time for a few Gyr (Carney & Seitzer, 1986; Mateo, 1998; Dolphin, 2002; Babusiaux et al., 2005). As a further hint of long SFH Shetrone et al. (2001) found that their observed dSphs have [/Fe] abundances that are dex lower than those of Galactic halo field stars in the same [Fe/H] range. This suggests that the stars in these systems were formed in gas pre-enriched by Type II supernovae (SNe II) as well as by Type Ia supernovae (SNe Ia), and star formation must thus continue over a relatively long timescale in order to allow a sufficient production of iron by SNe Ia (typically Gyr).
Given the small dynamical mass inferred for dSphs, the interstellar medium (ISM) binding energy is small when compared to the energy released by the SNe II explosions occurring during the star formation period; for instance, as shown in the next section, in a dSph as Draco, the baryonic matter has a binding energy of erg, while the expected number of SN explosions in the past was , realising an energy much larger than the binding energy. It is thus quite puzzling how the ISM can remain bound long enough to allow such a long star formation duration. Actually, cosmological simulations (e.g. Kawata et al., 2005; Ricotti & Gnedin, 2005, here after RG) find rather short durations ( Gyr) of the star formation, and several authors believe that the ISM of these systems may be completely removed by violent SNe explosions (Dekel & Silk, 1986; Mori et al., 1997; Murakami & Babul, 1999; Mori et al., 2002, 2004; Hensler et al., 2004) together with the newly synthesized metals.
Gas removal via galactic winds powered by SN explosions is also invoked by Lanfranchi & Matteucci (2004)(hereafter LM) who proposed a one zone chemical evolution model with very low star formation efficiencies and high wind efficiency, which is able to reproduce the metallicity distribution and the general features of these galaxies. On the other hand, such features may be obtained also by closed box chemical evolution models by Ikuta & Arimoto (2002)(here after IA) who prescribe a low star formation rate (SFR) and relatively long duration of the SFH, as suggested by observations.
Motivated by the above arguments, in this paper we explore the possibility that dSphs galaxies formed stars at a low SFR for a long period. To compare our results with observations, we have tailored our models on the Draco galaxy: this galaxy is supposed to have experienced a star formation lasting for 3-4 Gyr, and which essentially ceased 10 Gyr ago (Mateo, 1998). Obviously, our results may be confronted with other dSphs which are strongly dark matter dominated and have similar star formation histories as, e.g., Ursa Minor (Mateo, 1998).
We run a number of three-dimensional (3D) hydrodynamical simulations to study the dynamical and chemical evolution of this system, following an assumed star formation history. A special attention is paid to the influence of both SNe Ia and SNe II on the chemical enrichment of the new forming stars.
2 The model
In this section we describe as we build up our model. We start our simulations with the ISM in hydrostatic equilibrium in the dark matter halo potential well. Any baryonic (stars or gas) contribution to the gravitational potential is neglected. We approximate the Draco observed stellar distribution with a King profile in order to properly locate the forming stars and the SNe explosions on the numerical grid (see Section 2.2). The dark halo properties are derived by the observed mass to light ratio, as described below.
2.1 Galactic model
We assume a quasi-isothermal dark halo, whose density is given by:
| (1) |
where is the core radius. The halo mass as a fuction of radius is then:
| (2) |
where . The density profile is truncated at a tidal radius in order to obtain a finite mass. The gravitational potential given by this mass profile is:
| (3) |
| Model | |||||||||||
|---|---|---|---|---|---|---|---|---|---|---|---|
| ( M⊙) | ( g cm-3) | (pc) | (pc) | ( M⊙) | ( g cm-3) | (pc) | (pc) | (pc) | () | () | |
| Draco | 62 | 4.3 | 300 | 1222 | 0.56 | 1.0 | 210 | 130 | 650 | 80 | 211 |
| Draco S | 22 | 6.5 | 160 | 1005 | 0.56 | 1.0 | 210 | 130 | 650 | 14 | 80 |
All the above quantities are derived from the models, but: a the observed central stellar density (Mateo, 1998), b the observed effective radius of the stellar component (Peterson & Caldwell, 1993), c the observed tidal radius (Irwin & Hatzidimitriou, 1995). d Value calculated inside the stellar volume.
We assume the following relations among the dark halo parameters:
| (4) |
| (5) |
| (6) |
where is the assumed value of the normalized Hubble constant. The above equations are obtained by Mac Low & Ferrara (1999) in the case of a quasi-isothermal model on the basis of similar relations found for dark matter halos with Burkert profiles in the range M⊙ (Burkert, 1995). Following Mac Low & Ferrara (1999) and Silich et al. (2001) we scale down these relations to halos with lower masses.
In the present paper we tailor our models on the Draco galaxy. The values of the parameters in the above formulae are constrained by observations of the mass to light ratio of this galaxy. We thus take into account the stellar component assuming a density profile given by the King profile:
| (7) |
where is the stellar core radius. The stellar mass inside a given radius is:
| (8) |
where . As for the dark halo, the stellar profile must be truncated at a tidal radius in order to obtain a finite stellar mass. In the following we will refer to the volume inside as the “stellar region”, and to the volume inside as the “galactic region”.
From observations of the central stellar luminosity density and the total V-band luminosity (e.g. Mateo, 1998), and adopting a stellar mass to light ratio in the V band , we estimate that g cm-3 and M⊙ (e.g. Mateo, 1998). We choose pc and pc (see e.g. Lake, 1990; Pryor & Kormendy, 1990; Irwin & Hatzidimitriou, 1995; Piatek et al., 2001; Mateo, 1998) which give the values of estimated above and also an effective radius pc, in good agreement with the observed value pc (Peterson & Caldwell, 1993). Assuming that the total mass to light ratio in the volume up to is (Mateo, 1998), we obtain the dark matter mass inside the stellar volume. In order to obtain the total dark halo mass we solve iteratively equations 4, 5 and 6 in order to find a dark halo with the right value of . Only one value of exists, which gives the observed mass to light ratio. This value turns out to be , in agreement with most recent inferred halo masses M⊙ (see e.g. Kleyna et al., 2002; Kazantzidis et al., 2004; Wilkinson et al., 2004; Łokas, 2002; Walker et al., 2005; Mashchenko et al., 2005a).
| Model | |||||
|---|---|---|---|---|---|
| ( g cm-3) | (K) | ( M⊙) | ( M⊙) | ( erg) | |
| Draco | 0.4 | 3.3 | 11.3 | 83 | |
| Draco S | 2.3 | 1.7 | 3.8 | 11 |
a Amount of gas inside the stellar volume; b Amount of gas inside the dark halo volume; c Gas binding energy.
We take into account the effect of the tidal interaction due to the Milky Way considering a somewhat less extended dark halo than that indicated by equation 6 (see e.g. Read et al., 2005; Mayer et al., 2005; Mashchenko et al., 2005b). Thus we truncate the dark matter profile at kpc (instead of 24.2 kpc) reducing the dark halo mass to a value of M⊙. This truncation does not affect the stellar component which is located in the inner region of the dark halo, and thus is much less affected by the tidal interaction (e.g. Gao et al., 2004). The complete list of parameters concerning the galactic model is given in Table 1.
In this Table a model called Draco-S is also listed. This model has been considered to test the possibility that the dark halo could be lighter than that assumed above. Actually, some authors claim that dSphs could be not virialized (see e.g. Gallagher & Wyse, 1994; Kroupa, 1997). In this case the dark halo would be absent or with a mass similar to that of the stellar component. We did not consider such an extreme case but, in order to explore the effect of a lighter dark matter halo on our models, we run separated simulations in which M⊙ which gives a . As a consequence the dark halo mass distribution is more concentrated (cf. Table 1), while the stellar component is the same of the more massive models.
We place the ISM in isothermal equilibrium within the potential well, with a temperature of . The initial gas mass is , which corresponds to a baryonic fraction given by Spergel et al. (2006). The value of the central gas density is then fixed by the assumption that the ISM extends up to the dark matter component. The complete list of parameters concerning the ISM is given in Table 2.
Finally, for computational reasons, we assume that the ISM has an initial metallicity .
2.2 Supernovae explosions
In order to understand the response of the ISM to the SFH and the SFR, we changed both of them in a number of models all with the same initial conditions. We assumed that the star formation starts when the galaxy has accreted all its baryonic mass and that stars form in a sequence of instantaneous bursts, separated by quiescent periods. Several have been considered (see Table 3) all giving rise to a final amount of stars equal to after Gyr, which is the end of the simulation. Obviously the lower is the higher is the intensity of each single burst (cf. Table 3). The prolonged star formation history adopted is consistent with recent SFHs inferred for this galaxy by observations (see e.g. Carney & Seitzer, 1986; Mateo, 1998; Dolphin, 2002) and other theoretical works (e.g. Ikuta & Arimoto, 2002).
After each starburst the stellar mass is increased by an amount which is distributed in space following equation 7. We assume that the density profile of the stars does not change with time and that the newly forming stars are distributed according to the same nowadays shape; such an assumption is supported by several studies (Mashchenko et al., 2005a; Kawata et al., 2005).

The SNe II explode at a constant rate for a period of Myr (the lifetime of a 8 M⊙ star, the least massive SN II progenitor) after each stellar burst. Thus the SN II rate for each burst is given by: where is the total number of SN II explosions occurring in a single burst. For a Salpeter initial mass function (IMF) it is . Obviously , and satisfy the simple relation . Our SFH also satisfies the relation , where is the time interval between two successive bursts. Table 3 summarizes the models characterized by different choices of the above parameters.
The SN Ia rate for a single population decreases in time after an initial rise (e.g. Greggio & Renzini, 1983; Matteucci & Recchi, 2001; Greggio, 2005). We adopted the time dependent rate given by Matteucci & Recchi (2001) according to the Single-Degenerate scenario (equation 2 of their paper with a fraction of binary systems ). For every burst the time at which each SN Ia explodes is given by the condition:
where is the time at which the previous SN Ia (belonging to the same burst) exploded.

In Fig. 1 we plot the time profile of the total SN Ia rate (given by the sum of all due to the bursts occurred within that time) for four different histories of star formation: a single burst, 10 bursts, 25 bursts and 50 bursts, all producing the same amount of total stellar mass after a time . For a single instantaneous burst the SNe Ia start occurring several Myr ( Myr) after the onset of the star formation and continue for several Gyr owing to the long lifetimes of the stars responsible of this type of explosions. Note that when more than one burst is present has an oscillatory behaviour overimposed on the general increase with time. In contrast with , does not have an intermittent nature. This difference, together with the different chemical composition of the ejecta of the two types of supernovae (see below), is responsible of some chemical properties of the stellar population (see Section 4.2).
Each SN explosion is stochastically placed into the galaxy. The probability of a SN explosion inside a radius is proportional to the stellar mass within that radius: . The angular distribution is obtained choosing randomly the azimuthal angle and the cosine of the polar angle .
| Model | |||||
|---|---|---|---|---|---|
| (Myr) | |||||
| Draco (S)-50 | 50 | 112 | 60 | 254 | |
| Draco (S)-25 | 25 | 224 | 120 | 257 | |
| Draco (S)-10 | 10 | 560 | 300 | 266 |
a Total number of SNe II; b Number of SNe II forming in each stellar burst; c Quiescent period between two consecutive stellar bursts; d Total number of SNe Ia after 3 Gyr.
Finally, we assume that each SN II ejects a mean mass of , and each SN Ia ejects . Every SN II expels 1.0 M⊙ of oxygen and M⊙ of iron (consistent with case A of Woosley & Weaver, 1995; Gibson et al., 1997, and reference therein) while each SN Ia ejects 0.15 M⊙ of oxygen and 0.74 M⊙ of iron (Gibson et al., 1997, and reference therein). These yields slightly depend on metallicity, unless metals are completely absent (Woosley & Weaver, 1995); we do not consider this dependence because it does not affect the [O/Fe] features of the stars with [Fe/H] (Goswami & Prantzos, 2000). On the Grevesse & Sauval (1998) abundance scale, the iron and oxygen abundances for the SN II ejecta are and respectively, while for the SN Ia and . The explosion energy of each SN of both types is erg.
3 The Numerical Method
We run the simulations with the 3D BOH (BOlogna Hydrodynamics) hydro-code. The 3D code uses an Eulerian, second-order upwind scheme, in which consistent advection (Norman et al., 1980) is implemented to reduce numerical diffusion. The 3D version of the code has been already used in different astrophysical contexts with satisfactory results (Marcolini et al., 2003, 2004).
In all the simulations we adopt 3D Cartesian coordinates. The total number of mesh points is . The central volume is covered by mesh points uniformly separated with pc; beyond this volume the linear mesh size increases geometrically in all directions with a size ratio of 1.14 between adjacent zones. In this way all the stellar region (where the SNe explode) is covered by the uniform grid and the grid edges are at large distances ( kpc) in order to avoid that possible spurious perturbations originating at the boundaries may affect the solution in the central region. In all simulations outflow boundary conditions are enforced on all boundary planes.
Besides solving the usual hydrodynamical equations, we also include two tracer variables representative of the SN II and SN Ia ejecta which are passively advected. Such tracers allow us to compute the chemical enrichment of the ISM due to the SN explosions. The ejecta (and the energy) of each SN explosion is initially distributed into a volume with a radius of two mesh points around the SN location.
Radiative energy losses are taken into account considering the metal dependent cooling curve as calculated by Sutherland & Dopita (1993). In any case the temperature is never allowed to decrease below K. In the Draco-S models, due to the low virial temperature of the ISM, the gas is allowed to cool down to K following, in this temperature range, the simple cooling curve given by Rosenberg & Scheuer (1973).
4 The reference model: Draco-50
4.1 Hydrodynamical evolution
It can be shown (see appendix A) that, given the SNe II rate for unit volume of our model, the supernova remnants (SNRs) overlap forming a network of tunnels filled by hot rarefied gas with large filling factors after nearly Myr. Actually, our numerical model confirms that after this time a large fraction of the stellar volume is filled by the hot rarefied gas of the SNRs’ interior while the dense SNR shells form dense cold filaments after colliding one with another. Despite the galactic gravity, the great majority of these filaments move outward pushed by the shock waves of the successive SN II explosions. In the merging cavities the gas has a mean density as low as g cm-3 and a temperature of few K, and any further star formation is inhibited in these regions. Once the SNe II stop to explode (after 30 Myr since the beginning) the global cavity collapses and the ISM goes back into the potential well; this happens nearly 20 Myr after the last SN explosion. Note that the initial binding energy of the gas erg is lower than the total energy erg released by the SNe II (see Table 3) after a single burst. The simulation thus shows that the radiative losses are substantial and prevent the evacuation of the gas, as shown in Fig. 2 (upper panel). In this figure the binding, thermal and kinetic energies of the gas are reported. It is apparent that these latter energies are much lower than the binding energy although the energy released by SNe II after only a burst is . It is interesting to note that, despite its oscillatory behaviour, the mean amount of thermal energy of the gas remains constant, and does not increase in time as usually assumed in chemical evolutionary models. The consequences of this will be discussed further in Sections 6 and 7.


After 60 Myr the ISM distribution approximately recovers the initial condition, although turbulences and inhomogeneities are now present (see Fig. 3, fourth column). A second burst of star formation then occurs leading to a second sequence of SNII explosions. The gas undergoes a new cycle of merging bubbles which eventually collapse again. The influence of the SNIa explosions on the general hydrodynamical behaviour of the ISM is not very important because, as apparent in Fig. 1, during a cycle of SN II explosions no more than 3-4 SNe Ia occur, only of the SN II number. Despite their little importance from a dynamical point of view, the role of SNe Ia is very relevant for the chemical evolution of the stars (see next subsection).
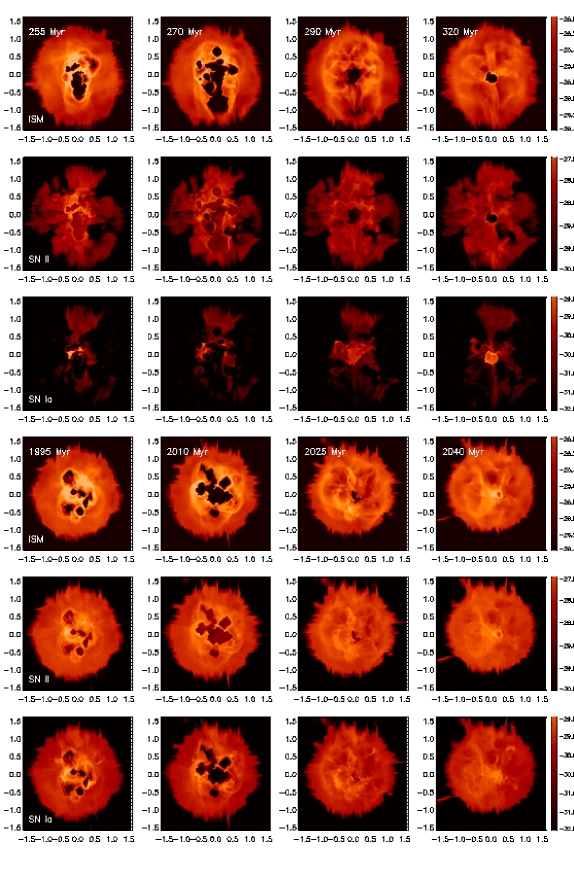
Figure 3 summarizes the evolution of the ISM and SN ejecta densities on the plane at several times. In the first and fourth rows the formation, expansion, and successive interaction and re-collapse of the bubbles created by SNe II are illustrated. The central hole visible in the last panel of the first row is due to the explosion of a SN Ia occurred at Myr. Analogously, the second and fifth rows show the evolution of the SN II ejecta density, while the third and sixth rows show the evolution of the SN Ia ejecta at the same times. From this picture it is apparent that the gas may leave the central region of the galaxy but it is never lost. At an early stage the ejecta is distributed quite clumpy, but becomes more and more homogeneous with time as more SNe II explode and the turbulence diffuse it through the ISM. Note that the SN Ia ejecta appears to be distributed less homogeneously; the reason for this is the low SNe Ia rate. A deeper discussion on this point, and its consequences on the chemical evolution, will be presented in the next subsection.
The periodic evolution of the ISM can be better seen in Fig. 4 (upper panel) where the behaviour of the gas content of the galaxy is plotted as a function of the time. In this figure three different phases of the gas are shown: cold gas with K, warm gas with K K and hot gas with K. This distinction helps us to understand the thermal evolution of the gas and the exchange among the cold, warm and hot phases. The warm and hot gas phases reside mainly in the stellar region, and their time evolution is indicated by the dashed and dot-dashed lines, respectively.
For the sake of simplicity, in Fig. 4 we show only the evolution during five cycles in the time interval Myr. The evolution over the entire period of 3 Gyr shows essentially the same periodicity, as can be seen in Fig. 5 (upper panel) where the cold gas mass content of the galaxy is plotted up to 3 Gyr.
Despite its oscillatory behaviour, nearly 30% of the initial gas is located beyond the galactic region. However, this gas is not lost by the galaxy but rather expands at larger distances remaining gravitationally bounded. Such a gas is obviously the most susceptible to be lost by ram pressure and tidal interaction with the Milky Way (see e.g. Marcolini et al., 2003; Sofue, 1994; Mastropietro et al., 2005; Mayer et al., 2005). Indeed, since SNe feedback is not able to evacuate the ISM from the galaxy, in this scenario we must invoke an external mechanism, such as ram pressure stripping and/or tidal interaction, to remove the gas and thus terminate the star formation. Ram pressure due to gaseous haloes of the Milky Way and M31 may also explain the observed correlation between stellar content and the galactocentric distance of dwarf galaxies (van den Bergh, 1994).

4.2 Chemical evolution
The upper line in the top left panel of Fig. 6 represents the total amount of SN II ejecta expelled during 3 Gyr; the other two lines illustrate the evolution of the ejecta content inside the galactic (middle line) and the stellar (lower line) regions. The SN Ia ejecta has a similar behaviour (lower left panel). Note that along the entire evolution the fraction of the ejecta present inside the stellar region remains very low ( after 3 Gyr). This is the amount of metals which contributes to the metallicity of the forming stars. A large fraction of the ejecta is pushed at larger distances by the continuous action of the SN explosions. Indeed, nearly half of the ejecta still resides inside the galactic volume where it mixes with the ISM. The missing 40% of the ejecta is still bounded and is mostly found in the neighbourhood of the galaxy, although a part of it is lost through breaches in the cold gas.

Further insight on the chemical evolution is given by Fig. 7. In the upper panel we plot the [Fe/H] distribution function (MDF) of the long-lived stars (with a mass M⊙), i.e. the mass fraction of these stars as a function of their [Fe/H]. The distribution is given at four different times in order to show its time evolution.
We construct the MDF as follows. At every starburst the stellar mass in each ith computational cell of volume is increased by an amount , where represents the density of the newly formed stars (c.f. Section 2.2). Stars are not created in those cells where K. The number of such cells in each starburst is however small and the general total stellar profile is still well described by equation 7. The newly formed stars are assumed to have the same chemical composition of the ISM in the ith cell at the moment of the burst:
| (9) |
where , and is the initial ISM abundance of the generic element .
At early times the MDF is rather broad reflecting an inhomogeneous distribution of the SN ejecta inside the galaxy because of the still low number of SNe explosions. As the number of the bursts increases, the ejecta becomes distributed more and more homogeneously, and the MDF of the newly formed stars peaks around the mean value [Fe/H], which increases with time. For instance, the stars forming in the first burst are distributed rather shallowly in the range [Fe/H], while those formed in the last burst are clustered in the range [Fe/H].
In Fig. 8 (upper panel) we show the final MDF together with the contribution due to SNe II only. Confronting these two types of contributions, we note that the effect of the enrichment due to SNe Ia produces a larger dispersion particularly evident at the high [Fe/H] tail; this spread lowers the MDF maximum because the curve integrals (i.e. the total mass of the stars) must be the same.
The reason for the spread is given by the highly inhomogeneous distribution of the SN Ia ejecta. Although the number of SNe Ia explosions after 3 Gyr is only 4.5% of that of SNe II, each of them expels 10 times more iron mass, and thus their contribution to the ISM metallicity is relevant. This contribution is particularly conspicuous in the high [Fe/H] tail of the MDF because, contrary to SNe II, SNe Ia may explode at any time, and in particular during the quiescent phases of SNe II. During these periods the ISM re-collapses and the SN Ia ejecta expelled in these phases remains more localized because of the larger density of the ambient medium. Actually, a rough calculation indicates that the SN Ia porosity (see appendix A) at this stage is (assuming a mean ). This means that the SNe Ia remnants are located quite apart one from another. Stars forming in these regions enriched by SNe Ia have an enhanced [Fe/H] ratio compared to the stars forming in the rest of the stellar volume, and are responsible of the high [Fe/H] tail of the MDF.
At the end of the simulation we obtain a mean value of [Fe/H]=-1.65 with a spread of 1.5 dex, in reasonable agreement with observations (Lehnert et al., 1992; Shetrone et al., 2001; Aparicio et al., 2001; Bellazzini et al., 2002), while the maximum value of the distribution occurs at [Fe/H]-1.5.
In the lower panel of Fig. 8 the final MDF is compared with the MDF obtained by Bellazzini et al. (2002), using both the abundance scale by Carretta & Gratton (1997) and Zinn & West (1984). The calculated MDF is in good agreement with the observed one at the high [Fe/H] end. The tail of our MDF in the low [Fe/H] range is instead higher and less steep than the observed MDF. This is likely due to our simple SFH (bursts of equal strength) assumed. A more realistic SFH, with weaker early bursts, could depress our final MDF at low [Fe/H]. Also, the relative insensitivity of the method adopted by Bellazzini et al. (2002) to the most metal poor stars, possibly reduces the discrepancy indicated in Fig. 8.


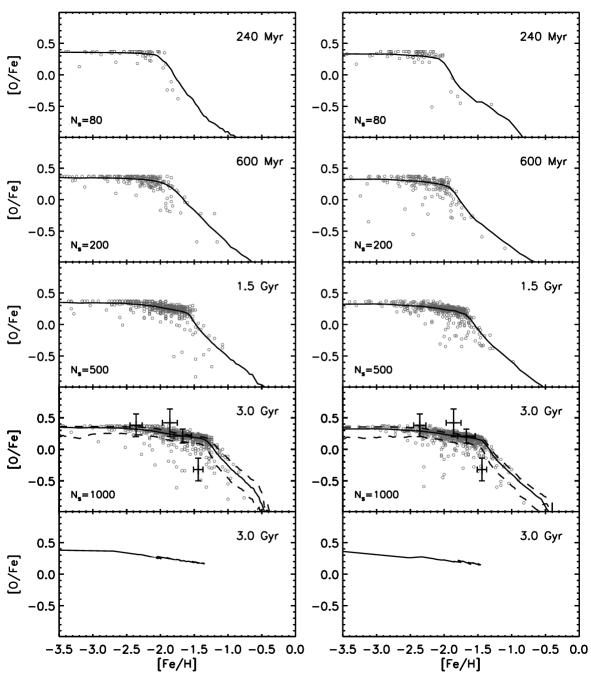
ThE effect of the MDF tail at high [Fe/H] discussed above is particularly evident in Fig. 9 where the diagram [O/Fe]-[Fe/H] is shown at four different times. The open circles form a statistically representative sample of the stellar distributions in [O/Fe] and [Fe/H]. At each time the sample is composed by a fraction of the total number of stars. The solid line represents the mean value of the [O/Fe] distribution for any fixed [Fe/H]. The dotted lines in the fourth panel indicate the 1 spread of this distribution. At any time a plateau at low values of [Fe/H] is delineated by the solid line, followed by a sharp decrease. With time the break in the distribution moves toward higher values of [Fe/H]. The plateau is due to the initially dominant contribution of SNe II to the Fe abundance: being the oxygen formed mainly by SNe II, the ratio [O/Fe] must remain nearly constant as the iron increases. The small negative gradient of the plateau is due to the slowly growing contribution in the Fe enrichment by SNe Ia. The sharply decreasing branch at higher [Fe/H] is due to stars formed in the regions of ISM recently polluted (mostly by iron) by SNe Ia. For this reason the stars populating the solid line in the decreasing branch are distributed diagonally nearly following a -1 slope. A glance at Fig. 7 and Fig. 9 shows that the stars on the decreasing branch populate the MDF high [Fe/H] tail, while the majority of the stars occupies the high [Fe/H] edge of the plateau in the [O/Fe]-[Fe/H] diagram.
In the fourth panel of Fig. 9 data from Shetrone et al. (2001) are reported. The four stars seem more uniformly distributed in [Fe/H] than our sample. This is because these four stars have been selected in order to span the largest range in [Fe/H] (Shetrone, private communication); thus their distribution has no statistical meaning and is not expected to follow our sample distribution. We note that the point with the lowest [O/Fe] is displaced by dex to the left relative to the solid line denoting the descending branch. This discrepancy does not represent a severe drawback for our model; there are in fact several explanations for it. On the theoretical side, had we started with a more extended gaseous halo, we would have found a lower mean value of [Fe/H], moving our sample to the left in the [O/Fe]-[Fe/H] diagram. On the observative side, the derived mean [Fe/H] value depends on the metallicity scale adopted (cf. the lower panel of Fig. 8): for Draco it ranges in the interval [Fe/H] (Aparicio et al., 2001). Shetrone et al. (2001) (whose data reported in our figure are, to our knowledge, the only published for Draco) find [Fe/H]: it is reasonable to hypothesize that, with a different choice of the metallicity scale, the observed stars reported in Fig. 9 would shift to the right by an amount very nicely fitted by our model.
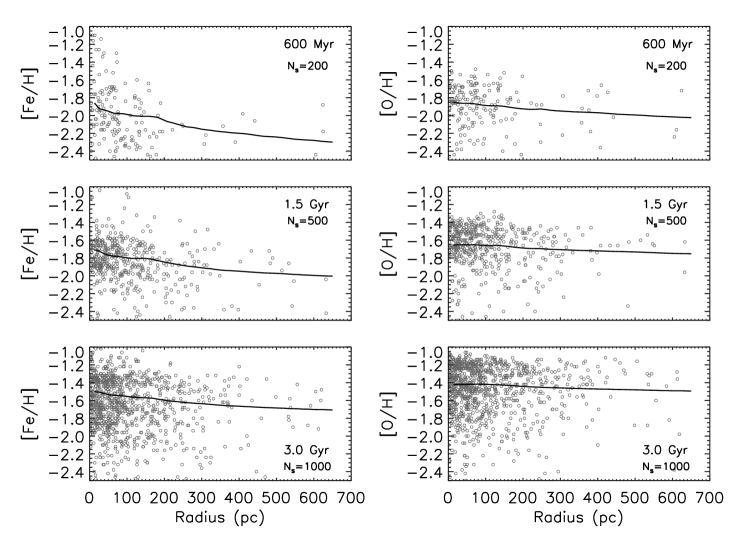
It is interesting to analyse the radial distribution of the ratio [Fe/H] within our model. Age/metallicity gradients have been claimed by some authors (Harbeck et al., 2001; Lee et al., 2003; Bellazzini et al., 2005) to be present in several dSphs while others do not find them (Hurley-Keller et al., 1999; Aparicio et al., 2001; Carrera et al., 2002; Babusiaux et al., 2005). The radial dependence of the ratios [Fe/H] and [O/H] at three different times are shown in Fig. 10 where the circles form a statistically representative sample of the stars and the solid lines represent the radial profiles of the mean values of [Fe/H] and [O/H]. A big metallicity spread of dex is present at any radius (consistent with some observations, e.g. Tolstoy, 2004), and the profiles have been obtained splitting the galaxy in 50 spherical shells and averaging inside each shell.
A slight metallicity gradient is actually present and reduces with time. After 3 Gyr the difference between the central and the outer region is 0.2 dex in [Fe/H], consistent with observations (Harbeck et al., 2001), while the [O/H] gradient is virtually absent. The origin and the evolution of the gradients are given by the following reasons. The ejecta are subject to two opposite effects: on one hand they are released from SNe distributed following a King profile, thus more concentrated toward the centre, and on the other hand the hydrodynamics tend to distribute them more uniformly. With time the mean gas metallicity increases while becoming more and more uniformly distributed in space, and the metallicity gradient, essentially given by the freshly expelled metals, becomes less and less important.
We point out that the [O/H] gradient is shallower than that of [Fe/H]. In fact, a substantial amount of iron present in the ISM is produced by SNe Ia whose ejecta, as discussed above, tends to remain more localized toward the centre (in particular during the quiescent phases) than the oxygen, which is expelled mainly by SNe II.
5 Other models
5.1 Draco-25
In order to understand the influence of the SFH on the chemical and dynamical evolution of the ISM, we computed a model similar to the reference one but with a time interval Myr between two successive bursts. As a consequence yr-1, doubled respect to the rate of the reference model.
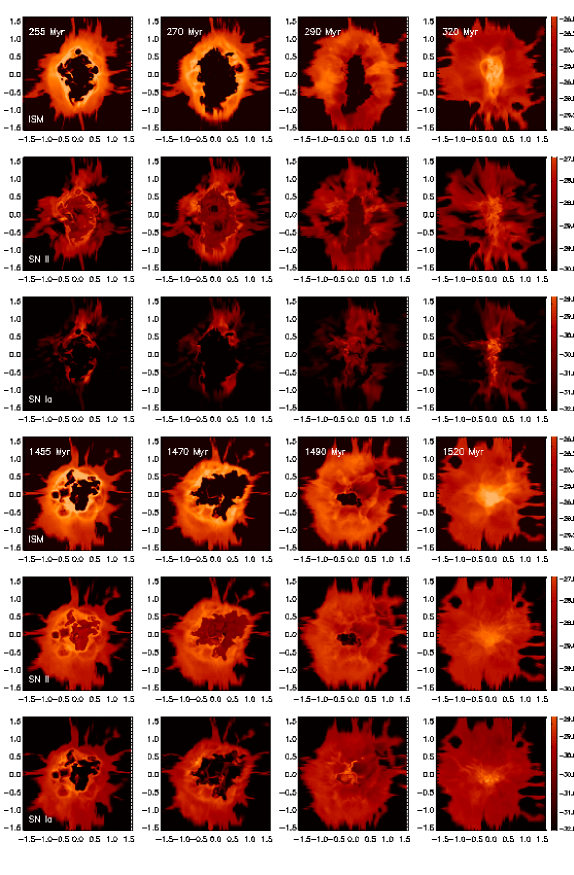
Due to this higher rate, the size of the cavities forming in the ISM inside the stellar region are larger (see Fig. 11). The gas at the periphery of the galaxy results to be more extended and less dense than in the reference model (compare Fig. 11 and Fig. 3). However, although the total SN energy released during one burst is 2.7 times the initial ISM binding energy, radiative losses are still effective enough to impede the gas to be lost by the galaxy. Given the larger value of , the ISM has more time to pile up in the central region during the re-collapse before the next burst, thus reaching higher densities than in the Draco-50 model. In this region, which has actually the dimension of the stellar region, conditions are recovered for a new burst of star formation.
The evolution of the ISM mass content inside the galactic and stellar regions is shown in Fig. 5 (lower panel). Contrary to the reference model, here the oscillations are much more regular because of the larger value of .
The fraction of the ejecta present inside the stellar region at the end of the simulation (see Fig 6) is slightly smaller than in the reference model. Indeed, being the single bursts more powerful, the hot metal rich gas has more chances to leave the galaxy. As a consequence, the MDF peaks at a lower value of [Fe/H].
The chemical enrichment of the galaxy is synthesized in the lower panels of Fig. 7 and Fig. 8, and the right column of Fig 9. We obtain a final value [Fe/H] with a spread of 1.5 dex. The descending branch in the [O/Fe]-[Fe/H] diagram is now closer to the star with the lowest value of [O/Fe]. In general, however, these results show that the chemical evolution is slightly dependent on the adopted SFH.
In Fig. 12 we plot the final radial distribution of the ratio [Fe/H] and [O/H], as well as the radial profile of their mean values. As for the reference model, the chemical gradient results to be very shallow at the beginning of the simulation, and tends to disappear with time.
5.2 Draco-10
In this model only ten bursts occur during 3 Gyr. They are separated in time by 300 Myr, and each of them is five times more powerful than those of the reference model.
Each single burst tends to expand the ISM more than in the previous models, but radiative losses are still able to impede the gas to leave the galaxy. Indeed, as apparent in Fig. 4 (lower panel), the mass content of the cold gas inside the stellar region may become as low as M⊙ just after the SNe II activity, but then grows again to the initial value during the SNe II quiescent phase. The gas continues to pile up toward the centre until, at Myr, rebounds and its content decreases slightly (see the depression of the temporal mass profile at Myr).
After 600 Myr the chemical properties of the forming stars differ only slightly from those of the previous models at the same time, indicating that the chemical evolution is rather insensitive to the chosen SFH. For this reason, given the huge amount of CPU time required to complete the model, we stopped our simulation after Myr.
5.3 Draco-S
As discussed in Section 2, these models have been run to test the possibility that the dark halo could be lighter than the one we assumed in the reference model. In fact, relaxing the hypotheses of isotropic velocity dispersions and virial equilibrium, one obtains mass-to-light ratios much lower than commonly adopted (see e.g. Gómez-Flechoso & Martínez-Delgado, 2003, for the case of UMi). The non baryonic mass content (and consequently the baryonic one) in the model Draco-S is assumed to be only one third of the standard model (c.f. Table 1 and 2): M⊙ (Mateo, 1998) which gives a M.
We explored the same SFH already discussed for the previous models with , 25 and 50. In Fig. 13 the evolution of the mass content inside the dark matter halo is shown for all the three models. The galaxy gets rid of its ISM in all models on a timescale which increases with the number of bursts. This is due to the fact that when only few bursts occur, each of them is rather powerful (c.f. section 2.2), and can eject the ISM sooner than many weaker bursts. In all cases the gas is lost before Myr, a time too short to be compatible with the star formation duration inferred by the observations (e.g. Mateo, 1998; Dolphin, 2002). Our results (in the limit of their assumptions, e.g. the ISM mass content and distribution are related to the DM ones and self gravity is neglected) indicate that the total must be quite high and the dark halo must extend far beyond the stellar component.
6 Comparison to other models
The SFH and the chemical enrichment of Draco and other dSphs have been discussed in terms of purely one zone chemical or cosmological models by several authors.
-
•
In their one zone model LM find that the plateau in the [O/Fe]-[Fe/H] plane is representative of SNe II enrichment, although their plateau level is higher than that found in our models because LM are able to distinguish the contribution to the metal production by SNe II of different masses, while we assume that every SN II has the same (average) chemical composition. The sudden [O/Fe] decrease at larger values of [Fe/H] is interpreted by LM as a consequence of a galactic wind which decreases the amount of available gas; the formation of new stars is thus slowed down and so is the production and the injection of elements into the ISM by SNe II. SNe Ia, instead, have progenitors with much longer evolutionary timescales (Matteucci & Greggio, 1986), and continue to inject iron lowering the [O/Fe] ratio. On the contrary, in our models we do not have the formation of any wind and the change of the slope in the [O/Fe] vs. [Fe/H] diagram is given, as discussed in Section 4.2, by the inhomogeneous distribution of the SNIa ejecta. In both models the descending branch is less populated than the plateau. In the LM models this happens because the most metallic stars form during the wind phase, when the star formation rate is greatly reduced; more metallic stars can be obtained increasing the star formation efficiency, although this leads to an overestimate of the [O/Fe] ratio.
It is interesting to discuss further the differences between our models and those of LM. In these latter models the star formation rate depends on the ISM density and varies with time, while the SN II efficiency in heating the ISM has a value assumed “a priori” ( in their notation), i.e. only a small fraction of the energy of the SNe II explosions is transferred to the surrounding gas, the rest being radiated away. This energy fraction is constantly accumulated in the ISM, and the occurrence of a galactic wind at a certain time is unavoidable. The choice of the value of is crucial for the behaviour of the models. An increase/decrease in its value anticipates/retards the occurrence of the wind (for a fixed potential well). Thus, an appropriate choice of the ratio between thermalized SN II energy and potential well depth is required to obtain a reasonable duration of the star formation. Our models, in a sense, work opposite to those of LM. Intensity and duration of the star formation are “a priori”, while the fraction of SNe II energy transmitted into the ISM is regulated by hydrodynamics and radiative losses. In our models winds either occur very soon or do not occur at all. In this scenario, a prolonged star formation period as that inferred for Draco (and other dSphs) suggests that the termination of star formation is due to an external cause such as gas stripping by the Galaxy (e.g. Mayer et al., 2005).
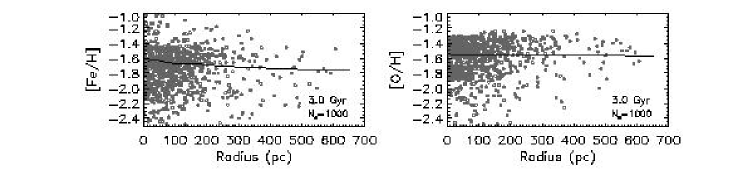
Figure 12: Radial distribution of [Fe/H] (left panel) and [O/H] (right panel) at the end of the simulation for the model Draco-25. The solid lines represent the radial profile of the mean values. has the same meaning as in Fig. 9. -
•
One zone chemical models for Draco (and other dSphs) have been presented also by IA who do not take into account the possibility of galactic winds and assume that the gas removal should eventually result from an external mechanism, just as in our scenario. In absence of a wind, the IA interpretation of the sudden decline of [/Fe] in the [/Fe]-[Fe/H] diagram is based on the different temporal behaviours of the SN II and SN Ia rates. Given the much longer evolutionary timescales of these latter, an (assumed) sudden switchover of the iron source from SNe II to SNe Ia creates the break in the [/Fe] ratio at a certain [Fe/H] value, corresponding to the time at which a significant number of SNe Ia is assumed to explode. This time was evaluated to be 1.5 Gyr by Yoshii et al. (1996) who studied the stars in the solar neighbourhood. Before the effect of SNe Ia on the metallicity is not considered; for this reason the plateau obtained by IA is totally flat (see their Fig. 1). After 1.5 Gyr the Fe ejected by SNe Ia produces a decline in [ /Fe]. However, this decline is less pronounced than in our models and in those of LM. Indeed, such a decrease must not be confused with the decreasing branches obtained by the models of LM and ours. Rather, it is equivalent to the slow decrease of the plateau shown in these latter models where the action of the SNIa starts (and grows) just after 30 Myr. As a check, we calculated the average ratios [O/Fe] and [Fe/H] inside the stellar volume mimicking an one zone model. The results are shown in the lowest panels of Fig. 9: no break is present and the plateau has a slope similar to the mean slope of IA. In order to take into account the larger decrement of [/Fe] observed IA must invoke a stellar mass function steeper than the Salpeter one, an assumption not necessary in our models.
-
•
Cosmological simulations of the dynamical and chemical evolution of dSphs have been recently performed by RG. These authors point out that objects with masses below are able to form stars before the reionization epoch (12.5-13 Gyr ago) losing their gas because of the photoheating by massive stars inside the galaxy (and not by the external ionizing background). More massive objects, instead, retain a fraction of their gas even after the reionization. Thus, the duration of the star formation in small objects is rather short ( Gyr), while in more massive galaxies it can be protracted for a longer time. RG identify these latter galaxies with the observed dwarf irregulars, while the observed dSphs properties are reproduced by the smaller simulated objects. These latter objects show a metallicity spread that can be understood in terms of hierarchical accretion of subhalos containing stars with different metallicities. RG thus argue that the observed metallicity spreads are not necessarily an indication of star formation extended over several Gyr, as claimed by Grebel & Gallagher (2004).
Comparing the above results with ours, we point out that the longer star formation assumed in our models (with M⊙) is marginally consistent with the finding of RG. We also stress that, although the metallicity spreads found in our models derive from a completely different mechanism, yet we confirm that large spreads of [Fe/H] can rise quite early in our simulations (cf. Fig. 7).

Figure 13: Time evolution of the mass of the cold ISM ( K) inside the galactic region for the Draco-S models. The mass is normalized to the initial mass inside the galactic region. Solid line: Draco-50; dashed line: Draco-25; dotted line: Draco-10. The stars indicate the time at which the stellar bursts occur. 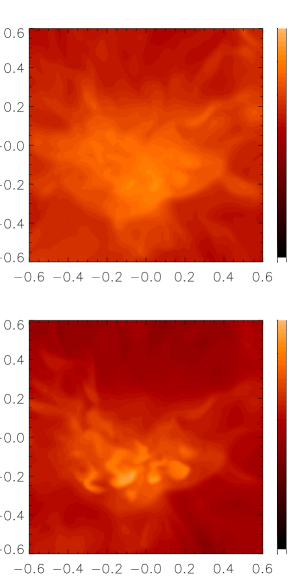
Figure 14: Central distribution on the plane of the SN II (upper panel) and SN Ia (lower panel) ejecta densities for the Draco-25 model at Myr. These panels are a close up view of the last two panels of the fourth column in Fig 11. Distances are given in kpc. On the other hand it is known (Shetrone et al., 2001) that dSphs have [/Fe] ratios dex lower than those of the Galactic halo fields stars in the same [Fe/H] range, whose [/Fe] ratios are 0.3 (Shetrone et al., 2001). This usually is interpreted as a signature of a longer star formation occurred in dSphs in order to allow a larger production of iron by SNe Ia (Matteucci, 2003). Alternative suggestions based on different IMF (e.g. Shetrone et al., 2001) or on less rotation of massive stars (compared to solar neighbourhood) have also been invoked (Tsujimoto, 2006), but we do not consider here these speculative hypotheses.
A glance at Fig. 9 illustrates that in our simulations a decrement of dex in the plateau is achieved after Gyr. Thus we conclude that, at least in our models, only a prolonged star formation history ( Gyr) can account for the chemical differences between the Galactic halo and the dSphs. Such a long SFH for dSphs is also found in the chemical models by Fenner et al. (2006) who are unable to reproduce the Ba/Y ratio unless stars formed over an interval long enough for the low-mass stars to pollute the ISM with -elements.
Fig. 9 also shows that the formation at early times of stars with low [O/Fe] and relatively large [Fe/H] is not precluded, although must be regarded as a rather rare event. Thus our models do not exclude short star formation durations, although the formation of stars with low [ /Fe] is less probable.
-
•
Cosmological simulations of dSphs have been worked out also by Kawata et al. (2005) who, in line with RG, find a rather short ( Gyr) duration of the star formation. Kawata et al. (2005) focus on Sculptor galaxy in which Tolstoy et al. (2004) found two distinct populations, with the lower metallicity stars more spatially extended than the higher metallicity stars. This is interpreted by Kawata et al. (2005) as a consequence of the metallicity gradient which is present in their simulated system. This gradient is similar to those found in our simulations at early times; in our models, however, the gradients decrease with time. We thus find that, if two distinct stellar populations arise from a metallicity gradient (different possible mechanisms leading to different populations are given by Tolstoy et al. 2004), then their presence is indicative of a short star formation history.
We conclude our comparison with the model by Kawata et al. (2005) briefly highlighting two differences: ) our models do not get rid of the gas, while the in model by Kawata et al. (2005) the SN feedback leads to a blow-out phase; ) no break is present in the [O/Fe]-[Fe/H] diagram obtained by Kawata et al. (2005). The first difference is due to the initial amount of gas assumed by these authors, which is an order of magnitude lower than ours; as a consequence, the gas binding energy is much lower and the radiative losses (which are proportional to the square of the gas density) are greatly reduced, allowing the SNe to vent the gas away. The second difference comes, as fully realized by Kawata et al. (2005), from having these authors assumed for the SNe Ia the model proposed by Kobayashi et al. (2000) who suggested that SNe Ia are inhibited in the stars with [Fe/H].
7 Discussion and conclusion
7.1 Dynamical evolution
We run several 3D numerical models in order to understand the chemical and dynamical evolution of the ISM in dSphs as a function of several parameters like the SFH and the amount of dark matter. Given the large amount of cpu time required to complete a single model, we could not explore a vast region of the parameter space; instead, we tailored our galaxy model on Draco and considered SFHs similar to those supported by the observations for this galaxy. All the adopted SFHs last 3 Gyr and give rise to the same final amount M⊙ of stellar mass. The stars are supposed to form in a sequence of instantaneous identical bursts separated by quiescent periods; different SFHs differ by the assumed number of bursts, but the total number of SNII (but not SNIa) is always the same.
Although the total energy released by the SNe is orders of magnitude larger than the binding energy of the ISM, the galaxy retains almost the totality of its initial gas, unless rather light dark haloes are assumed. This is due to the huge efficiency of the radiative cooling, despite the low mean metallicity ( ) of the gas. For most parameter combinations tested in this study, such effective radiative losses prevent the gas to slowly accumulate the SN energy. With our assumptions, the galaxy never gets rid of its gas, unless the potential well is rather shallow (see Section 5.3); in this latter case a galactic wind starts quite soon and the galaxy looses all its gas in less than 200 Myr.
In the light of the above discussion, we conclude that the dark halo of Draco must be massive and extended in order to retain the gas for a period of several Gyr, the duration of its star formation. This in turn implies the need of an external mechanism to remove the gas and end the star formation, as gas stripping and/or tidal interaction by the Galaxy (Mayer et al., 2005).
7.2 Radiative losses
The above arguments highlight the crucial role played by the radiative cooling in our models: would these losses be less substantial, galactic winds could develop more easily and the evolutionary scenario would drastically change. A correct evaluation of the radiative losses in the numerical simulations is thus of the utmost importance. Unfortunately, it is known that in numerical hydrodynamics several factors concur to degrade an accurate estimate of these losses. More confusing, some factors lead to an overestimate, while others to an underestimate.
Overestimates occur particularly at the contact discontinuities separating hot rarefied and cold dense gas phases because the intrinsic diffusion of the numerical scheme spreads these discontinuities over several mesh points creating a gas phase with intermediate densities and temperatures characterized by a large emissivity. Although several physical processes (such as turbulences and heat conduction) really smear out these discontinuities, the numerical spread is likely to be larger than the physical one.
Underestimates as well as overestimates of the radiative cooling at the contact discontinuities may occur when in the numerical code a cooling curve calculated in a regime of ionization equilibrium is implemented (as we actually do). A hot plasma undergoing strong radiative losses may cool at lower rates (Sutherland & Dopita, 1993) or at higher rates (e.g. Borkowski et al., 1990) relative to the condition of ionization equilibrium, depending on its thermal history.
In order to test the sensitivity of our models to the amount of radiative losses, we rerun model Draco-50 reducing the radiative cooling by a factor of ten. Also in this case the great majority of the gas remains bounded to the galaxy. In particular % of the gas remains inside the galactic volume, while only 30 % (with some oscillations) stays in the stellar region. Given the reduced effectiveness of the radiative cooling, the hot gas can expand more efficiently pushing most of the ISM at larger distances and creating a bubble encompassing a large fraction of the stellar volume. We thus conclude that the ability to retain the gas is a robust property of our model and depends essentially on the prolonged and thus low SNe II rate. As an argument in favour of this conclusion, we quote Mori et al. (2002) who worked out a 3D simulation of a subgalactic object with a potential well and an amount of ISM quite similar to our, with a gas binding energy four times larger but a number of SNe II only two time higher. Despite this more disadvantageous proportion, most of the gas is blown away because the SNe II are made exploding all together instantaneously.
7.3 Chemical evolution
Although the majority of the metals expelled by SNe is still inside the dark matter halo or in its neighbourhood (and is still bounded to the galaxy), only a small fraction () is located inside the stellar region. This is the amount of metals which contributes to the metallicity of the forming stars. Thus, being the chemical elements observed in stars the main observational constraints in chemical evolution models, assuming that the majority of the SN products stay in the observable zone may lead to infer non realistic galactic properties and/or stellar properties. No matter if metals are lost by galactic winds (as assumed by some dSphs chemical models Robertson et al., 2005; Carigi et al., 2002) whether are pushed at higher distances, our finding is constitent with the assumption that the majority of the metals do not enrich the newly forming stars.
At the early stage of the evolution the [Fe/H] distribution in the ISM is rather spread. As the number of the bursts increases with time, the metals expelled by SNe become distributed more and more homogeneously. This behaviour is reflected in the MDF which narrows around the mean value [Fe/H], which increases with time. At the end of the simulations we obtain a mean value of [Fe/H]-1.65 with a spread of 1.5 dex (Lehnert et al., 1992; Shetrone et al., 2001; Aparicio et al., 2001; Bellazzini et al., 2002), while the maximum value of the distribution occurs at [Fe/H]=-1.5 for the reference model Draco-50, and at [Fe/H]=-1.6 for Draco-25.
We can also reproduce satisfactory the general observed behaviour of [O/Fe] in the [O/Fe]-[Fe/H] diagram. In dSphs this diagram shows a break in [O/Fe] occurring at [Fe/H], with an approximate constant level of [O/Fe] at lower metallicities and a monotonic decrease at larger metallicities. In agreement with previous chemical evolution models (e.g. LM and IA) we regard the stars populating the plateau as polluted mainly by metals produced by SNe II. The shallow decline of the plateau at larger values of [Fe/H] is due to the contribution to the iron enrichment by SNe Ia which increases with time.
Instead, we attribute the decreasing branch in the [O/Fe]-[Fe/H] diagram to the low value of the porosity of SNIa remnants: given the low SNIa rate, these remnants are located quite apart one from another, and the iron ejected by SNe Ia is distributed rather inhomogeneously through the stellar volume (cf. Fig. 14). As a consequence, stars forming in the (relatively small) volume occupied by SNIa remnants have a ratio [O/Fe] lower than those forming elsewhere. This effect can naturally account for the stars with low [O/Fe] and high [Fe/H], without necessarily invoking a complex SFH as suggested for some dSphs (Carigi et al., 2002).
In our models the plateau and the descending branch become populated at the same time, although with different proportions. As the galaxy evolves, the break moves toward larger values of [Fe/H]. This interpretation of the [O/Fe]-[Fe/H] diagram differs from previous chemical models in which the break appears only after a specific time, without changing its position later on. LM interpret the break as a sign of the occurrence of a galactic wind. IA, who adopt a closed-box model, associate the break to a sudden switchover of the SNe Ia explosions at a specified time Gyr. We claim that there is no direct link between the break presence (and position) and . This conclusion is reinforced by the time evolution of the SNIa rate (cf. the solid line in Fig. 1) which, after a rapid rise before Gyr, varies only by a factor of 2 over 2.5 Gyr; this smooth temporal profile can not justify the break in the [/Fe]-[Fe/H] diagram (unless a drastic reduction in the star formation rate occurs).
In the end, one possible discrimination between the LM scenario and the our would be given by the possible observation of some stars located ”below” the plateau in the [/Fe]-[Fe/H] diagram, i.e. showing a [O/Fe] ratio lower than that of the plateau at low values of [Fe/H].
We also stress that observations of “transition” galaxies (Grebel et al., 2003) which have not yet lost all their gas content may discriminate between the LM scenario and the our. In the former one, infact, these galaxies are expected to show only the plateau in the [O/Fe] distribution, while in the latter one the descending branch would be already present at low values of [Fe/H].
7.4 Summary
In conclusion, our major findings are the following:
1) The long duration of the star formation attributed to Draco (and the other local dSphs too), together with the high effectiveness of the radiative losses, exclude that the galaxy got rid of its gas by an internal mechanism such as a galactic wind. The gas removal to complete star formation and to evolve to a gas-poor system should result from external mechanisms such as ram pressure stripping and/or tidal interaction with the Galaxy.
2) Although the SN ejecta remain gravitationally bounded during the star formation, yet only a low fraction (%) stays in the region where star forms. This effect should be taken into account in chemical evolution models.
3) Our models succeed in reproducing the [Fe/H] distribution function of the stars. In agreement with observations, we find a mean value [Fe/H] with a spread of dex.
4) We can also satisfactory reproduce the observed [O/Fe] vs [Fe/H] diagram.
5) Contrary to the usual interpretation, we rule out any particular relation between the [/Fe] break position in the [/Fe]-[Fe/H] plane and the onset of SN Ia explosions. Methods intended to determine in this way might be incorrect.
6) In agreement with observations, our models develop initially moderate metallicity gradients which become weaker and weaker as the galaxy evolves.
7) Finally, the above results are slightly dependent on the particular star formation history adopted.
Acknowledgements
We thank the referee, Leticia Carigi, whose comments greatly improved the presentation of the paper. We are very grateful to M. Bellazzini for giving us the data used in our Fig. 8. We are also indebted to G. Lanfranchi and F. Matteucci to sent us some simulations in advance of publication to compare with our models. Many thanks also to L. Mayer and all the above friends for useful suggestions and discussions which greatly improved the final version. We acknowledge financial support from National Institute for Astrophysics (INAF). The simulations were run at the CINECA Supercomputing Centre with CPU time provided by a grant of the National institute for Astrophysics (INAF). S.R. acknowledges financial support from the Deutsche Forschungsgemeinschaft (DFG) under grant TH 511/8
References
- Aparicio et al. (2001) Aparicio A., Carrera R., Martínez-Delgado D., 2001, AJ, 122, 2524
- Babusiaux et al. (2005) Babusiaux C., Gilmore G., Irwin M., 2005, MNRAS, 359, 985
- Bellazzini et al. (2002) Bellazzini M., Ferraro F. R., Origlia L., Pancino E., Monaco L., Oliva E., 2002, AJ, 124, 3222
- Bellazzini et al. (2005) Bellazzini M., Gennari N., Ferraro F. R., 2005, MNRAS, 360, 185
- Binggeli & Cameron (1991) Binggeli B., Cameron L. M., 1991, A&A, 252, 27
- Borkowski et al. (1990) Borkowski K. J., Balbus S. A., Fristrom C. C., 1990, ApJ, 355, 501
- Bradamante et al. (1998) Bradamante F., Matteucci F., D’Ercole A., 1998, A&A, 337, 338
- Burkert (1995) Burkert A., 1995, ApJ, 447, L25+
- Carigi et al. (2002) Carigi L., Hernandez X., Gilmore G., 2002, MNRAS, 334, 117
- Carney & Seitzer (1986) Carney B. W., Seitzer P., 1986, AJ, 92, 23
- Carrera et al. (2002) Carrera R., Aparicio A., Martínez-Delgado D., Alonso-García J., 2002, AJ, 123, 3199
- Carretta & Gratton (1997) Carretta E., Gratton R. G., 1997, A&AS, 121, 95
- Cioffi & Shull (1991) Cioffi D. F., Shull J. M., 1991, ApJ, 367, 96
- Conselice et al. (2003) Conselice C. J., Gallagher J. S., Wyse R. F. G., 2003, AJ, 125, 66
- Dekel & Silk (1986) Dekel A., Silk J., 1986, ApJ, 303, 39
- Dolphin (2002) Dolphin A. E., 2002, MNRAS, 332, 91
- Ellis (1997) Ellis R. S., 1997, ARA&A, 35, 389
- Fenner et al. (2006) Fenner Y., Gibson B. K., Gallino R., Lugaro M., 2006, astro-ph/0602489
- Gallagher & Wyse (1994) Gallagher J. S., Wyse R. F. G., 1994, PASP, 106, 1225
- Gao et al. (2004) Gao L., De Lucia G., White S. D. M., Jenkins A., 2004, MNRAS, 352, L1
- Gibson et al. (1997) Gibson B. K., Loewenstein M., Mushotzky R. F., 1997, MNRAS, 290, 623
- Gómez-Flechoso & Martínez-Delgado (2003) Gómez-Flechoso M. Á., Martínez-Delgado D., 2003, ApJ, 586, L123
- Goswami & Prantzos (2000) Goswami A., Prantzos N., 2000, A&A, 359, 191
- Grebel & Gallagher (2004) Grebel E. K., Gallagher J. S., 2004, ApJ, 610, L89
- Grebel et al. (2003) Grebel E. K., Gallagher J. S., Harbeck D., 2003, AJ, 125, 1926
- Greggio (2005) Greggio L., 2005, A&A, 441, 1055
- Greggio & Renzini (1983) Greggio L., Renzini A., 1983, A&A, 118, 217
- Grevesse & Sauval (1998) Grevesse N., Sauval A. J., 1998, Space Science Reviews, 85, 161
- Harbeck et al. (2001) Harbeck D., Grebel E. K., Holtzman J., Guhathakurta P., Brandner W., Geisler D., Sarajedini A., Dolphin A., Hurley-Keller D., Mateo M., 2001, AJ, 122, 3092
- Hensler et al. (2004) Hensler G., Theis C., Gallagher J. S. I., 2004, A&A, 426, 25
- Hurley-Keller et al. (1999) Hurley-Keller D., Mateo M., Grebel E. K., 1999, ApJ, 523, L25
- Ikuta & Arimoto (2002) Ikuta C., Arimoto N., 2002, A&A, 391, 55, (IA)
- Irwin & Hatzidimitriou (1995) Irwin M., Hatzidimitriou D., 1995, MNRAS, 277, 1354
- Kawata et al. (2005) Kawata D., Arimoto N., Cen R., Gibson B. K., 2005, astro-ph/0509402
- Kazantzidis et al. (2004) Kazantzidis S., Mayer L., Mastropietro C., Diemand J., Stadel J., Moore B., 2004, ApJ, 608, 663
- Kleyna et al. (2002) Kleyna J., Wilkinson M. I., Evans N. W., Gilmore G., Frayn C., 2002, MNRAS, 330, 792
- Kobayashi et al. (2000) Kobayashi C., Tsujimoto T., Nomoto K., 2000, ApJ, 539, 26
- Kroupa (1997) Kroupa P., 1997, New Astronomy, 2, 139
- Kroupa et al. (2005) Kroupa P., Theis C., Boily C. M., 2005, A&A, 431, 517
- Lake (1990) Lake G., 1990, MNRAS, 244, 701
- Lanfranchi & Matteucci (2004) Lanfranchi G. A., Matteucci F., 2004, MNRAS, 351, 1338, (LM)
- Larson (1974) Larson R. B., 1974, MNRAS, 169, 229
- Lee et al. (2003) Lee M. G., Park H. S., Park J.-H., Sohn Y.-J., Oh S. J., Yuk I.-S., Rey S.-C., Lee S.-G., Lee Y.-W., Kim H.-I., Han W., Park W.-K., Lee J. H., Jeon Y.-B., Kim S. C., 2003, AJ, 126, 2840
- Lehnert et al. (1992) Lehnert M. D., Bell R. A., Hesser J. E., Oke J. B., 1992, ApJ, 395, 466
- Łokas (2002) Łokas E. L., 2002, MNRAS, 333, 697
- Mac Low & Ferrara (1999) Mac Low M., Ferrara A., 1999, ApJ, 513, 142
- Marcolini et al. (2003) Marcolini A., Brighenti F., D’Ercole A., 2003, MNRAS, 345, 1329
- Marcolini et al. (2004) —, 2004, MNRAS, 352, 363
- Marzke & da Costa (1997) Marzke R. O., da Costa L. N., 1997, AJ, 113, 185
- Mashchenko et al. (2005a) Mashchenko S., Couchman H. M. P., Sills A., 2005a, ApJ, 624, 726
- Mashchenko et al. (2005b) Mashchenko S., Sills A., Couchman H. M. P., 2005b, astro-ph/0511567
- Mastropietro et al. (2005) Mastropietro C., Moore B., Mayer L., Wadsley J., Stadel J., 2005, MNRAS, 363, 509
- Mateo (1998) Mateo M. L., 1998, ARA&A, 36, 435
- Matteucci (2003) Matteucci F., 2003, Ap&SS, 284, 539
- Matteucci & Greggio (1986) Matteucci F., Greggio L., 1986, A&A, 154, 279
- Matteucci & Recchi (2001) Matteucci F., Recchi S., 2001, ApJ, 558, 351
- Mayer et al. (2005) Mayer L., Mastropietro C., Wadsley J., Stadel J., Moore B., 2005, astro-ph/0504277
- Melioli & de Gouveia Dal Pino (2004) Melioli C., de Gouveia Dal Pino E. M., 2004, A&A, 424, 817
- Mori et al. (2002) Mori M., Ferrara A., Madau P., 2002, ApJ, 571, 40
- Mori et al. (2004) Mori M., Umemura M., Ferrara A., 2004, ApJ, 613, L97
- Mori et al. (1997) Mori M., Yoshii Y., Tsujimoto T., Nomoto K., 1997, ApJ, 478, L21+
- Murakami & Babul (1999) Murakami I., Babul A., 1999, MNRAS, 309, 161
- Norman et al. (1980) Norman M. L., Wilson J. R., Barton R. T., 1980, ApJ, 239, 968
- Peterson & Caldwell (1993) Peterson R. C., Caldwell N., 1993, AJ, 105, 1411
- Phillipps et al. (1998) Phillipps S., Parker Q. A., Schwartzenberg J. M., Jones J. B., 1998, ApJ, 493, L59+
- Piatek et al. (2001) Piatek S., Pryor C., Armandroff T. E., Olszewski E. W., 2001, AJ, 121, 841
- Popesso et al. (2006) Popesso P., Biviano A., Böhringer H., Romaniello M., 2006, A&A, 445, 29
- Pryor & Kormendy (1990) Pryor C., Kormendy J., 1990, AJ, 100, 127
- Rakos et al. (2001) Rakos K., Schombert J., Maitzen H. M., Prugovecki S., Odell A., 2001, AJ, 121, 1974
- Read et al. (2005) Read J. I., Wilkinson M. I., Wyn Evans N., Gilmore G., Kleyna J. T., 2005, astro-ph/0511759
- Ricotti & Gnedin (2005) Ricotti M., Gnedin N. Y., 2005, ApJ, 629, 259, (RG)
- Robertson et al. (2005) Robertson B., Bullock J. S., Font A. S., Johnston K. V., Hernquist L., 2005, ApJ, 632, 872
- Rosenberg & Scheuer (1973) Rosenberg I., Scheuer P. A. G., 1973, MNRAS, 161, 27
- Secker & Harris (1997) Secker J., Harris W. E., 1997, PASP, 109, 1364
- Shetrone et al. (1998) Shetrone M. D., Bolte M., Stetson P. B., 1998, AJ, 115, 1888
- Shetrone et al. (2001) Shetrone M. D., Côté P., Sargent W. L. W., 2001, ApJ, 548, 592
- Silich et al. (2001) Silich S. A., Tenorio-Tagle G., Terlevich R., Terlevich E., Netzer H., 2001, MNRAS, 324, 191
- Sofue (1994) Sofue Y., 1994, PASJ, 46, 431
- Spergel et al. (2006) Spergel D. N., Bean R., Dore’ O., Nolta M. R., Bennett C. L., Hinshaw G., Jarosik N., Komatsu E., Page L., Peiris H. V., Verde L., Barnes C., Halpern M., Hill R. S., Kogut A., Limon M., Meyer S. S., Odegard N., Tucker G. S., Weiland J. L., Wollack E., Wright E. L., 2006, astro-ph/0603449
- Stetson (1984) Stetson P. B., 1984, PASP, 96, 128
- Sutherland & Dopita (1993) Sutherland R. S., Dopita M. A., 1993, ApJS, 88, 253
- Tolstoy (2004) Tolstoy E., 2004, astro-ph/0412067
- Tsujimoto (2006) Tsujimoto T., 2006, A&A, 447, 81
- van den Bergh (1994) van den Bergh S., 1994, ApJ, 428, 617
- Walker et al. (2005) Walker M. G., Mateo M., Olszewski E. W., Bernstein R. A., Wang X., Woodroofe M., 2005, astro-ph/0511465
- Wilkinson et al. (2002) Wilkinson M. I., Kleyna J., Evans N. W., Gilmore G., 2002, MNRAS, 330, 778
- Wilkinson et al. (2004) Wilkinson M. I., Kleyna J. T., Evans N. W., Gilmore G. F., Irwin M. J., Grebel E. K., 2004, ApJ, 611, L21
- Woosley & Weaver (1995) Woosley S. E., Weaver T. A., 1995, ApJS, 101, 181
- Yoshii et al. (1996) Yoshii Y., Tsujimoto T., Nomoto K., 1996, ApJ, 462, 266
- Zinn & West (1984) Zinn R., West M. J., 1984, ApJS, 55, 45
Appendix A
A SNR expanding in a homogeneous uniform medium evolves initially following the Sedov solution during which radiative losses can be neglected. With time, however, such losses eventually cause the formation of a dense shell, and the high pressure of the hot interior pushes this shell (the snowplow phase). Assuming an explosion energy of 1051 erg, the time at which the Sedov phase ends is given by Cioffi & Shull (1991) yr, where is the density of the ambient medium and is the ISM metal abundance in solar units. The SNR stalls when its expansion velocity drops to the the local sound speed ; the stalling radius is given by Cioffi & Shull (1991) pc, in terms of the pressure of the ambient medium (where is the Boltzman constant), after a time Myr. Eventually, the SNR cavity is refilled by the ISM on a timescale of the order of .
It is known that a single SNR does not contribute significantly to the ISM energization; at the end of its evolution only a few percent of the explosion energy has been fed into the surrounding gas, while the rest has been radiated away (e.g. Bradamante et al., 1998). However, when many SNe explode with a rate per unit volume high enough, their combined effect may lead to the thermalization of a very high fraction (close to 100%) of the explosion energy. In fact, if many SNRs collide with each other the shells fragment and the hot gas of their interior merges forming a dilute medium. Repeated supernova explosions are especially effective in reheating this medium because the SNR cooling time is relatively long in a low density region. A considerable fraction of gas may thus be driven out of the galaxy. To understand when this is effectively the case, one has to calculate the collision time . This time can be defined as the time required for SNRs forming at the rate to fill up the volume of space. If the expansion law of a remnant is given by (with and constants), then (cf. Larson, 1974; Melioli & de Gouveia Dal Pino, 2004) . Unless for very low values of , the Sedov phase represents only a short stage in the evolution of a SNR whose bulk expansion can be described by the snowplow law. In this case we have pc, where is the time in years (Cioffi & Shull, 1991).
In order to make some quantitative consideration concerning our standard model, we assume cm-3, , yr-1 and a mean value pc-3 yr-1. Then we have Myr, which is longer than . This means that the SNRs do not interact one with another during their evolution because they stop their expansion before colliding. Despite this result, with a sufficiently high rate , and a long lifetime , the SNR cavities would still necessary overlap, connect, and form a network of tunnels. One can characterize this topology in terms of the porosity parameter , where . The condition implies that SNRs overlap. With our assumptions we get . We thus conclude that in our model a combined action of SNRs pressurizing the ISM can be obtained for . Assuming we calculate that SNRe II fill most of the stellar volume after Myr.