The K luminosity-metallicity relation for dwarf galaxies and the tidal dwarf galaxies in the tails of HCG 31 ††thanks: Based on observations obtained at the Gemini Observatory, which is operated by the Association of Universities for Research in Astronomy, Inc., under a cooperative agreement with the NSF on behalf of the Gemini partnership: the National Science Foundation (United States), the Particle Physics and Astronomy Research Council (United Kingdom), the National Research Council (Canada), CONICYT (Chile), the Australian Research Council (Australia), CNPq (Brazil) and CONICET (Argentina) – Observing run ID: GN-2004B-Q-47.
Abstract
We determine a -band luminosity-metallicity (K-Z) relation for dwarf irregular galaxies, over a large range of magnitudes, 20.5 MK 13.5, using a combination of K photometry from either the 2-micron all sky survey (2MASS) or the recent study of Vaduvescu et al. (2005), and metallicities derived mainly with the Te method, from several different studies. We then use this newly-derived relation, together with published photometry and our new spectra of objects in the field of HCG 31 to discuss the nature of the possible tidal dwarf galaxies of this group. We catalogue a new member of HCG 31, namely “R”, situated 40 kpc north of the group center, composed by a ring of H knots which coincides with a peak in HI. This object is a deviant point in the K-Z relation (it has too high metallicity for its luminosity) and its projected distance to the parent galaxy and large gas reservoir makes it one of the most promising tidal dwarf galaxy candidates of HCG 31, together with object F. The subsystems A1, E, F, H and R all have metallicities similar to that of the galaxies A+C and B, result that is expected in a scenario where those were formed from material expelled from the central galaxies of HCG 31. While objects A1, E and H will most probably fall back onto their progenitors, F and R may survive as tidal dwarf galaxies. We find that two galaxies of HCG 31, G and Q, have A+em spectral signatures, and are probably evolving toward a post-starburst phase.
1 Introduction
It has been established for more than a decade that there is a well defined B luminosity-metallicity (L-Z) relation for dwarf irregular galaxies, in the sense that the higher the metallicity, the higher the luminosity of the dwarf galaxy (e.g. Skillman et al., 1989; Richer & McCall, 1995), although Hidalgo-Gámez & Olofsson (1998) claimed that the relationship was much weaker than previously thought. More recently the relationship was confirmed by Lee et al. (2003b) with a root mean square of = 0.175 dex in (O/H) for the same sample of dwarf irregular galaxies originally examined by Richer & McCall (1995), but with updated distance determinations and metallicity measurements. The L-Z relation is also valid for giant galaxies, with less scatter and with a steeper slope than for dwarf systems (Salzer et al., 2005).
In the studies of dwarf systems associated with strongly interacting galaxies, this luminosity-metallicity relation has been used to select possible candidate tidal dwarf galaxies (TDGs) – newly born galaxies formed out of recycled material expelled from the parent galaxies during interaction. TDGs stand out from this relation, i.e., they, in general, do not follow the L-Z relation of dwarf irregular galaxies, but instead have an almost constant metallicity between 1/4 and 1/3 of the solar value. Examples of B-band L-Z diagrams showing the location of tidal dwarf galaxies in a few interacting systems can be found in Fig. 6 of Duc & Mirabel (1998), in Fig. 3 of Weilbacher et al. (2003) and Fig. 17 of Duc et al. (2000). Nevertheless, in systems where star formation is widely spread and the B luminosities of the parent galaxies and of the TDGs may be altered, the B-band L-Z relation (used in the studies above) may no longer be a useful tool to select possible TDGs mainly because the B band is not a good tracer of the stellar mass when it is highly affected by starbursts. This is the case for the Hickson compact group 31, a gas-rich group, with intense star forming activity (e.g. López-Sánchez et al., 2004), dominated by a pair of interacting dwarf galaxies, A and C, which clearly have their B luminosities quite affected by the light and dust involving newly born stars (in fact HCG 31C has Wolf-Rayet features in its spectrum; Conti, 1991). In the course of studying the possible nature of the various sub-components of this interesting group, we thus felt the need of compiling from the literature a K-band L-Z relation. Such a relation is more useful than the B-band relation because it is less affected by a starburst, it suffers significantly less from absorption effects and it better characterizes the bulk of the stars (old component) in the group member galaxies.
This paper is divided as follows. In Section 2, the K-band L-Z diagram for “normal” dwarf irregular galaxies 20.5 MK 13.5 is determined from literature data. Section 3 describes our new Gemini data, g′ and r′ photometry and medium-resolution spectroscopy of HCG 31, which are then used to determine the radial velocities, ages and metallicities of the regions and to plot the K-band L-Z relation for the objects of this interacting group (the K photometry for the HCG 31 members come mostly from López-Sánchez et al. (2004)). Finally, in Section 4 we discuss the fate of the TDG candidates of HCG 31.
Distance-dependent measurements assume a distance to the group of 54.8 Mpc (derived by López-Sánchez et al. (2004) from the Hubble law and H0=75 km s-1 Mpc-1). We use the identifications for the HCG 31 objects suggested by López-Sánchez et al. (2004) with one exception: their region E corresponds to blob E2 in this paper. We identify objects with single letters (e.g. objects E, F, R) and we refer to blobs which form an object with letters followed by numbers (e.g. blobs E1 and E2 compose object E).
2 The luminosity-metallicity relation
2.1 Previous works
A few authors have questioned the existence of the luminosity-metallicity relation (e.g. Campos-Aguilar et al., 1993), specially for gas-rich objects. The magnitude, classically used to investigate the L-Z relation, is known to be highly affected by strong and young starbursts with ages below 10 Myr, as well as by dust. Therefore, for the study of objects like those in HCG 31, which are known to contain young and strong starbursts, the use of near infrared (NIR) magnitudes should be much more robust and less affected by the onset of starbursts or dust absorption than the magnitude. In the recent study of Salzer et al. (2005) the L-Z relation is actually explored also in the NIR regime for a sample of emission-line galaxies from the KISS survey. However, they present only global fits to all their sample galaxies, which are mostly concentrated in the high luminosity part of the diagrams (M), whereas the small numbers of dwarf galaxies in their sample appear to follow a relation with a shallower slope. Recent efforts directed to test the existence of an L-Z relation for dwarf irregular galaxies in the H-band, by following an approach conceived to minimize the effects of uncertainties in distance determinations (Saviane et al., 2005) have led to encouraging results, although still based on a small number of galaxies. Here we investigate the L-Z relation in the band by compiling from the literature a sample of nearby dwarf irregular galaxies selected for spanning a wide range in luminosity, having oxygen abundances obtained following an homogeneous method (as far as possible), and having reliable distance determinations.
2.2 Data used in our compilation
In Table The K luminosity-metallicity relation for dwarf galaxies and the tidal dwarf galaxies in the tails of HCG 31 ††thanks: Based on observations obtained at the Gemini Observatory, which is operated by the Association of Universities for Research in Astronomy, Inc., under a cooperative agreement with the NSF on behalf of the Gemini partnership: the National Science Foundation (United States), the Particle Physics and Astronomy Research Council (United Kingdom), the National Research Council (Canada), CONICYT (Chile), the Australian Research Council (Australia), CNPq (Brazil) and CONICET (Argentina) – Observing run ID: GN-2004B-Q-47. we list absolute magnitudes and oxygen abundances for a number of nearby irregular galaxies. The sample of 29 galaxies was taken either from the recent work of Vaduvescu et al. (2005), where new NIR measurements of dwarf irregular galaxies are presented, or from the classic work of Richer & McCall (1995) and includes two additional galaxies NGC 1705 and NGC 1156 (taken from Hunter & Elmegreen, 2004). It contains only nearby (distance 8 Mpc) irregular galaxies, for which distances can either be determined from the brightest-stars (bs) method, tip-of-the-RGB techniques (rgb) or Cepheids (cep). For one of the galaxies, the available distance was determined from the Tully-Fisher relation (tf). All distances were obtained from the compilation of Karachentsev et al. (2004), except for the distance to IC 4662, which was taken from Lee et al. (2003b). 222We did not include the following galaxies from the list of Vaduvescu et al. (2005), because we were not able to locate the corresponding measurements for their metallicities in the literature: Cas 1, Mb1, Orion Dwarf, UGC 4115, UGC 4998, UGC 5692, UGC 5848, UGC 8508, UGC 5979, NGC 3741, NGC 4163, NGC 4190, and Holmberg IV. On the other hand, the dwarf irregular galaxies from the list of Richer & McCall (1995) Sextans A, Sextans B, LMC, SMC, WLM, Leo A, IC 1613, and NGC 2366 were not included because no NIR total magnitudes are available for them. NIR magnitudes for the galaxies not included in the sample of Vaduvescu et al. (2005) are from the 2MASS extended source catalog (Jarrett et al., 2000), except for NGC 5408 whose magnitude is taken from Noeske et al. (2003).
The values of foreground Galactic extinction in the -band (AK) for the sample galaxies are listed in column 3 of Table The K luminosity-metallicity relation for dwarf galaxies and the tidal dwarf galaxies in the tails of HCG 31 ††thanks: Based on observations obtained at the Gemini Observatory, which is operated by the Association of Universities for Research in Astronomy, Inc., under a cooperative agreement with the NSF on behalf of the Gemini partnership: the National Science Foundation (United States), the Particle Physics and Astronomy Research Council (United Kingdom), the National Research Council (Canada), CONICYT (Chile), the Australian Research Council (Australia), CNPq (Brazil) and CONICET (Argentina) – Observing run ID: GN-2004B-Q-47.. These are taken from NED and were determined following Schlegel et al. (1998). Exceptions are galaxies NGC 1569 and IC 10 that are located at low Galactic latitudes, where extinction values derived from the dust maps of Schlegel et al. (1998) are not accurate. For these galaxies we adopted the Galactic extinction values determined by Origlia et al. (2001) and Richer et al. (2001), respectively.
The oxygen abundances, compiled from the literature, were determined in two ways. Column 6 of Table The K luminosity-metallicity relation for dwarf galaxies and the tidal dwarf galaxies in the tails of HCG 31 ††thanks: Based on observations obtained at the Gemini Observatory, which is operated by the Association of Universities for Research in Astronomy, Inc., under a cooperative agreement with the NSF on behalf of the Gemini partnership: the National Science Foundation (United States), the Particle Physics and Astronomy Research Council (United Kingdom), the National Research Council (Canada), CONICYT (Chile), the Australian Research Council (Australia), CNPq (Brazil) and CONICET (Argentina) – Observing run ID: GN-2004B-Q-47. shows determinations based on electronic temperatures measured from the [O III] 4363 line (Te-method), and column 7 shows determinations from the empirical calibration of Pilyugin (2001a, b, P-method). An exception is NGC 3738 for which only a metallicity value determined with the method of Edmunds & Pagel (1984) was found. In a few cases, P-method abundances were not available in the literature, but we could use published values of emission-line intensity ratios (corrected for extinction) to calculate oxygen abundances following Pilyugin (2001a, b). In particular we used line intensities from Lee et al. (2003b) for IC 10 and NGC 1560, from Thuan & Izotov (2005) for Mrk 209, from Kennicutt & Skillman (2001) for NGC 4789A, from Masegosa et al. (1991) and Miller & Hodge (1996) for IC 2574 and DDO 50, and from Masegosa et al. (1994) for NGC 5408.
2.3 The K-band L-Z diagram for dwarf irregulars
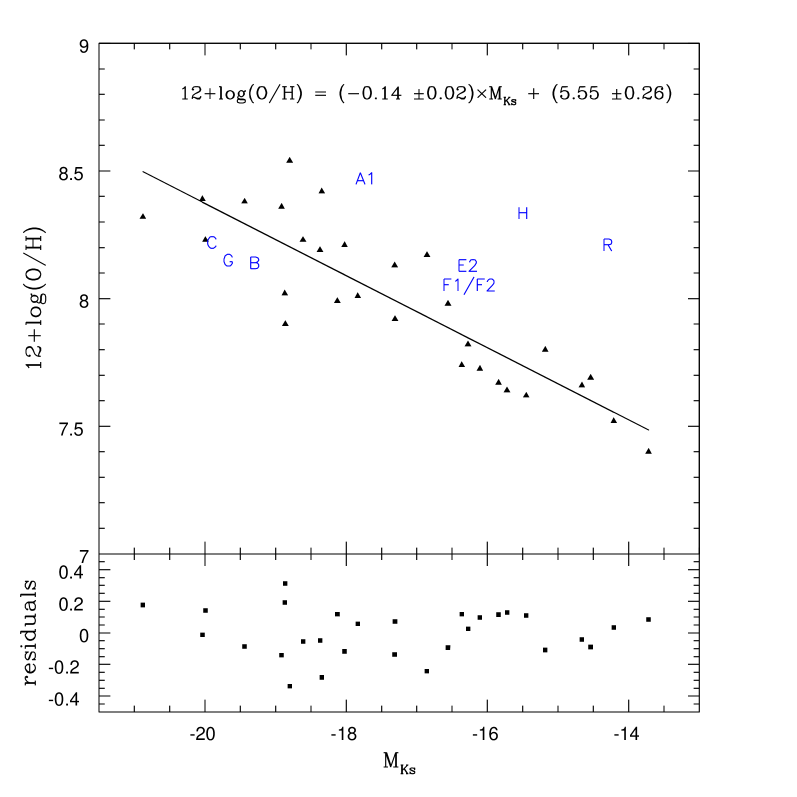
Abundances against extinction corrected Ks magnitudes are plotted in Fig. 1 (Table The K luminosity-metallicity relation for dwarf galaxies and the tidal dwarf galaxies in the tails of HCG 31 ††thanks: Based on observations obtained at the Gemini Observatory, which is operated by the Association of Universities for Research in Astronomy, Inc., under a cooperative agreement with the NSF on behalf of the Gemini partnership: the National Science Foundation (United States), the Particle Physics and Astronomy Research Council (United Kingdom), the National Research Council (Canada), CONICYT (Chile), the Australian Research Council (Australia), CNPq (Brazil) and CONICET (Argentina) – Observing run ID: GN-2004B-Q-47., values of column 6 plotted against those of column 2, after correction with extinction values of column 3). Data for all sample galaxies are used with Te-method abundances, when available (i.e. for all but two galaxies, see Table The K luminosity-metallicity relation for dwarf galaxies and the tidal dwarf galaxies in the tails of HCG 31 ††thanks: Based on observations obtained at the Gemini Observatory, which is operated by the Association of Universities for Research in Astronomy, Inc., under a cooperative agreement with the NSF on behalf of the Gemini partnership: the National Science Foundation (United States), the Particle Physics and Astronomy Research Council (United Kingdom), the National Research Council (Canada), CONICYT (Chile), the Australian Research Council (Australia), CNPq (Brazil) and CONICET (Argentina) – Observing run ID: GN-2004B-Q-47., column 6). A non-weighted least-squares fit to the data gives the following result:
| (1) |
with a of 0.15 dex in (O/H).
To establish whether there is a correlation in the data, we calculated the Spearman’s rank correlation coefficient, a non-parametric measure of correlation, and found a value of 0.88. This indicates the presence of a good anti-correlation, whose level of significance can be inferred by comparison with published tables (Wall & Jenkins, 2003). Taking into account the number of L-Z pairs in the sample, the above correlation coefficient indicates that the hypothesis that the variables are unrelated is rejected at the 0.1 per cent level of significance. Residuals of the fit are shown in the lower panel of Fig. 1.
A good correlation is also present if we plotted the subsample of 25 dwarf galaxies that have abundances determined through the P-method (not plotted here). Also in this case the correlation is good333We excluded from the fit galaxy NGC 6822, whose metallicity was determined with the P-method, and which deviates considerably from the L-Z relation (Pilyugin, 2001b)., with a Spearman-rank correlation coefficient of 0.81, and same level of significance as above. The result of the non-weighted least-squares fit to the data is not significantly different from the one above:
| (2) |
with a of 0.16 dex.
3 Observations and results for HCG 31
We have used relation (1) above, combined with available K-band photometry, from (López-Sánchez et al., 2004), and our new medium-resolution spectroscopy of the objects in HCG 31, to study the nature of the members of this group, as deduced from their location in the K-band L-Z relation for normal dwarf galaxies. Our new data are described in the following.
3.1 New data – Observations
New imaging and multi-slit spectroscopic observations of HCG 31 were done with the GMOS instrument, mounted on the Gemini North telescope, on August 29 and September 21 of 2003, respectively.
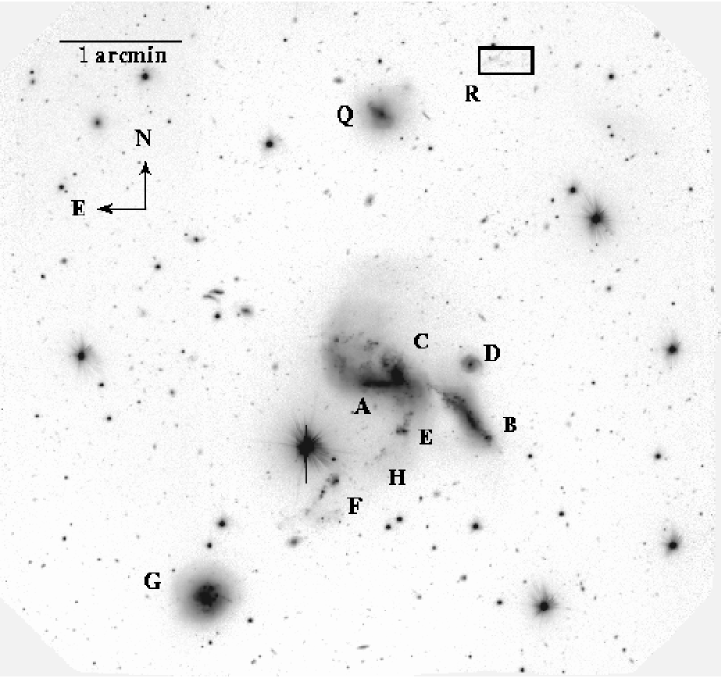
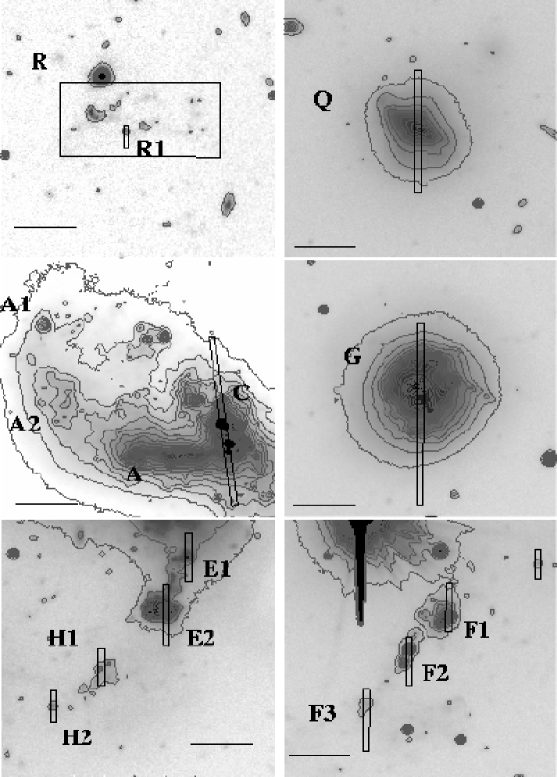
The imaging consisted of s exposures in the r′ band, and s exposures in the g′ band. The filters are from the SDSS system (Fukugita et al., 1996). The typical FWHM for point sources was 075 in all images. The observations were performed in photometric conditions. Fig. 2 displays the r′ image of HCG 31. Fig. 3 displays zoomed pannels of selected regions, with 20 surface brightness contour levels logarithmically spaced from 17.8 to 24.0 mag arcsec-2. The positions of the spectroscopic slits are also indicated.
Standard reduction steps were performed with the Gemini package GMOS. After flat-fielding and cleaning from cosmic-ray events, the final frames were analyzed with the program SExtractor (Bertin and Arnouts, 1996).
The calibration to the standard SDSS system was made with the general zero points and extinction coefficients provided by the Gemini observatory444www.gemini.edu/sciops/instruments/gmos/gmosPhotStandards.html. The accuracy of the calibration is claimed to be within 5% to 8%.
Three multi-slit exposures of 960 seconds each were obtained through a mask with 1.0″ slits, using the R400 grating, for a final resolution of 6.0–6.5 Å, covering approximately the range 4000 – 8000 Å. Three additional multi-slit exposures of 1200 seconds each were obtained through a mask with 1.0″ slits, using the B600 grating, for a final resolution of 4.5 Å, covering approximately the range 3750 – 6600 Å. The typical FWHM for point sources, measured on images taken for identification of the field, was 06. Only a few of the observations were performed in photometric conditions.
Standard procedures were used to reduce the multi-slit spectra using tasks within the Gemini IRAF555IRAF is distributed by the National Optical Astronomy Observatories, which are operated by the Association of Universities for Research in Astronomy, Inc., under cooperative agreement with the National Science Foundation. package. Wavelength calibration was done using Cu-Ar comparison-lamp exposures before and after the exposure on the target. Flux calibration was done using spectroscopic standard stars obtained in the same night of the observations. The blue and red spectra were glued together, after flux calibration, and are shown in Fig. 4.
3.2 Measured properties of the HCG 31 objects
In columns 2 and 3 of Table 2 we list the coordinates of all objects in the HCG 31 group identified in the r’ image. We include a new object which we named “R”, at RA = 05h 01m 34s and DEC = 04∘12′57′′ (JD2000), located 2.5 arcmin north of the group central object C, about 1 arcmin northwest of object Q (see Figs. 2 and 3). As discussed in Section 4, this may be one of the best candidates for a tidal dwarf galaxy in HCG 31. We only obtained a spectrum for one of the blobs which constitute region R, namely R1.
The remaining columns of Table 2 list measurements made by us and other authors on the properties of the objects in the group, such as magnitudes, H-luminosities, velocities, metallicities and colours of the group members. Column 4 lists the K absolute magnitudes, computed from the K apparent magnitudes measured in López-Sánchez et al. (2004), for an adopted distance to the group of 54.8 Mpc (values for regions H, Q, and R were measured by us, see details below), column 5 lists the logarithm of the luminosity in H, when available, from López-Sánchez et al. (2004) or from this work (in the latter case they are not corrected for light loss from the slit, and are therefore lower limits), columns 6 and 7 list respectively the heliocentric radial velocities of the objects (with errors) from this work and from the H I velocities obtained by Verdes-Montenegro et al. (2005), when available. The next four columns of Table 2 list four different determinations of 12 + log (O/H): using the Te method and the N2 estimator (results from López-Sánchez et al., 2004), in columns 8 and 9, and using the N2 and O3N2 estimators, derived from our own data, in columns 10 and 11 (see the definition of these metallicity estimators in the following subsection). Columns 12 and 13 list the measured line ratios used in the determination of the metallicities of columns 10 and 11. Equivalent widths of H are listed in column 14 and g’-r’ colours (measured within an aperture of 2”) are in the last column of Table 2. Details are presented below.
Radial velocities:
The spectra of all objects marked in Fig. 3 (with exception of A, A1 and A2) are shown in Fig. 4. All spectra have emission lines. The heliocentric velocities of the observed objects, derived from the redshifts of the brightest lines, are listed in column 6 of Table 2 (the errors are the rms of the individual line measurements). The H I velocities at the location of each corresponding object (from Verdes-Montenegro et al., 2005) are given in column 7. We note that the velocities of all optical regions studied here coincide with the H I velocities from the channel maps within the errors (except for region C), suggesting a physical association of the objects with the H I clouds. The velocities are in agreement with those derived from long-slit spectroscopy by Rubin et al. (1990) and Hickson et al. (1992), for the objects measured in common.
Metallicities:
Besides the metallicity estimates obtained by López-Sánchez et al. (2004), not available for all objects (see columns 8 and 9 of Table 2), we have computed values for 12 + log (O/H) using two metallicity indicators, from our own measurements of the line ratios. The results are listed in columns 10 and 11 of Table 2.
Our first estimate was obtained with the N2 calibrator, following Pettini & Pagel (2004), which is defined as the logarithm of the [NII]6584/H ratio. The resulting metallicities and the measured ratios are listed in columns 10 and 13 of Table 2 respectively. Our values in column 10 can be directly compared with those of column 9, derived by López-Sánchez et al. (2004). As can be noted, these completely independent measurements are very similar, for the objects measured in common.
Our second estimate was made using the O3N2 index (Pettini & Pagel, 2004), based on the logarithm of the ([OIII]5007/H)/([NII]6584/H) ratio. The resulting metallicities and measured ratios are listed in columns 11 to 13 of Table 2.
The rms scatter in the calibration of these estimators is 0.25 - 0.4, which is larger than the internal errors; we then assume that 0.3 is the one-sigma error of our measurements. The metallicities inferred for the objects are very similar within the errors, the mean value being 12+log(O/H) = 8.3 for our estimates (with either method).
We point out that the metallicity obtained for object Q is very uncertain given that the weak emission lines are superposed onto strong absorption lines, hampering a reliable determination of the metallicity for this object. We include this object in the tables but do not plot its magnitude/metallicity in the K-Z relation of Fig 1.
Equivalent widths and ages of objects E, F, H and R:
For objects E1, F1, F2, F3, H1, H2 and R1, where hardly any continuum is detected (see Fig. 4), we assume that the objects are excited by young stars formed in an instantaneous starburst and use Starburst99 (Leitherer et al., 1999), with solar metallicity and Salpeter IMF, to estimate ages (obtained from the equivalent widths of H, as given in column 14 of Table 2).
From a comparison between the observed H equivalent widths and those produced by Starburst99, we find ages around 3 Myr for all regions but F3 (the latter has an approximate age of 6 Myr, while the youngest one, R1, has an age of 2.6 Myr).
Spectroscopic properties of Q and G:
The two galaxies Q and G, besides exhibiting H II-region-like emission lines, also have strong Balmer absorption lines, typical of spectra dominated by A- and early F-type stars, with H equivalent widths significantly larger than that of normal spiral galaxies. The equivalent widths (EW) of the [OII]3727 emission line and the H absorption line are often used to classify galaxy spectra on the basis of their current/past star formation episodes (e.g. Poggianti et al., 1999; Poggianti & Wu, 2000; Mateus & Sodré, 2004). Galaxy G, with its EW([O II]) = 20 Å and EW(H) 8Å, falls in the category of the so-called e(a) galaxies (Poggianti et al., 1999), or A+em galaxies, according to the notation of Balogh et al. (1999), with still considerable ongoing star formation. The spectrum of galaxy Q does not include the [OII]3727 line, however its weak H emission line indicates that a low level of current star formation is still present. Its spectrum is dominated by A-type stars, as indicated by the particularly strong Balmer absorption lines, EW(H) 13 Å, a rather extreme and unusual value. Also this galaxy can then be considered of e(a) type.
Aperture (g’– r’) for all objects and K magnitudes of H, Q and R:
Aperture magnitudes in the g’ and r’ bands were obtained for all studied objects, within an aperture of 2 arcsec, using the task phot in IRAF.
K magnitudes for objects H, Q and R, which were not given in López-Sánchez et al. (2004) were derived by us using the program Sextractor (Bertin and Arnouts (1996), parameter magbest). We measured these three objects in unpublished J images of HCG 31 and assumed a J-K colour of 0.345 for all the objects. We used J-band images from the archive of the New Technology Telescope of the European Southern Observatory, obtained with the instrument SOFI. Nine images of HCG 31 obtained on Nov 3rd/2001 were retrieved, of which only five contained objects Q and R (object H was visible in all nine). Images in the K band were also available in the archive but they did not go deep enough to allow measurements of the objects. Calibration of the instrumental photometry was done by using stars common in our fields and in the 2MASS images of the group. Our final magbest J magnitudes were 18.60.1, 14.800.04 and 19.70.5 for objects H, Q and R respectively. These values were corrected for the foreground Galactic extinction given in NED, AJ = 0.046 mag and transformed into K magnitudes using a J-K colour of 0.345 (which is an average of the J-K colour of the other members of the group). The corresponding K absolute magnitudes for the three objects, assuming a distance to the group of 54.8 Mpc, are listed in column 4 of Table 2.
3.3 The K-Z relation for the TDG candidates of HCG 31
We overplot in Fig. 1 the values for the metallicity and K magnitude (values in columns 8, 9 or 10 against those of column 4 of Table 2) for the components of HCG 31. The data on the metallicities come either from (López-Sánchez et al., 2004) or from this work. Those from this work (for objects H and R only) were derived through the N2 calibrator (column 10 of Table 2). The only value plotted from column 9 was that for the region A1, for which no other measurement of metallicity is available.
In Fig. 14 of López-Sánchez et al. (2004), which plots the B-metallicity relation for the HCG 31 members, galaxies B, C and G are more than 2 magnitudes off the line for the B-Z relation for normal dwarf galaxies. In our corresponding Fig. 1, using K magnitudes instead, these same objects are closer to the best line that fits the relation for normal dwarfs, while still in the high-luminosity side. On the other hand, for the fainter objects, only objects H and R stand off the correlation, although also A1, E2 and F1+F2 show a larger metallicity and/or a fainter magnitude than the best-line fit. We suggest that A, B, C, G and Q are galaxy members of HCG 31 while the fainter objects are either tidal debris or tidal dwarf galaxies of the group formed due to the interaction. This is further discussed in section 4.
4 Discussion
4.1 General Properties of HCG 31 members
Table The K luminosity-metallicity relation for dwarf galaxies and the tidal dwarf galaxies in the tails of HCG 31 ††thanks: Based on observations obtained at the Gemini Observatory, which is operated by the Association of Universities for Research in Astronomy, Inc., under a cooperative agreement with the NSF on behalf of the Gemini partnership: the National Science Foundation (United States), the Particle Physics and Astronomy Research Council (United Kingdom), the National Research Council (Canada), CONICYT (Chile), the Australian Research Council (Australia), CNPq (Brazil) and CONICET (Argentina) – Observing run ID: GN-2004B-Q-47. summarizes all of the properties of the HCG 31 members either from this work or gathered from the literature. This table may be important for future modelling of the group, for comparison between simulations and observations. As can be noted, HCG 31 has been observed almost in all wavelengths. The optical morphology of the galaxies in the group is very disturbed, as is also the optical and HI kinematics.
A point which is worth noting is the large difference between the equivalent widths of H of object F3 (EW = 74 Å ), as compared to those for F1 and F2 (1508 Å and 1010 Å respectively). This, in turn, leads to a large difference in the derived ages of F1+F2 (3 Myrs) and F3 (6 Myrs). The colours g’-r’ of the three blobs are very similar and are the bluest colours observed for any object in this group (see last column of Table 2). Amram et al. 2004 showed that the rotation curve is flat through F1 and F2 and the velocity of F3 is 40 higher than that for F1 and F2. The values for the metallicities are similar for the three blobs (within the errors) although F3 tends to have higher metallicity than the other two. F3 is also the lowest surface brightness object of the three. One might think that the different equivalent widths and the (small) discontinuity in the kinematics could be hints that F1+F2 is a distinct object from F3, but we not not believe this is the case, given the detailed analysis of the kinematics of the region: we have revisited the Fabry-Perot data cube of HCG 31 (see Amram et al. 2004 for a description of the data) and have seen that there clearly exists a continuity in the velocity field between F1+F2 and F3. The situation for object E is also similar: although the equivalent width of H for E1 (740 Å ) is much larger than that for E2 (34 Å ), analysis of the kinematics done in Amram et al. (2004) shows that E1+E2 form one single object.
One new idea put forward in section 3.2 and also listed in Table The K luminosity-metallicity relation for dwarf galaxies and the tidal dwarf galaxies in the tails of HCG 31 ††thanks: Based on observations obtained at the Gemini Observatory, which is operated by the Association of Universities for Research in Astronomy, Inc., under a cooperative agreement with the NSF on behalf of the Gemini partnership: the National Science Foundation (United States), the Particle Physics and Astronomy Research Council (United Kingdom), the National Research Council (Canada), CONICYT (Chile), the Australian Research Council (Australia), CNPq (Brazil) and CONICET (Argentina) – Observing run ID: GN-2004B-Q-47. may deserve some discussion. Although the optical spectra taken in this study show mainly HII-region-like spectra for the HCG 31 regions (see Fig. 4), for two of the galaxies, G and Q, the spectra are typical of e(a)-type galaxies. The properties of the e(a) class of galaxies have been interpreted by Poggianti et al. (1999) as a possible indication of dusty starbursts. However, in the spectra of Q and G there are no indications of particularly high values of internal extinction affecting the emission lines, since the observed H/H ratios are moderate ( 3.4 for Q and 4.0 for G). Hence, the interpratation of these two spectra remains uncertain. Nevertheless, we suggest that galaxies Q and G have started reducing their star formation rate and are evolving towards a post-starburst phase.
4.2 The tidal tails and the TDG candidates of HCG 31
HCG 31 is completely embedded within an H I envelop and it has two main tails: 1) the southern tail, which contains objects E, H, F and G, is a narrow and linear optical and H tidal tail, starting from galaxy C towards the southeast, ending with galaxy F or perhaps going even further (to the region of diffuse emission situated between F and G). This tail has been the subject of several previous studies (e.g. Amram et al., 2004) and 2) the northern tail, including objects A1, Q and R (see Fig. 2). The base of this tail, close to galaxy A, shows an open configuration, suggesting that the material has moved from its original plane. Except for the H I study of Verdes-Montenegro et al. (2005), this northern tail has never been studied before.
N-body simulations for compact groups show that stellar tidal tails are transient features that can be easily destroyed due to multiple interactions (e.g. Athanassoula et al., 1997; Barnes, 1985). Gaseous tails may also have similar fates. The frequency of occurrence and length of the tidal tails in galaxy mergers are strong functions of the encounter geometry and the merger phase. Galaxies in the pre-merger phase, where the two galaxies are still distinct but have gone through the first encounter, are expected to have well developed tidal features, as seen for HCG 31. As the final merger takes place, the tidal tails gradually disappear, with the material in the tails being accreted back onto the remnant or escaping the system altogether, eventually forming TDGs (e.g. Mihos et al., 1998; Hibbard & van Gorkom, 1996).
In Fig. 1 we plotted the location of the components of HCG 31 in the K-Z diagram in an attempt to identify good TDG candidates in this group. The objects display a range of luminosities of at least 6 magnitudes and a range of oxygen abundances of 0.5 dex.
While in the B-Z relation plotted in Fig. 14 of López-Sánchez et al. (2004) objects B, C and G are more than two magnitudes off the relation, in the corresponding K-Z relation these objects are closer to the best line for normal dwarfs, although they are still in the high-luminosity side of the relation. Although objects A1, E2 and F1/F2 are located in the low-luminosity side of the relation, they do not stand out, perhaps because even their K magnitudes could be brightened by the strong star bursts present in these objects (it is well known that at least F has a low old-stellar population content, Johnson & Conti, 2000). On the other hand, the low-luminosity objects H and R are completely off the K-Z relation. We note that for galaxy Q the metallicity determination has a very large error given the weak emission lines in its spectrum – this is then not plotted in Fig. 1.
We suggest, based on the velocities, positions in the L-Z relation, on their morphologies (our Figs. 2 and 3) and on their internal kinematics (Amram et al., 2004), that A, B, C, G and Q are galaxy members of HCG 31. On the other hand, based on the arguments below, we suggest that the lower-luminosity objects are either tidal debris or tidal dwarf galaxies of the group, formed as a consequence of the interaction. The more difficult task is then to decide which of the lower luminosity objects A1, E, F, H, R are tidal dwarf candidates or merely tidal debris.
Iglesias-Páramo & Vílchez (2001) devised a scheme to pick out tidal dwarf galaxy candidates in compact groups, based on their projected distances to the nuclei of the parent galaxies (at least 2 R25) and their H luminosities (which should be greater than 1038 ergs s-1). We note that HCG 31 was present in the sample of Iglesias-Páramo & Vílchez (2001) and our regions E2, H1, H2, F1, F2, and F3 correspond to their regions c, d+e, f, g, h, and i. The last three, composing object F, were among their final list of good candidates for TDGs. Following the same criteria, we classify one additional region as a tidal dwarf galaxy candidate, namely, region R (not known at the time of that study).
Verdes-Montenegro et al. (2005) also noted that object F is a good candidate for a tidal dwarf in formation. HCG 31 F1 coincides with a peak H I column density of 3 x 10²¹ atoms cm-2. In addition, the three blobs, F1, F2 and F3 are the bluest objects of the group (see last column of Table 2). No underlying old stellar population has been detected for this object (Johnson & Conti, 2000) and it has a metallicity similar to that of the central galaxies of HCG 31 (A+C and B). Although Amram et al. (2004) measured no rotation for F1+F2, which could suggest that it may not turn into an independent object, recent simulations of tidal dwarf galaxy formation (Wetzstein et al., 2005) conclude that these objects are expected to be non-rotators or very slow rotators.
Object R is a second excellent candidate tidal dwarf galaxy in the HCG 31 group. It coincides with an H I cloud of column density of 1021 atoms cm-2, which is one of the highest seen among all the tidal filaments of HCG 31. Optically it is formed by an approximately round distribution of faint H knots. We obtained a spectrum for one of these knots (R1), and we confirm that it is at the redshift of the group. Different from the intergalactic HII regions observed by Mendes de Oliveira et al. (2004), these knots are located in the peak of the HI distribution and seem to be a chain of linked star forming regions.
Objects F and R are then good examples of tidal fragments, well separated from their progenitors, coincident with peaks of the HI distribution, that could evolve to become tidal dwarf galaxies. Objects A1, E2 and H are likely also tidal fragments, but much closer to their progenitors, and may be falling back to the main central object of the group. In fact, E has two components in counter-rotation (Amram et al., 2004), suggesting that some of the material may be already returning to the parent galaxy.
Our hypothesis that regions F and R are good TDG candidates is also supported by the comparison of their properties with those of tidal dwarf galaxies that have been identified in other systems, for example those studied by Iglesias-Páramo & Vílchez (2001), Weilbacher et al. (2003), and by Temporin et al. (2003). The TDGs identified by Iglesias-Páramo & Vílchez (2001) in a subsample of HCGs have H luminosities comparable to those of the TDG candidates studied in this work. Similar results concerning H luminosities of TDG candidates were obtained by Weilbacher et al. (2003), who found an average H luminosity of 2.2 1039 ergs s-1 for TDGs identified in a sample of ten interacting systems, with the most luminous knots having values of order 1040 ergs s-1. Other candidate TDGs were identified by Temporin et al. (2003) in the tidal tail of the compact group CG J1720-67.8, whose properties seem to indicate an evolutionary stage similar to that of HCG 31 (Temporin & Fritze-v. Alvensleben, 2005). The estimated masses of the TDGs in this system are of order of 2 and burst ages for most objects range from 6 to 8 Myr. H luminosities from integral field spectroscopy are of order of 1040 erg s-1, with the brightest TDG candidates having L(H) = 4 1040 erg s-1, without correction for internal extinction (Temporin et al., 2005). The above ages are comparable to that obtained for object F3 (c.f., Section 3.2) and the H luminosities are of the same order of magnitude of those of our brightest components, listed in column 5 of Table 2. Additionally, we note that TDGs are usually associated with H I density peaks (e.g. TDGs in M81 and in NGC 5291, Makarova et al., 2002; Duc & Mirabel, 1998, respectively), as it is the case for objects F and R (see fig. 3 of Verdes-Montenegro et al., 2005).
Regarding the metallicities, when we place the HCG 31 objects in the diagram of Fig. 1, we note that for the lowest luminosity objects (H and R), the metallicites we measure are much higher than those for normal dwarf irregulars of similar luminosities, although F is not far from the best line for dwarf galaxies. We suggest that mostly the gas and some stars which today form regions F and R were earlier in galaxies A+C or B and were torned out by the interaction. Then in more recent times (a few million years ago) the young star complexes in F and R were formed through compression of the intergalactic H I gas by galaxy collisions. In fact, the young star complexes in R and F would have had to be formed in situ and not be ejected from the central galaxy because the time needed for those to move even from the outskirts of the central interacting pair to their current location, at a typical ejection velocity (due to dynamical interactions) of 200-300 km s-1 would be much longer than the age of their massive stars (as determined in Section 3.2).
N-body simulations of galaxy collisions have shown that tidal dwarf galaxies often form in the tails of major merger galaxies. The timing of each star-forming burst along the tails is strongly determined by the orbital orientation (prograde or retrograde) and the internal structure of the merging galaxies (bulge or bulgeless). Recently, through high resolution N-body/SPH simulations, Wetzstein et al. (2005) have shown that bound stellar objects can only form in the tidal arms of interacting disk galaxies, if they have a sufficiently massive and/or extended gas component. To our knowledge, no simulation including more than three galaxies, as is the case for compact groups, has ever been done, to attempt to reproduce an specific observational configuration. Simulations of HCG 31 are highly needed to understand the evolution of this complex interacting system and the formation of new objects.
References
- Amram et al. (2004) Amram, P., et al. 2004, ApJ, 612, L5
- Athanassoula et al. (1997) Athanassoula, E., Makino, J., & Bosma, A. 1997, MNRAS, 286, 825
- Balogh et al. (1999) Balogh, M. L., Morris, S. L., Yee, H. K. C., Carlberg, R. G., & Ellingson, E. 1999, ApJ, 527, 54
- Barnes (1985) Barnes, J. 1985, MNRAS, 215, 517
- Bertin and Arnouts (1996) Bertin, E. & Arnouts, S. 1996 A&AS, 117, 393
- Campos-Aguilar et al. (1993) Campos-Aguilar, A., Moles, M., & Masegosa, J. 1993, AJ, 106, 1784
- Conti (1991) Conti, P. S. 1991, ApJ, 377, 115
- Denicoló et al. (2002) Denicoló, G., Terlevich, R., & Terlevich, E. 2002, MNRAS, 330, 69
- Duc & Mirabel (1998) Duc, P.-A. & Mirabel, I. F. 1998, A&A, 333, 813
- Duc et al. (2000) Duc, P.-A., Brinks, E., Springel, V., Pichardo, B., Weilbacher, P., & Mirabel, I. F. 2000, AJ, 120, 1238
- Edmunds & Pagel (1984) Edmunds, M. G. & Pagel, B. E. J. 1984, MNRAS, 211, 507
- Fukugita et al. (1996) Fukugita, M., Ichikawa, T., Gunn, J. E.,Doi, M., Shimasaku, K., & Schneider, D. P. 1996, AJ, 111, 1748
- Gil de Paz et al. (2003) Gil de Paz, A., Madore, B. F., & Pevunova, O. 2003, ApJS, 147, 29
- Hibbard & van Gorkom (1996) Hibbard, J. E. & van Gorkom, J. H. 1996, AJ, 111, 655
- Hickson et al. (1992) Hickson, P., Mendes de Oliveira, C., Huchra, J. P., Palumbo, G. G. 1992, ApJ, 399, 353
- Hidalgo-Gámez & Olofsson (1998) Hidalgo-Gámez, A. M. & Olofsson, K. 1998, A&A, 334, 45
- Hidalgo-Gámez & Olofsson (2002) Hidalgo-Gámez, A. M. & Olofsson, K. 2002, A&A, 389, 836
- Hidalgo-Gámez et al. (2003) Hidalgo-Gámez, A. M., Sánchez-Salcedo, F. J., & Olofsson, K. 2003, A&A, 399, 63
- Hunter & Hoffman (1999) Hunter, D. A. & Hoffman, L. 1999, AJ, 117, 2789
- Hunter & Elmegreen (2004) Hunter, D. A. & Elmegreen, 2004, ApJ, 128, 2170
- Iglesias-Páramo & Vílchez (1997) Iglesias-Páramo, J. & Vílchez, J. M. 1997, ApJ, 479, 190
- Iglesias-Páramo & Vílchez (2001) Iglesias-Páramo, J. & Vílchez, J. M. 2001, ApJ, 550, 211
- Jarrett et al. (2000) Jarrett, T. H., Chester, T., Cutri, R., Schneider, S., Skrutskie, M., & Huchra, J. P. 2000, AJ, 119, 2498
- Johnson & Conti (2000) Johnson, K. E. & Conti, P. S. 2000, AJ, 119, 2146
- Johnson et al. (1999) Johnson, K. E., Vacca, W. D., Leitherer, C., Conti, P. S., & Lipscy, S. 1999, AJ, 117, 1708
- Karachentsev et al. (2004) Karachentsev, I. D., Karachentseva, V. E., Huchtmeier, W. K., & Makarov, D. I. 2004, AJ, 127, 2031
- Kennicutt & Skillman (2001) Kennicutt, R. C. & Skillman, E. D. 2001, AJ, 121, 1461
- Lee et al. (2003a) Lee, H., Grebel, E. K., & Hodge, P. W. 2003a, A&A, 401, 141
- Lee et al. (2003b) Lee, H., McCall, M. L., Kingsburgh, R. L., Ross, R., & Stevenson, C. C. 2003b, AJ, 125, 146
- Lee & Skillman (2004) Lee, H. & Skillman, E. D. 2004, ApJ, 614, 698
- Leitherer et al. (1999) Leitherer, C. et al. 1999, ApJS, 123, 3
- López-Sánchez et al. (2004) López-Sánchez, Á. R., Esteban, C., & Rodríguez, M. 2004, ApJS, 153, 243
- Makarova et al. (2002) Makarova, L. N., et al. 2002, A&A, 396, 473
- Masegosa et al. (1994) Masegosa, J., Moles, M., & Campos-Aguilar, A. 1994, ApJ, 420, 576
- Masegosa et al. (1991) Masegosa, J., Moles, M., & del Olmo, A. 1991, A&A, 249, 505
- Mateo (1998) Mateo, M. 1998 ARA&A, 36, 435
- Mateus & Sodré (2004) Mateus, A. Jr. & Sodré, L. Jr. 2004, MNRAS, 349, 1251
- Mendes de Oliveira et al. (2004) Mendes de Oliveira, C., Cypriano, E.S., Sodré Jr. L. & Balkowski, C. 2004, ApJ, 605, 17
- Mazzarella & Boroson (1993) Mazzarella, J. M. & Boroson, T. A. 1993, ApJS, 85, 27
- Miller & Hodge (1996) Miller, B. W. & Hodge, P. 1996, ApJ, 458, 467
- Mihos et al. (1998) Mihos, J. C., Dubinski, J., & Hernquist, L. 1998, ApJ, 494, 183
- Noeske et al. (2003) Noeske, K., Papaderos, P., Cairós, L. M., & Fricke, K. J. 2003, A&A, 410, 481
- O’Halloran et al. (2002) O’Halloran, B., Metcalfe, L., McBreen, B., Laureijs, R., Leech, K., Delaney, M., Watson, D., & Hanlon, L. 2002, ApJ, 575, 747
- Origlia et al. (2001) Origlia, L., Leitherer, C., Aloisi, A., Greggio, L., & Tosi, M. 2001, AJ, 122, 815
- Pettini & Pagel (2004) Pettini, M., Pagel, B. E. J. 2004, MNRAS, 348, L59
- Pilyugin (2001a) Pilyugin, L. S. 2001a, A&A, 369, 594
- Pilyugin (2001b) Pilyugin, L. S. 2001b, A&A, 374, 412
- Poggianti et al. (1999) Poggianti, B. M., Smail, I., Dressler, A., Couch, W. J., Barger, A. J., Butcher, H., Ellis, R. S., & Oemler, A. Jr. 1999, ApJ, 518, 576
- Poggianti & Wu (2000) Poggianti, B. M. & Wu, H. 2000, ApJ, 529, 157
- Richer et al. (2001) Richer, M. G., Bullejos, A., Borissova, J., et al. 2001, A&A, 370, 34
- Richer et al. (2003) Richer, M. G., Georgiev, L., Rosado, M., Bullejos, A., Valdez-Gutiérrez, M., & Dultzin-Hacyan, D. 2003, A&A, 397, 99
- Richer & McCall (1995) Richer, M. G. & McCall, M. L. 1995, ApJ, 445, 642
- Richer et al. (2001) Richer, M. G., et al. 2001, A&A, 370, 34
- Rubin et al. (1990) Rubin, V. C., Hunter, D. A., & Ford, W. K., Jr. 1990 ApJ, 365, 86
- Salzer et al. (2005) Salzer, J. J., Lee, J. C., Melbourne, J., Hinz, J. L., Alonso-Herrero, A., & Jangren, A. 2005, ApJ, 624, 661
- Saviane et al. (2005) Saviane, I., Held, E. V., Ivanov, V., Alloin, D., Bresolin, F., Rich, R. M., Rizzi, L., & Momany, Y. 2005, in IAU Coll. 198, Near-Field Cosmology With Dwarf Elliptical Galaxies, ed. B. Binggeli & H. Jerjen, in press (preprint astro-ph/0505341)
- Schlegel et al. (1998) Schlegel, D. J., Finkbeiner, D. P., & Davis, M. 1998, ApJ, 500, 525
- Skillman et al. (1989) Skillman, E. D., Kennicutt, R. C., & Hodge, P. W. 1989, ApJ, 347, 875
- Skillman et al. (1994) Skillman, E. D., Terlevich, R., Kennicutt, R. C., Garnett, D. R., & Terlevich, E. 1994, ApJ, 431, 172
- Temporin & Fritze-v. Alvensleben (2005) Temporin, S. & Fritze-v. Alvensleben, U. 2005, A&A, in press (preprint astro-ph/0509905)
- Temporin et al. (2005) Temporin, S., Staveley-Smith, L., & Kerber, F. 2005, MNRAS, 356, 343
- Temporin et al. (2003) Temporin, S., Weinberger, R., Galaz, G.,& Kerber, F. 2003, ApJ, 587, 660
- Thuan & Izotov (2005) Thuan, T. X. & Izotov, Y. I. 2005, ApJS, in press (preprint astro-ph/0507209)
- Vaduvescu et al. (2005) Vaduvescu, O., McCall, M. L., Richer, M. G., & Fingerhut, R. L. 2005, AJ, in press (astro-ph/0506706)
- Vigroux et al. (1987) Vigroux, L., Stasińska, G., & Comte, G. 1987, A&A, 172, 15
- Verdes-Montenegro et al. (2005) Verdes-Montenegro, L., Del Olmo, A., Yun, M. S., & Perea, J. 2005, A&A, 430, 443
- Wall & Jenkins (2003) Wall, J. V. & Jenkins, C. R. 2003, Practical Statistics for Astronomers, Cambridge University Press
- Weilbacher et al. (2003) Weilbacher, P. M., Duc, P.-A., & Fritze-v. Alvensleben, U. 2003, A&A, 397, 545
- Wetzstein et al. (2005) Wetzstein, M., Naab, T., & Burkert, A. 2005, MNRAS, submitted (preprint astro-ph/0510821)
- Williams et al. (1991) Williams, B. A., Mc Mahon, P. M., & van Gorkom, J. H. 1991, AJ, 101, 1957
- Yun et al. (1997) Yun, M. S., Verdes-Montenegro, L., del Olmo, A., & Perea, J. 1997, ApJ, 475, L21

| Name | M | AK | D.M. | M. | 12(O/H) | References | |
|---|---|---|---|---|---|---|---|
| (mag) | (mag) | (mag) | (Te-method) | (P-method) | |||
| DDO 47 | -15.17 | 0.012 | 28.57 | rgb | 7.80 | 7.86 | 3, 4 |
| DDO 50 | -18.85 | 0.012 | 27.65 | rgb | 7.90 | 7.84 | 13 + 19, this work |
| DDO 167 | -14.66 | 0.004 | 28.11 | rgb | 7.66 | 7.81 | 14, 4 |
| DDO 187 | -14.53 | 0.009 | 26.99 | rgb | 7.69 | 7.62 | 7, 4 |
| GR 8 | -13.71 | 0.01 | 26.61 | rgb | 7.40 | 7.60 | 11, 4 |
| IC 10aaThese galaxies have been classified as blue compact dwarfs by some authors: Richer et al. (2001, IC 10); Hunter & Hoffman (1999, Mrk 209); Noeske et al. (2003, Mrk 178, IC 4462, NGC 5408); Gil de Paz et al. (2003, NGC 1705) | -18.09 | 0.28 | 24.10 | cep | 8.19 | 8.25 | 7, this work |
| IC 2574 | -17.30 | 0.013 | 28.02 | rgb | 8.13 | 8.22 | 6+19, this work |
| IC 4662aaThese galaxies have been classified as blue compact dwarfs by some authors: Richer et al. (2001, IC 10); Hunter & Hoffman (1999, Mrk 209); Noeske et al. (2003, Mrk 178, IC 4462, NGC 5408); Gil de Paz et al. (2003, NGC 1705) | -17.81 | 0.026 | 27.32 | 8.01 | 8.03ee magnitude from Noeske et al. (2003) | 13, 4 | |
| IC 5152 | -17.30 | 0.009 | 26.58 | rgb | 7.92 | 7.80 | 12, 12 |
| Mrk 178aaThese galaxies have been classified as blue compact dwarfs by some authors: Richer et al. (2001, IC 10); Hunter & Hoffman (1999, Mrk 209); Noeske et al. (2003, Mrk 178, IC 4462, NGC 5408); Gil de Paz et al. (2003, NGC 1705) | -16.10 | 0.007 | 27.95 | rgb | 7.73 | 7.88 | 3, 4 |
| Mrk 209aaThese galaxies have been classified as blue compact dwarfs by some authors: Richer et al. (2001, IC 10); Hunter & Hoffman (1999, Mrk 209); Noeske et al. (2003, Mrk 178, IC 4462, NGC 5408); Gil de Paz et al. (2003, NGC 1705) | -16.27 | 0.005 | 28.78 | bs | 7.82 | 7.76 | 9, this work |
| NGC 55 | -20.03 | 0.005 | 26.28 | tf | 8.39 | 8.29 | 1, 1 |
| NGC 1156 | -19.91 | 0.082 | 29.46 | bs | 8.23 | 18 | |
| NGC 1560 | -18.80 | 0.069 | 27.69 | rgb | 8.02bbLee et al. (2003b) derived for NGC 1560 a lower limit 12(O/H) 7.97 | 8.12 | 17 , this work |
| NGC 1569 | -18.41 | 0.2 | 26.45 | bs | 8.23 | 8.31 | 1, 1 |
| NGC 1705aaThese galaxies have been classified as blue compact dwarfs by some authors: Richer et al. (2001, IC 10); Hunter & Hoffman (1999, Mrk 209); Noeske et al. (2003, Mrk 178, IC 4462, NGC 5408); Gil de Paz et al. (2003, NGC 1705) | -18.02 | 0.003 | 28.54 | rgb | 8.21 | 8.13 | 16, 16 |
| NGC 3109 | -16.34 | 0.024 | 25.62 | rgb | 7.74 | 7.63 | 7, 12 |
| NGC 3738 | -18.91 | 0.004 | 28.45 | rgb | 8.36ccMetallicity derived with the empirical method of Edmunds & Pagel (1984) | 8 | |
| NGC 4214 | -19.43 | 0.008 | 27.34 | rgb | 8.38 | 8.32 | 1, 1 |
| NGC 4395 | -18.34 | 0.006 | 28.32 | rgb | 8.42 | 8.27 | 1, 1 |
| NGC 4449 | -20.87 | 0.007 | 28.12 | rgb | 8.32 | 14 | |
| NGC 4789A | -15.84 | 0.003 | 28.17 | bs | 7.67 | 7.74 | 10, this work |
| NGC 5264 | -18.78 | 0.019 | 28.28 | rgb | 8.54ddAs noted by Lee et al. (2003a) the P-method value for this galaxy is uncertain, although in agreement with other methods of abundance determination. They adopt as best value an average of the values given by different methods, 12(O/H) = 8.61, and note that this galaxy has an anomalously high metallicity for its luminosity. | 12 | |
| NGC 5408aaThese galaxies have been classified as blue compact dwarfs by some authors: Richer et al. (2001, IC 10); Hunter & Hoffman (1999, Mrk 209); Noeske et al. (2003, Mrk 178, IC 4462, NGC 5408); Gil de Paz et al. (2003, NGC 1705) | -18.10ee magnitude from Noeske et al. (2003) | 0.025 | 28.41 | rgb | 7.99 | 7.88ffPilyugin (2001b) note that the H II regions of IC 4662 seem to belong to the transition zone of the R23 - O/H diagram, hence, in strict sense, the P-method equation for low metallicity H II regions should not be used. A similar argument holds for NGC 5408. | 15, this work |
| NGC 6822 | -16.77 | 0.087 | 23.49 | cep | 8.17 | 8.35 | 4, 4 |
| UGCA 92 | -15.16 | 0.291 | 26.28 | bs | 7.62 | 2 | |
| UGC 4483 | -14.20 | 0.012 | 27.53 | rgb | 7.52 | 7.47 | 5, 4 |
| UGC 5423 | -16.53 | 0.029 | 28.62 | bs | 7.98 | 7.81 | 6, 4 |
| UGC 6456 | -15.71 | 0.013 | 28.19 | rgb | 7.64 | 7.71 | 7, 4 |
Note. — Column 1: Identification of the object. Column 2: magnitudes either from Vaduvescu et al. (2005) or from 2MASS, before correction for Galactic extinction. Column 3: Galactic extinction from NED or from Origlia et al. (2001, NGC 1569) and Richer et al. (2001, IC 10). Column 4: Distance moduli (D. M.) from Karachentsev et al. (2004). Column 5: Methods used for distance determination: ‘brightest stars’ (bs), ‘tip of RGB’ (rgb), and Tully-Fisher relation (tf). The D. M. for IC 4662 is from Lee et al. (2003b). Columns 6 and 7: Oxygen abundances derived with the Te-method and the P-method, respectively. When abundances were present in the literature for more than one H II region of a given galaxy, the average value was considered. Column 8: References for the metal abundances; when two references are indicated, the first is for the Te-method and the second for the P-method determination.
References. — (1) Pilyugin (2001a); (2) Mateo (1998); (3) Hidalgo-Gámez & Olofsson (1998); (4) Pilyugin (2001b); (5) Skillman et al. (1994); (6) Miller & Hodge (1996); (7) Lee et al. (2003b); (8) Hunter & Hoffman (1999); (9) Thuan & Izotov (2005); (10) Kennicutt & Skillman (2001); (11) Hidalgo-Gámez & Olofsson (2002); (12) Lee et al. (2003a); (13) Hidalgo-Gámez et al. (2003) ; (14) Skillman et al. (1989); (15) Masegosa et al. (1994); (16) Lee & Skillman (2004); (17) Richer & McCall (1995); (18) Vigroux et al. (1987); (19) Masegosa et al. (1991)
| Name | MKaaFrom Table 2 of López-Sánchez et al. (2004), for an assumed distance of 54.8 Mpc, except for the measurements for H, Q, and R, that were estimated by us from an unpublished J-band image, corrected for the foreground Galactic extinction given in NED, AJ=0.046 mag, and adopting J-K=0.345. | L | VHel | VHI | 12(O/H) | [OIII]5007 | [NII]6583 | EW (H) | g′ - r′ | |||||
|---|---|---|---|---|---|---|---|---|---|---|---|---|---|---|
| (J2000) | (mag) | (ergs s-1) | (km s-1) | (km s-1) | TeddFrom Table 5 of López-Sánchez et al. (2004) | N2ddFrom Table 5 of López-Sánchez et al. (2004) | N2 | N2O3 | (H) | (H) | (Å) | |||
| A | 5:01:38.67 | -4:15:33.6 | 4090 | 0.67 | ||||||||||
| A1 | 5:01:39.74 | -4:15:12.4 | 17.72 | 38.76bbFrom López-Sánchez et al. (2004), spectroscopic measurement with corrections | 8.47 | 0.54 | ||||||||
| B | 5:01:35.25 | -4:15:51.6 | 19.30 | 40.22bbFrom López-Sánchez et al. (2004), spectroscopic measurement with corrections | 4122 | 8.14 | 8.39 | 0.60 | ||||||
| C | 5:01:37.76 | -4:15:28.4 | 19.90 | 40.57ccOur measurements; these are lower limits because the luminosities were not corrected for light loss from the slit. | 4055 34 | 3984 | 8.22 | 8.40 | 8.27 | 8.21 | 3.266 | 0.079 | 281 | 0.42 |
| E1 | 5:01:37.23 | -4:15:48.9 | 40.05–39.15 | 3967 10 | 8.13 | 8.36 | 8.31 | 8.30 | 2.095 | 0.092 | 740 | 0.59 | ||
| E2 | 5:01:37.48 | -4:15:57.5 | 16.28 | 38.90ccOur measurements; these are lower limits because the luminosities were not corrected for light loss from the slit. | 4009 14 | 8.30 | 8.25 | 2.770 | 0.088 | 34 | 0.42 | |||
| F1 | 5:01:39.71 | -4:16:22.2 | 15.97 | 40.12–40.01 | 3969 9 | 3968 | 8.07 | 8.06 | 8.00 | 7.98 | 5.850 | 0.026 | 1508 | 0.16 |
| F2 | 5:01:40.15 | -4:16:27.5 | 14.67 | 39.67–39.74 | 3956 9 | 8.03 | 8.02 | 7.98 | 7.99 | 5.027 | 0.024 | 1010 | 0.19 | |
| F3 | 5:01:40.62 | -4:16:36.5 | 37.87ccOur measurements; these are lower limits because the luminosities were not corrected for light loss from the slit. | 3990 90 | 8.13 | 8.29 | 1.033 | 0.044 | 74 | 0.13 | ||||
| G | 5:01:44.01 | -4:17:19.5 | 19.67 | 40.60–39.16 | 3997 9 | 4005 | 8.15 | 8.41 | 8.44 | 8.35 | 2.325 | 0.155 | 22 | 0.53 |
| H1 | 5:01:38.20 | -4:16:07.2 | 15.5eeThis value for the magnitude corresponds to the whole region H | 38.17–38.64 | 4050 29 | 8.41 | 8.33 | 8.52 | 0.459 | 0.102 | 600 | 0.46 | ||
| H2 | 5:01:38.72 | -4:16:13.5 | 38.59ccOur measurements; these are lower limits because the luminosities were not corrected for light loss from the slit. | 4066 23 | 8.24 | 8.23 | 2.444 | 0.069 | 556 | 0.42 | ||||
| Q | 5:01:38.30 | -4:13:20.9 | 19.3 | 38.11ccOur measurements; these are lower limits because the luminosities were not corrected for light loss from the slit. | 4037125 | 4090 | 8.51: | 8.56: | 0.694 | 0.207 | 6 | 0.56 | ||
| R1 | 5:01:34.33 | -4:12:56.7 | 14.3ffThis value for the magnitude corresponds to the whole region R | 38.12ccOur measurements; these are lower limits because the luminosities were not corrected for light loss from the slit. | 4139300 | 8.19 | 8.30 | 1.231 | 0.057 | 1672 | 0.44 | |||
Note. — Columns 6 to 9 list four independent measurements of 12(O/H), column 6 from López-Sánchez et al. (2004), using the Te method (row 3 of their Table 5), column 7 using the NII/H ratio from Denicoló et al. (2002) (row 5 of Table 5 of López-Sánchez et al. (2004)). Column 8 lists results of our measurements using the NII/H ratio (listed in column 11) and column 9 lists those using the N2O3 ratio (column 10 over column 11), both indicators defined in Pettini & Pagel (2004).
| Nature | Properties | References |
|---|---|---|
| HCG 31 AC | ||
| Galaxies in pre- | Underlying old stellar population | 1 |
| merging phase | Wolf-Rayet galaxy | 3 |
| SB nucleus moving to post-SB phase | 4 | |
| Major interaction occurred 400 Myr ago | 1 | |
| Age of central burst 4 - 5 Myr | 1 | |
| Young massive clusters 10 Myr | 1, 2 | |
| Bulk of 7.7 and 14.3 m emission | 4 | |
| Low 14.3 m to 7.7 m flux ratio | 4 | |
| Contain bulk of dust of the system | 4 | |
| Peak of CO and FIR in overlapping region of A and C | 7 | |
| Double kinematic components | 5 | |
| Double nucleus | 6, 2 | |
| HCG 31 B | ||
| Galaxy interacting | Detection at 7.7 m indicates SF | 4 |
| with AC | Warped disk with SF in 3 H knots | 4, 11 |
| or tidally distorted spiral arms | 10 | |
| SF over last 10 Myr with peak at 5 Myr | 2 | |
| Secondary peak of SF 10 Myr ago | 2 | |
| Metallicity similar to AC | 8, 12 | |
| Optical and H I emission are lopsided | 10 | |
| Shift between H I and stellar light in the south | 10 | |
| HCG 31 E | ||
| Tidal debris removed from AC | Young SSCs (1-3 Myr and 10 Myr) | |
| Material falling back to AC | with masses 104 - 105 M☉ | 2 |
| Age of component E1 3 Myr | 13 | |
| Underlying old stellar population | 2 | |
| Two components in counter-rotation | 5 | |
| Main component counter-rotating with respect to AC | 5 | |
| Amplitude of rotation of main component is 25 km s-1) | 5 | |
| Eastern component with recent SF | ||
| Western component is older | 2 | |
| Connected to AC by string of SF regions | 2 | |
| Metallicity similar to AC and B | 12 | |
| HCG 31 H | ||
| Tidal debris | Blob of size of 10″in between E and F | 12 |
| removed from AC | Metallicity similar to AC or higher | 12 |
| Higher velocity than E and F by 80 km/s | 12 | |
| SF episode with estimated age 3 - 4 Myr | 12, 13 | |
| HCG 31 F | ||
| TDG candidate | Several SSCs ( 4 Myr) with masses 104 - 105 M☉ | 2 |
| No underlying old stellar population | 2 | |
| Age of components F1 and F2 3 Myr | 13 | |
| Age of component F3 6 Myr | 13 | |
| Metallicity similar to AC | 8 | |
| Formed in tidal debris (4 Myr) | 2 | |
| Detected in H but not at 7.7m | 4 | |
| Two components non-connected by continuum or H | ||
| within the same H I peak | 2 | |
| No rotation, low gaseous velocity dispersion | 5 | |
| H I kinematically detached from tidal tail | 10 | |
| HCG 31 G | ||
| Galaxy moving through H I mass | Kinematically distinct from AC | 8 |
| or accreting mass from H I cloud | Local maximum of common H I envelope | 9, 10 |
| Asymmetric H emission | 2 | |
| SF at border facing southern tail | 2 | |
| SF over last 10 Myr with peak at 5 Myr | 2 | |
| Late-type morphology with very small bulge | 10 | |
| e(a) or A+em type galaxy – with considerable ongoing star formation | 13 | |
| HCG 31 A1 | ||
| Tidal debris | No rotation, low gaseous velocity dispersion | 5 |
| in northern tidal tail of AC | Detected at 7.7m | 4 |
| HCG 31 A2 | ||
| Tidal debris removed from AC | Rotation pattern (amplitude 25 km s-1) | 5 |
| Material falling back to AC | Counter-rotating with respect to AC | 5 |
| Detected at 7.7m | 4 | |
| HCG 31 Q | ||
| Galaxy | Radial velocity compatible with group membership | 8, 10 |
| Local maximum of common H I envelope | 9, 10 | |
| Spectrum dominated by A-type population | ||
| with very strong Balmer absorption lines | 13 | |
| Possibly post-starburst with residual star formation | 13 | |
| HCG 31 R | ||
| Newly identified TDG candidate | Formed by a number of star forming regions | 13 |
| Radial velocity compatible with group membership | 13 | |
| Age of component R1 2.6 Myr | 13 | |
| Metallicity similar to AC and B | 13 | |
| Coincides with a maximum in the H I envelope | 10, 13 | |
| Very weak continuum | 12, 13 | |
Note. — The following abbreviations are used in this table: FIR (far infrared emission); SB (starburst), SF (star formation), SSCs (super-star clusters), W-R (Wolf-Rayet).
References. — (1) Johnson et al. (1999); (2) Johnson & Conti (2000); (3) Conti (1991); (4) O’Halloran et al. (2002); (5) Amram et al. (2004); (6) Mazzarella & Boroson (1993); (7) Yun et al. (1997); (8) Richer et al. (2003); (9) Williams et al. (1991); (10) Verdes-Montenegro et al. (2005); (11) Iglesias-Páramo & Vílchez (1997); (12) López-Sánchez et al. (2004); (13) this work.