PKS 101842: A Powerful Kinetically Dominated Quasar
Abstract
We have identified PKS 1018-42 as a radio galaxy with extraordinarily powerful jets, over twice as powerful as any 3CR source of equal or lesser redshift except for one (3C196). It is perhaps the most intrinsically powerful extragalactic radio source in the, still poorly explored, Southern Hemisphere. PKS 1018-42 belongs to the class of FR II objects that are kinetically dominated, the jet kinetic luminosity, (calculated at 151 MHz), is 3.4 times larger than the total thermal luminosity (IR to X-ray) of the accretion flow, . It is the fourth most kinetically dominated quasar that we could verify from existing radio data. From a review of the literature, we find that kinetically dominated sources such as PKS 1018-42 are rare, and list the 5 most kinetically dominated sources found from our review. Our results for PKS 1018-42 are based on new observations from the Australia Telescope Compact Array.
1 Introduction
The southern sky below a declination of is still not well explored in the radio band compared to the northern sky and many of the intrinsically most powerful radio sources might not have ever been imaged in detail at radio wavelengths. Suspecting this to be the case, we began to search for evidence of the most powerful Southern Hemisphere radio sources from archival spectral information. Two sources stood out: PKS 074367 (reported in Punsly and Tingay (2005)); and PKS 101842.
In this Letter, we present the first deep radio observations of PKS 101842, a quasar at (Hewitt & Burbidge, 1993) with a 5 GHz flux density over 1.2 Jy (Gregory et al., 1994). The steep radio spectrum of PKS 101842 over a frequency range of 80 MHz (Slee, 1995) to 31.4 GHz (Geldzahler & Witzel, 1981) suggests that the source is dominated by optically thin radio lobe emission rather than Doppler-boosted core emission. Due to its southerly declination, there are no previously published deep radio maps of this extremely powerful object, however Ulvestad et al (1981) obtained VLA observations giving an indication of some source structure, but were not sufficient to reveal the detailed source morphology. Basic structural information from the VLA observations was limited only to the 20 cm waveband.
We have used Australia Telescope Compact Array (ATCA) observations to separate the core and lobe emission between 2.5 and 8.6 GHz, in order to caclulate the time-averaged kinetic luminosity of the jets, , making PKS 101842 one of the most kinetically dominated quasars known.
In this paper we adopt the following cosmological parameters: =70 km/s/Mpc, and . We use the radio spectral index, , as .
2 The Radio Observations
The Australia Telescope Compact Array (ATCA) was used to obtain observations of PKS 101842 on December 16, 2001, in a series of 20 minute cuts′′ over a 12 hour period. For half of the cuts the ATCA was configured to observe at frequencies of 1384 and 2496 MHz (1.4 and 2.5 GHz) and at 4800 and 8640 MHz (4.8 and 8.6 GHz) for the other half. The observations took place while the array was in a 6 km baseline configuration, allowing maximum angular resolution. At all frequencies the bandwidth was 128 MHz in each of two crossed linear polarisations.
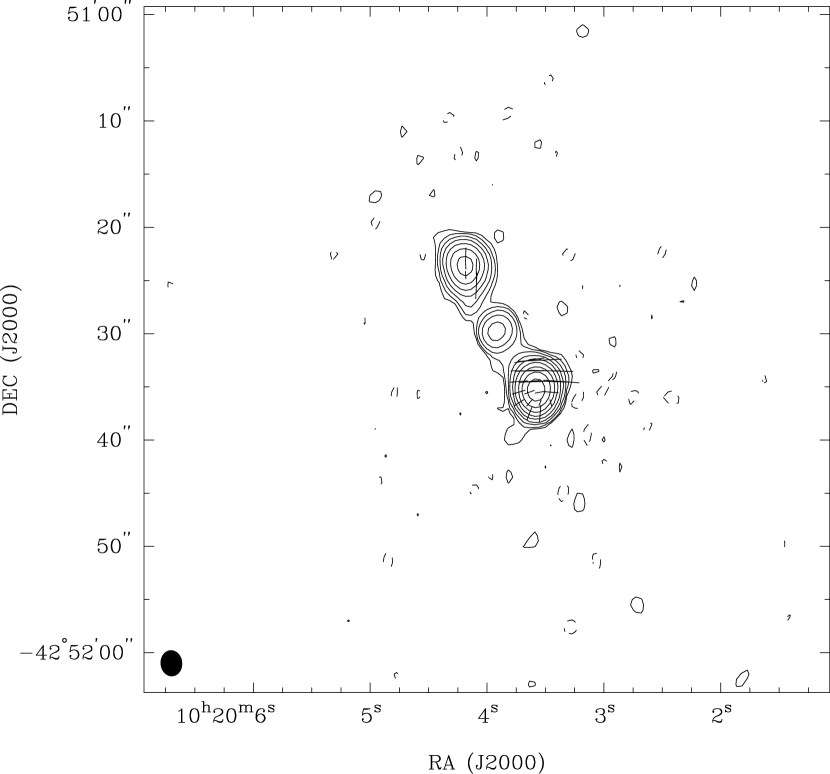
Standard data reduction and imaging techniques were used to produce images from the data (Sault et al., 1995). Stokes I, Q, and U images were produced from the 2.5, 4.8, and 8.6 GHz data. It was found that the 1.4 GHz data proved of insufficient angular resolution to be useful. Figure 1 shows the resulting image of PKS 101842 at 4.8 GHz. A core is centrally located between two powerful lobes. Estimates of component sizes and positions were made by model-fitting the u-v data with point sources, circular Gaussian, and elliptical Gaussian components in the DIFMAP package (Shephard et al., 1994) and are summarized in Table 1.
We are confident that we have recovered the full flux density of the source at each frequency since at 8.6 GHz, our highest frequency and therefore highest angular resolution, our total measured flux density of 0.63 Jy matches the independently determined single dish flux density at this frequency (Wright et al., 1991). We note that the 8.6 GHz image implies an axial length of 14.9″. In our adopted cosmology, this corresponds to an axial length of .
| Frequency | Beam | Component | Flux | FWHM | Notes |
|---|---|---|---|---|---|
| MHz | arcsec | Jy | arcsec | ||
| 1384 | 7.4 5.7 | North | 1.07 | 3.4 1.5 | |
| Core | na | na | a | ||
| South | 3.16 | 1.9 1.3 | |||
| Total | 4.23 | ||||
| 2496 | 4.2 3.5 | North | 0.51 | 1.7 1.4 | |
| Core | 0.12 | 5.7 1.3 | b | ||
| South | 1.77 | 1.2 0.7 | |||
| Total | 2.40 | ||||
| 4800 | 2.3 1.9 | North | 0.24 | 1.5 1.1 | |
| Core | 0.06 | 1.9 0.0 | c | ||
| South | 0.96 | 1.3 0.7 | |||
| Total | 1.26 | ||||
| 8640 | 1.3 1.1 | North | 0.11 | 1.4 1.2 | |
| Core | 0.03 | 0.5 0.0 | |||
| South | 0.49 | na | d | ||
| Total | 0.63 | ||||
3 Estimating the Jet Kinetic Luminosity
We estimate the jet kinetic luminosity from the isotropic extended emission, applying a method that allows one to convert 151 MHz flux densities, (measured in Jy), into estimates of kinetic luminosity, (measured in ergs/s), following Willott et al. (1999) and Blundell and Rawlings (2000), by means of the formula derived in Punsly (2005):
| (3-1) | |||
| (3-2) |
where is the total optically thin flux density from the lobes (i.e., no contribution from Doppler boosted jets or radio cores). The formula is most accurate for large classical double radio sources which is the case for PKS 101842 (Willott et al., 1999).
A measurement of the lobe flux at low frequency is critical to the successful implementation of (3.1). Our estimate of the spectral index between 2.5 and 8.6 GHz for the northern lobe is and for the southern lobe is . We estimate the core spectral index between 2.5 and 8.6 GHz as . We cannot separate the core and lobes at 1.4 GHz due to poor angular resolution at this frequency. However, extrapolating the lobe spectra to 1.4 GHz and subtracting the lobe fluxes at this frequency gives us an estimate of the core flux density of 0.016 Jy. The core spectrum therefore appears to flatten to near 1 GHz. This being the case, the core appearing to turn over below 1 GHz, the core contribution to the total flux at 151 MHz will be negligible.
Extrapolating the lobe flux densities using the 2.5 to 8.6 GHz spectral indices yields flux densities of 16 Jy and 45 Jy at 408 MHz and 160 MHz, respectively. However, the 408 MHz and 160 MHz flux densities have been previously measured as 12.72 Jy, Large et al. (1981), and 25.5 Jy, Slee (1995), respectively. Thus, the lobe spectrum appears to flatten slightly at frequencies below 1 GHz. Using a spectral index derived from the measurements at 408 MHz and 160 MHz, and extrapolating to 151 MHz, yields , which can be used in (3.1) to give . Alternatively, we can use our new 4.8 GHz flux from Table 1 with equation (3.9) of Punsly (2005), adapted to 4.8 GHz flux densities, ,
| (3-3) |
to obtain a slightly larger estimate, .
| Log (Hz) | Log (Hz) | Band | ref | ||
|---|---|---|---|---|---|
| start | end | start | end | ||
| 12.5 | 13.35 | 44.65 | 45.3 | mid IR | a |
| 13.35 | 14.4 | 45.3 | 44.95 | near IR | a |
| 14.4 | 15.0 | 44.95 | 45.45 | optical | a,b,c |
| 15.0 | 15.4 | 45.45 | 45.6 | UV | b,c |
| 15.4 | 17.25 | 45.6 | 44.3 | EUV/soft X-ray | b,c,d |
| 17.25 | 19.4 | 44.3 | 44.3 | X-ray | d |
4 Kinetic Dominance of the Source
In this section we estimate , the ratio of the kinetic luminosity, , to the total bolometric luminosity of the accretion flow, . Recall that is the bolometric luminosity of the thermal emission from the accretion flow, including any radiation in broad emission lines from photo-ionized gas or as IR reprocessed by molecular gas. In order to estimate , we construct a composite spectral energy distribution (SED) of a quasar accretion flow (Punsly and Tingay, 2005). In order to separate the accretion flow thermal luminosity from IR and optical contamination from the jet, an SED for radio quiet quasars (normalized to ) was chosen since this represents pure accretion luminosity. A piecewise collection of power laws in table 2 is used to approximate the individual bands in the SED. The first two columns are the start and stop frequencies for the each local power law. The third and fourth columns are the corresponding values of . One can compute the of the accretion flow from the composite SED. In addition to the continuum, the composite spectrum of Zheng et al. (1997) indicates that of the total optical/UV quasar luminosity is reprocessed in the broad line region. Combining this with the continuum luminosity yields . Now if one assumes that the shape of the SED is unchanged with the magnitude of then Table 2 is particularly useful, since it allows the knowledge of IR, UV or X-ray flux to estimate . Namely, scales with the value of the measured divided by the value of in the composite of Table 2 at the selected frequency of observation. With this assumption, the UV continuum flux density at the rest frame frequency of in the spectrum of PKS 101842 in Stickel et al. (1994) applied to the composite in Table 2 yields . Thus, for the 151 MHz estimate of and for the 4.8 GHz estimate of Q.
It is interesting to ask how rare it is to find a kinetically dominated quasar, . The natural place to find sources is to look at the highest redshift sources in a low radio frequency selected survey. To estimate in quasars, one can use primarily UV emission and also reprocessed IR dust emission to estimate from Table 2 as a check for obscuration of the accretion disk. For FR II narrow line radio galaxies (hidden quasars), one can only use the reprocessed IR dust emission that peaks around . In addition, a high resolution radio map is required to isolate the optically thin radio flux density that is required in (3.1).
| Source | freq | ref | ||||
|---|---|---|---|---|---|---|
| 3C 82 | 2.878 | 155.4 | 10.7 | 0.014 | 0.7 | a |
| 2.878 | 155.4 | 6.22 | 1.67 | 0.7 | a | |
| 3C 9 | 2.009 | 148.3 | 5.93 | 1.67 | 0.36 | b |
| 2.009 | 148.3 | 3.82 | 0.0078 | 0.36 | c | |
| 4C 45.21 | 2.686 | 59.3 | 5.11 | 1.14 | b | |
| PKS 1018-42 | 1.28 | 65.2 | 3.38 | 1.37 | 1.75 | d |
| 1.28 | 65.2 | 4.45 | 1.07 | 1.75 | d | |
| 3C 190 | 1.195 | 42.63 | 13.1 | 1.34 | e | |
| 1.195 | 42.63 | 1.12 | 0.133 | f | ||
| 1.195 | 42.63 | 2.81 | 1.07 | e | ||
| TXS 1243+036 | 3.57 | 114.8 | 2.71 | 0.0016 | … | g |
| 3C 405 | 0.056 | 23.2 | 0.75 | 0.005 | … | h |
| 0.056 | 23.2 | 0.93 | 100 | … | i | |
To determine the rate of occurrence of kinetically dominated quasars, the UV data from Veron-Cetty and Veron (2001) were cross-correlated with archival VLA and MERLIN radio maps, in order to single out possible large quasar candidates. The actual spectra (referenced in column 7 of table 3) of sources that looked promising were subsequently studied explicitly in order to compute . Similarly, submm data for high redshift, , sources (redshifted dust emission) in Archibald et al. (2001) and IR data for sources from Meisenheimer et al. (2001) and Haas et al. (2004) were used to estimate for obscured quasars with powerful radio emission. An exhaustive search of the literature revealed very few sources with larger than that of PKS 101842. We found deep radio observations of radio loud quasars primarily in the references Akujor et al (1991); Akujor and Garrington (1995); Antonucci and Ulvestad (1985); Bogers et al (1994); Hintzen et al (1983); Hutchings et al (1988); Liu et al (1992); Lonsdale et al (1993); Mantovani et al (1992); Murphy et al (1993); Neff et al (1989); Neff and Hutchings (1990); Punsly (1995); Reid et al (1999) with tabulated in Veron-Cetty and Veron (2001). Additionally, there were another powerful FRII radio galaxies with IR data in Archibald et al. (2001); Meisenheimer et al. (2001); Haas et al. (2004) and deep radio observations. The large sources are tabulated in Table 3. The first two columns are the source and its redshift, followed by and computed with equation (3.1). The fifth column is the frequency in which a rest frame flux density was used to estimate from Table 2. The sixth column is the UV spectral index, when it was available. In spite of this search, two of the four highest sources in Table 3, 3C 82 and PKS 101842 had no previously published radio maps and were found by looking for high redshift sources in Veron-Cetty and Veron (1991) with the largest low frequency flux densities and steep spectral indices. These were the most promising candidates out of the 6225 quasars. This initiated followup observations reported here and in Semenov et al. (2004).
The two estimates for both 3C 82 (the highest redshift 3C quasar known) and 3C 9 (the highest redshift 3CR quasar) in the IR and UV are in close agreement, verifying the validity of the composite in Table 2. Both 3C 405 and 3C 190 were added to the list of the five largest sources for comparison purposes. 3C 405 (Cygnus A) is the best studied example of a very high radio galaxy and the close agreement between the X-ray and IR estimates for 3C 405 are also affirmation of the application of Table 2. Note the difference in the estimates for 3C 190. The IR and the continuum UV estimate at disagree tremendously. This is because 3C 190 is an obscured quasar with a red spectrum, indicated by the steep UV spectral index of 3. Thus, a third estimate for 3C 190 is given, , from the MgII broad emission line. According to Wang et al. (2004), , where is the line luminosity. This 3C 190 line estimate agrees with the IR estimate, consistent with an attenuated line of sight toward the accretion disk but not towards the low ionization broad line region. The main reason for including 3C 190 is the rather steep UV spectral index of PKS 101842. This might raise some concerns about a heavily obscured accretion flow that is skewing the estimate of . We note that the MgII line estimator agrees with the UV continuum estimate for PKS 1018-42. Even though this is strongly supportive of the UV estimate of , a space based IR measurement would be definitive.
5 Conclusion
In this Letter, we have investigated radio images of a very powerful quasar PKS 101842 that is not well known due to its southerly declination. However, PKS 1018-42 is extraordinarily powerful with jets over twice as powerful as any 3CR source of equal or lesser redshift except for one (3C196) and is certainly worthy of more detailed study. We found that it is kinetically dominated with . It is the fourth most kinetically dominated quasar that we could verify from existing radio maps.
We showed in Table 3 that kinetic dominance is a particularly rare circumstance for quasars. This is consistent with the study of 7C sources in Willott et al. (1999) that was based on estimating from OII narrow line emission. The OII narrow lines are very distant from the central quasar and it is not clear how much jet propagation excites narrow line emission (see Veilleux and Bland-Hawthorn (1997) for one of many examples of narrow line emission that is stimulated by jet propagation). Using the UV luminosity from the central quasar directly as we have done is far more reliable, especially when verified independently with IR and broad line data as was done above. Thus, our results are consistent with Willott et al. (1999), but they are found from an independent and perhaps more scientifically justified method. However, Table 3 is incomplete because the most likely large candidates are high redshift 3C narrow line galaxies and the current sensitivity required for these estimates is not available, just loose bounds on the flux density (Archibald et al., 2001). Even if there are some kinetically dominated high z radio galaxies, this should not change the conclusion drawn from Table 3 that large values of , such as for PKS 101842, are unusual for quasars.
The rarity of large sources follows from the steep luminosity distributions for FR II quasars, and (Veron-Cetty and Veron, 2001; Punsly, 2001). A value of requires which is already at the high end of the steep kinetic luminosity distribution and these sources are rare. Yet, the complete absence of sources still seems unexpected because is a measure of the long term activity of the radio source over years and so it is not contemporaneous with the thermal emission from the accretion flow (Punsly, 2005). The timescale for the extended emission is so long, it would seem that there must be sources in which the accretion engine has long since shutoff in spite of powerful radio lobe emission 100 kpc away. Where are the fossil′′ sources with and the accretion flow almost shutoff, ? Perhaps some can be found as distant, , 3C narrow line galaxies with improved IR sensitivity. The Spitzer IR telescope is ideal for looking for such hidden kinetically dominated quasars. PKS 1018-42 would be an interesting source for the Spitzer telescope, in order to verify its standing in table 3. However, Spitzer observations to date have not added any new sources to table 3 (Haas et al., 2005). Alternatively, the absence of such sources might tell us something about the fundamental nature of the quasar jet central engine.
References
- Akujor et al (1991) Akujor, C., et al 1991, MNRAS 250 215
- Akujor and Garrington (1995) Akujor, C., Garrington, S. 1995, Astron. Astrophys. Suppl. 112 235
- Antonucci and Ulvestad (1985) Antonucci, R.J., Ulvestad, J. 1985, ApJ 294 158
- Archibald et al. (2001) Archibald, E. et al 2001 MNRAS 323 417
- Barthel et al. (1990) Barthel, P., Tytler, D., Thompson, B. 1990, Astron. and Astrophys. Sup. 82 339
- Bogers et al (1994) Bogers, W., Hes, R., Barthel, P., Zensus, J. 1994, Astron. and Astrophys. Sup. 105 91
- Blundell and Rawlings (2000) Blundell, K., Rawlings, S. 2000, AJ 119 1111 458
- Browne and Perley (1986) Browne, I.W.A., Perley, R. 1986, MNRAS 222 149
- Elvis et al. (1994) Elvis, M. et al 1994, ApJS 95 1
- Geldzahler & Witzel (1981) Geldzahler, B.J. & Witzel, A. 1981, AJ, 86, 1306
- Gregory et al. (1994) Gregory, P.C., Vavasour, J.D., Scott, W.K., & Condon, J.J. 1994, ApJS, 90, 173
- Haas et al. (2004) Haas, M.. et al 2004 A& A 424 531
- Haas et al. (2005) Haas, M.. et al 2005 A& A 442L 39
- Hewitt & Burbidge (1993) Hewitt, A. & Burbidge, G. 1993, ApJS, 87, 451
- Hintzen et al (1983) Hintzen, P., Ulvestad, J., Owen, F. 1983, AJ 88 709.
- Hutchings et al (1988) Hutchings, J., Price, R., Gower, A. 1988 ApJ 329 122
- Laor et al. (1997) Laor, A. et al 1997, ApJ 477 93
- Large et al. (1981) Large, M.I., Mills, B.Y., Crawford, D.F. & Sutton, J.M. 1981, MNRAS, 194, 693
- Liu et al (1992) Liu, R., Pooley, G., Riley, J. 1992 MNRAS 257 545
- Lonsdale et al (1993) Lonsdale, C., Barthel, P., Miley, G. 1993,ApJS 87 63
- Mantovani et al (1992) Montovani, F., et al 1992, MNRAS 257 353
- Meisenheimer et al. (2001) Meisenheimer, K. et al 2001 A& A 372719
- Murphy et al (1993) Murphy, D., Browne, I.W.A., Perley, R. 1993, MNRAS 264 298
- Neff and Hutchings (1990) Neff, S., Hutchings, J. 1990 AJ 100 1441
- Neff et al (1989) Neff, S., Hutchings, J., Gower, A. 1989 AJ 97 1291
- Punsly (1995) Punsly, B. 1995, AJ 109 1555
- Punsly (2001) Punsly, B. 2001, Black Hole Gravitohydromagnetics (Springer-Verlag, New York)
- Punsly (2005) Punsly, B. 2005, ApJL 623 L12
- Punsly and Tingay (2005) Punsly, B., Tingay, S. 2005, ApJL in press
- Reid et al (1999) Reid, R. I., Kronberg, P. P., Perley, R. A 1999, ApJS 124 285
- Sault et al. (1995) Sault, R.J., Teuben, P.J., Wright, M.C.H. 1995, in ASP Conf. Ser. 77, Astronomical Data Analysis Software and Systems IV, ed. R. Shaw, H.E. Payne, J.J.E. Hayes, (San Francisco: ASP), 433
- Semenov et al. (2004) Semenov, V. Dyadechkin, S., Punsly, B. 2004, Science 305 978
- Shephard et al. (1994) Shepherd, M.C., Pearson, T.J., Taylor, G.B. 1994, BAAS, 26, 987
- Simpson and Rawlings (2000) Simpson, C. and rawlings, S. 2000 MNRAS 317 1023
- Slee (1995) Slee, O. 1995, Aust.J.Phys. 48 143
- Smith and Spinrad (1980) Smith, H. E., Spinrad, H. 1980 ApJ 236 419
- Stickel et al. (1994) Stickel, M., Meisenheimer, K., Kuehr, H. 1994, A&AS105 211
- Telfer et al. (2002) Telfer, R., Zheng, W., Kriss, G., Davidsen, A. 2002, ApJ 565 773
- Ulvestad et al (1981) Ulvestad, J., Johnston, K., Perley, R. and Fomalont, E. 1981, AJ, 86, 1010
- Veilleux and Bland-Hawthorn (1997) Veilleux, S. and Bland-Hawthorn, J. 1997, ApJL476 L105
- Veron-Cetty and Veron (1991) Veron-Cetty, M.P., Veron, M. 1991, A Catalogue of Quasars and Active Nuclei 5th edition, European Southern Observatory Scientific Report No. 10
- Veron-Cetty and Veron (2001) Veron-Cetty, M.P., Veron, M. 2001, Astron. and Astrophys. 374 92 374 141
- Wang et al. (2004) Wang, J.-M., Luo, B, Ho, L. 2004, ApJL 615 9
- Willott et al. (1999) Willott, C., Rawlings, S., Blundell, K., Lacy, M. 1999, MNRAS309 1017
- Wright et al. (1991) Wright, A.E. et al. 1991, MNRAS, 251, 330
- Young et al. (2002) Young, A. et al 2002, ApJ
- Zheng et al. (1997) Zheng, W. et al 1997, ApJ 475 469