Testing the inverse-Compton catastrophe scenario
in the intra-day
variable blazar S5 0716+71
Abstract
Context. Some intra-day variable, compact extra-galactic radio sources show brightness temperatures severely exceeding K, the limit set by catastrophic inverse-Compton (IC) cooling in sources of incoherent synchrotron radiation. The violation of the IC limit, actually possible under non-stationary conditions, would lead to IC avalanches in the soft-–ray energy band during transient periods.
Aims. For the first time, broadband signatures of possible IC catastrophes were searched for in a prototypical source, S5 0716+71.
Methods. A multifrequency observing campaign targetting S5 0716+71 was carried out during November 06–20, 2003. The observations, organized under the framework of the European Network for the Investigation of Galactic nuclei through Multifrequency Analysis (ENIGMA) together with a campaign by the Whole Earth Blazar Telescope (WEBT), involved a pointing by the soft-–ray satellite INTEGRAL, optical, near-infrared, sub-millimeter, millimeter, radio, as well as Very Long Baseline Array (VLBA) monitoring.
Results. S5 0716+71 was very bright at radio frequencies and in a rather faint optical state () during the INTEGRAL pointing; significant inter-day and low intra-day variability was recorded in the radio regime, while typical fast variability features were observed in the optical band. No obvious correlation was found between the radio and optical emission. The source was not detected by INTEGRAL, neither by the X-ray monitor JEM-X nor by the -ray imager ISGRI, but upper limits to the source emission in the 3–200 keV energy band were estimated. A brightness temperature K (violating the IC limit) was inferred from the variability observed in the radio regime, but no corresponding signatures of IC avalanches were recorded at higher energies.
Conclusions. In the most plausible scenario of negligible contribution of the interstellar scintillation to the observed radio variability, the absence of the signatures of IC catastrophes provides either a lower limit to the Doppler factor affecting the radio emission or strong constraints for modelling of the Compton-catastrophe scenario in S5 0716+71.
Key Words.:
galaxies: active – galaxies: BL Lacertae objects: general – galaxies: BL Lacertae objects: individual: S5 0716+71 – galaxies: quasars: general – gamma-rays: observations – radiation mechanisms: non-thermal1 Introduction
The phenomenon of intra-day variability (IDV; Wagner & Witzel wagner1995 (1995)) has been a long-standing problem since its discovery in the late 1960s (see e.g. Racine et al. racine1970 (1970); Witzel et al. witzel1986 (1986); Heeschen et al. heeschen1987 (1987)). The occurrence of IDV appears to be more common in flat-spectrum extragalactic sources dominated by a very compact core in Very Long Baseline Interferometry (VLBI) maps (Quirrenbach et al. quirrenbach1992 (1992), quirrenbach2000 (2000)). With recent Very Long Baseline Array (VLBA) measurements, Kovalev et al. (kovalev2005 (2005)) showed that IDV sources typically exhibit a higher compactness and core-dominance on sub-milliarcsecond scales than non-IDV ones; they also found that a higher amplitude of intraday variations characterizes sources with a higher flux density in an unresolved VLBA component, and that the most variable sources tend to have the most compact structure.
Rapid variations in flux may be caused by mechanisms intrinsic to the source. In this case, causality arguments would imply that the variability originates from very compact regions of the AGN, thus characterized by high photon densities and brightness temperatures. In sources of incoherent synchrotron radiation, very high photon densities would lead to catastrophic cooling via inverse-Compton (IC) scattering of the synchrotron radiation by the high-energy electrons, with a production of high-energy radiation much higher than observed (Hoyle et al. hoyle1966 (1966)). Kellermann & Pauliny-Toth (kellermann1969 (1969)) showed that the onset of catastrophic radiation losses, occurring when the photon energy density in the emission region exceeds the energy density of the magnetic field, limits the maximum observed brightness temperature to the so-called ‘IC limit’ K (see also Readhead readhead1994 (1994)). They also noticed, however, that this limit may be significantly exceeded under non-stationary conditions. Evidence of severe violations of the IC limit was reported for many compact IDV radio sources (see e.g. Quirrenbach et al. quirrenbach1989 (1989); Wagner & Witzel wagner1995 (1995); Kedziora-Chudczer et al. kedziora1997 (1997)), although no information about corresponding IC-scattered emission is available for any of them.
Alternatively, propagation effects, like variations of the absorption along the line of sight, deflection of the light in the potential well of foreground stars (microlensing; Chang & Refsdal chang1979 (1979)), and, in the radio regime, interstellar scintillation (ISS; Rickett rickett1990 (1990); Rickett et al. rickett1995 (1995)), are possible extrinsic-source mechanisms which have been invoked to explain IDV. On the one hand, microlensing was shown to be an unlikely explanation of the rapid variability in the best-studied IDV sources, due to the frequency of the flaring activity, the statistical asymmetry of the light curves, the short time scales of variability, and the non-zero lag measured between optical and radio variations (see Wagner wagner1992 (1992) and references therein). On the other hand, ISS is not expected to play a major role at millimeter and sub-millimeter wavelengths, the transition between weak and strong scintillation regimes occurring in the centimeter domain (Rickett et al. rickett1995 (1995)).
In order to reconcile intrinsic variations with the theoretical limit, different explanations, like beaming of the emission due to bulk relativistic motion (Rees rees1967 (1967)), coherent radiation mechanisms (Baker et al. baker1988 (1988); Benford benford1992 (1992); Lesch & Pohl lesch_pohl1992 (1992)), propagation of a shock in an underlying, stable relativistic jet (Qian et al. qian1991 (1991)), were proposed. Neither the broad-band nature of the spectral energy distribution (SED) observed in IDV sources (see e.g. Quirrenbach et al. quirrenbach1989 (1989); Wagner et al. wagner1993 (1993), wagner1996 (1996)) nor the VLBI observations (see e.g. Gabuzda gabuzda2000 (2000)) strongly support any of them, leaving the alternative explanation that the IC limit might actually be violated and inverse-Compton catastrophes occur during transient periods (Kellermann & Pauliny-Tothkellermann1969 (1969); Slysh slysh1992 (1992)). In this paper, this hypothesis is explored for a prototypical source, S5 0716+71.
This source is one of the brightest and best-studied BL Lacertae objects in the sky. It was one of the prime targets for investigating the mechanism responsible for IDV, and the first source in which simultaneous variations in the radio and optical bands, indicating a possible intrinsic origin of the observed IDV, were reported (Wagner et al. wagner1990 (1990); Quirrenbach et al. quirrenbach1991 (1991)). Moreover, it exhibited IDV during all the past optical studies and almost all the radio campaigns carried out during the last two decades (Heeschen et al. heeschen1987 (1987); Wagner et al. wagner1990 (1990), wagner1996 (1996); Heidt & Wagner heidt1996 (1996); Ghisellini et al. ghisellini1997 (1997); Sagar et al. sagar1999 (1999); Quirrenbach et al. quirrenbach2000 (2000); Villata et al. villata2000 (2000); Nesci et al. nesci2002 (2002); Kraus et al. kraus2003 (2003); Raiteri et al. raiteri2003 (2003)). The IDV duty cycle of the source (the fraction of time in which the object is variable) derived from these studies is %.
Deep maps of the source obtained with the Very Large Array (VLA) show a core-halo structure on the arcsecond scale. VLBI observations over more than 20 years at centimeter wavelengths reveal a very compact source, with evidence of a core-dominated jet structure extending several tens of milliarcseconds to the North (Eckart et al. eckart1986 (1986), eckart1987 (1987); Witzel et al. witzel1988 (1988); Polatidis et al. polatidis1995 (1995); Jorstad et al. jorstad2001 (2001)). The milliarcsecond jet is misaligned with respect to the VLA jet by (Britzen et al. britzen2005 (2005); see also Eckart et al. eckart1987 (1987)).
Controversial scenarios, involving a wide range of proper motions (0.05–1.2 mas/year), were proposed for the kinematics of the S5 0716+71 jet components, the more recent ones pointing towards apparent velocities which are atypically fast for BL Lac objects (see Bach et al. bach2005 (2005), and references therein).
The redshift of the source is still unknown, although the starlike appearance and the absence of any signature of a host galaxy in deep images had set a lower limit of (Quirrenbach et al. quirrenbach1991 (1991); Stickel et al. stickel1993 (1993); Wagner et al. wagner1996 (1996)), which will be used throughout this paper. More recently, Sbarufatti et al. (sbarufatti2005 (2005)) suggested a higher lower limit of . The exact brightness temperature of the source can therefore not be determined: lower limits up to K were inferred from radio IDV at 5 GHz (Quirrenbach et al. quirrenbach1991 (1991); Wagner et al. wagner1996 (1996)), whereas a limit of K was estimated from the constraints on the core size derived through interferometric measurements performed in August 2003 with the Very Long Baseline Array (VLBA) at 15 GHz (Kovalev et al. kovalev2005 (2005)). This source is hence an ideal target for the investigation of radiative signatures of IC catastrophes.
S5 0716+71 has been detected at GeV energies with a steep -ray spectrum (Hartman et al. hartman1999 (1999)), but the soft-–ray part of its spectral energy distribution is poorly known: upper limits to the emission were provided by OSSE (McNaron-Brown et al. mcnaron1995 (1995)) and COMPTEL (Schönfelder et al. schonfelder2000 (2000)); a recent reanalysis of the COMPTEL data (Collmar collmar2006 (2006)) yielded a source detection in the 3–10 MeV energy range.
Synchrotron-self-Compton (SSC) emission models, which can reproduce the GeV -ray emission of the source (see e.g. Ghisellini et al. ghisellini1997 (1997)), predict the SED peak to occur in the MeV–GeV domain. The MeV detection reported by Collmar (collmar2006 (2006)) is indeed consistent with this scenario. The above SSC modelling involves a wide range of Lorentz factors of the radiating particles, up to , in order to explain the high-energy component of the spectrum.
In a Compton catastrophe, the main role is expected to be played by electrons responsible for the bulk of the radio emission in the GHz regime, where the violations of the IC limit have been observed. Assuming an observed peak frequency of the radio spectrum of a few GHz, and a magnetic field G ( being the Doppler factor of the emitting region), the above electrons would be characterized by Lorentz factors not greater than a few times . First-order IC scattering by these particles would generate bursts of radiation at Hz, which might blend with the synchrotron radiation produced by the high-energy tail of the same distribution of particles. The dominant loss-term would be second-order IC scattering (see e.g. Kellermann & Pauliny-Toth kellermann1969 (1969); Bloom & Marscher bloom1996 (1996)), also responsible for the onset of the catastrophe, and would boost photons into the Hz frequency range. Flares of IC-scattered radiation should therefore be observed in this energy range whenever the Compton limit is violated. The efficient cooling associated with a Compton catastrophe would then rapidly restore the actual brightness temperature of the source.
The advent of the soft-–ray INTEGRAL satellite offers an unprecedented chance of investigating this effect.
A multifrequency campaign involving an INTEGRAL pointing of the source and simultaneous radio, millimeter, sub-millimeter, near-infrared, and optical photometric monitoring, as well as VLBA observations, was organized and carried out during November 2003. For the first time, constraints on the brightness temperature and on the IC emission of the source were tested simultaneously against each other.
2 Ground-based multifrequency observations
The multiwavelength observations, organized under the framework of
the ENIGMA111http://www.lsw.uni-heidelberg.de/projects/enigma/
collaboration together with a
WEBT222http://www.to.astro.it/blazars/webt/
(see e.g. Mattox et al. mattox1998 (1998);
Villata et al. villata2004 (2004),
Raiteri et al. raiteri2005 (2005), and references therein)
campaign, were scheduled for the period November 06–20, 2003 (hereafter
referred to as the core campaign) to provide the low-energy counterpart of the
INTEGRAL observation of S5 0716+71.
Since the source underwent an unprecedented outburst phase at radio and millimeter
frequencies during September–October 2003,
the campaign was started earlier (October 2003).
When the core campaign began on November 06 (JD = 2452949.5),
S5 0716+71 was still brighter in the radio and millimeter domain
than in all past studies.
A rather faint optical state () characterized the source
in this band for the whole duration of the INTEGRAL pointing.
During the last two days of the core campaign the source entered a brightening
phase, and the ground-based monitoring was continued till May 2004.
We here present the results of the core campaign in terms of radio light curves at 32 and 37 GHz, and an optical -band light curve. Flux variation ranges at other radio, millimeter and sub-millimeter frequencies are included in the simultaneous SED presented in Sect. 4; the corresponding light curves will be discussed in Agudo et al. (agudo2006 (2006)) and Fuhrmann et al. (in prep.). The ground-based observing facilities whose contribution to the core campaign is presented in this paper are listed in Table 1.
2.1 Radio data
| a. Radio, millimeter and sub-millimeter observatories | ||||
| Observatory | Location | Telescope diameter | Observing frequencies | |
| (telescope) | (m) | (GHz) | ||
| Westerbork | The Netherlands | 14 25 | 1.392, 1.67 | |
| UMRAO | Michigan, USA | 26 | 4.8, 8.0, 14.5 | |
| Effelsberg | Germany | 100 | 4.85, 10.45, 32.0 | |
| Metsähovi | Finland | 13.7 | 22.2, 36.8 | |
| IRAM | Spain | 30 | 86.0, 230.0 | |
| HHT-SMTO | Arizona, USA | 10 | 345.0 | |
| JAC (JCMT) | Hawaii | 15 | 350.0, 664.0 | |
| b. Optical observatories | ||||
| Observatory | Location | Telescope diameter | -band data | Offsets |
| (cm) | (nights) | |||
| Lulin | Taiwan | 100 | 153 (7) | 0. |
| Mt. Maidanak | Uzbekistan | 150 | 2 (1) | 0. |
| Abastumani | Georgia | 70 | 655 (6) | [0.03;0.] |
| Crimean | Ukraine | 70 | 3 (2) | +0.03 |
| Tuorla | Finland | 103 | 102 (2) | [+0.01;+0.02] |
| MonteBoo | Czech Republic | 62 | 59 (2) | [+0.05;+0.07] |
| Perugia | Italy | 40 | 7 (4) | 0. |
| Heidelberg | Germany | 70 | 333 (8) | [+0.03;+0.06] |
| Michael Adrian | Germany | 120 | 90 (4) | +0.03 |
| Torino | Italy | 105 | 19 (3) | 0.02 |
| Hoher List | Germany | 106 | 41 (2) | +0.14 |
| Calar Alto | Spain | 220 | 374 (3) | [+0.01;+0.02] |
| Roque de los Muchachos (KVA) | Spain | 35 | 58 (5) | 0.01 |
| Roque de los Muchachos (WHT) | Spain | 420 | 751 (1) | 0. |
| Bell | Kentucky, USA | 60 | 3 (1) | 0. |
| St. Louis | Missouri, USA | 36 | 3 (1) | 0. |
| Kitt Peak (WIYN) | Arizona, USA | 90 | 21 (6) | 0. |
| Coyote Hill | California, USA | 28 | 73 (1) | 0. |
| University of Victoria | Canada | 50 | 102 (1) | 0. |
2.1.1 Observations, data reduction and calibration
The radio observations of S5 0716+71 at 32 GHz were performed during JD = 2452954.889–2452961.251 with the 100-m radio telescope in Effelsberg. The measurements were carried out using repeated scans, each of them consisting of 4–8 cross-scans in azimuth and elevation, resulting in typical single flux-density exposure times of 120–480 s. The antenna temperature on the source was measured through the averaged pointing-corrected amplitude of the Gaussian-shaped cross-scans and with the standard data reduction software of the 100-m telescope. Regular measurements of the system temperature were used to determine the time-dependent fluctuation of the atmospheric opacity, which was used to correct the measured antenna temperature for each scan. Several non-variable secondary calibrators (within 10∘–20∘ of S5 0716+71) were observed with the same sampling of the target source, in order to ensure an accurate calibration of the residual gain fluctuations, mainly due to atmospheric effects. The total flux-density scale was fixed using the standard primary calibrators (e.g. 3C 286, 3C 295, NGC 7027), whose fluxes are given in Baars et al. (baars1977 (1977)) and Ott et al. (ott1994 (1994)). Further details on the observing method and data-reduction scheme can be found in Kraus et al. (kraus2003 (2003)) and references therein.
The measurements at 37 GHz were obtained in the period JD = 2452951.878–2452962.838 with the 13.7-m diameter radome-enclosed antenna of the Metsähovi Radio Observatory. The 37-GHz receiver is a dual horn, Dicke-switched receiver with a HEMT preamplifier, and it is operated at room temperature. On-on observations were performed, alternating the source and the sky in each feed horn, and adopting typical integration times of 1200–1400 s. The source DR 21 was used as the primary flux calibrator, whereas 3C 84 was used as a secondary calibrator. Errors in the calibrated fluxes were computed by taking both the contribution of the measurement rms and the uncertainty in the absolute calibration into account. More details about the Metsähovi observing system and data reduction can be found in Teräsranta et al. (terasranta1998 (1998)) and references therein.
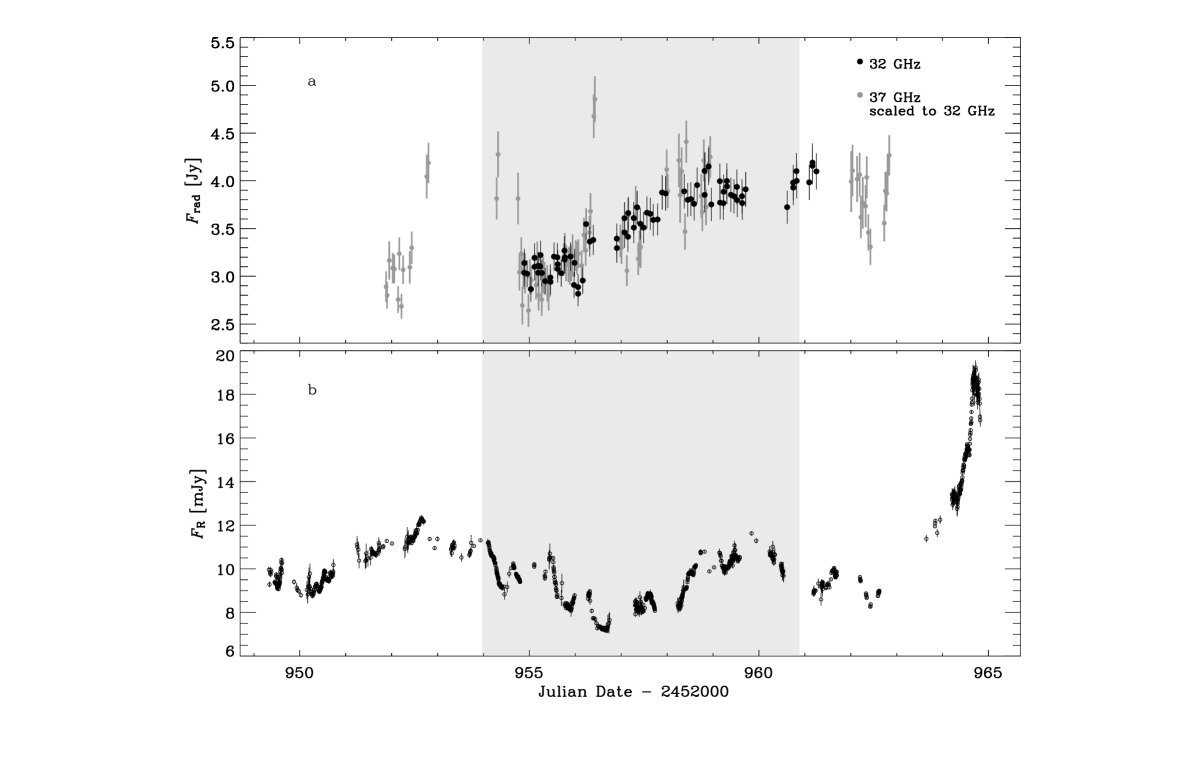
2.1.2 The light curves
Fig. 1a shows a superposition of the 32 GHz (black symbols) and 37 GHz (grey symbols) radio light curves. In spite of the different measurement accuracy and scatter which characterize the two data sets, a rise of the source flux over the observing period, with some shorter-term fluctuations superimposed, is clearly visible at both wavelengths.
| Time interval | (GHz) | Slope | Sign. | |
| (JD-2452000.00) | [bin (h)] | (Jy/d) | (%) | |
| a | ||||
| 954.889–961.251 | 32 | 1.00 | 47.53 | |
| 951.878–962.838 | 37 [12.4] | 1.38 | 19.04 | |
| b | ||||
| 954.878–958.962 | 32 | 0.96 | 55.30 | |
| 37 [3.] | 1.22 | 22.71 | ||
| c | ||||
| 954.889–956.391 | 32 | 1.21 | 19.97 | |
| 32 | 1.17 | 24.08 | ||
| 956.904–957.968 | 32 | 0.86 | 61.50 | |
| 32 | 0.38 | 98.50 | ||
| 958.372–959.711 | 32 | 0.36 | 99.67 | |
| 32 | 0.38 | 99.45 | ||
| 960.614–961.251 | 32 | 0.60 | 77.58 | |
| 32 | 0.28 | 96.36 | ||
| 951.878–952.437 | 37 | 3.19 | 0.39 | |
| 37 | 2.26 | 1.61 | ||
| 954.782–955.419 | 37 | 1.13 | 32.26 | |
| 37 | 1.12 | 33.46 | ||
| 955.743–956.310 | 37 | 0.49 | 92.96 | |
| 37 | 0.33 | 98.37 | ||
| 956.980–957.423 | 37 | 1.67 | 9.96 | |
| 37 | 1.88 | 6.87 | ||
| 957.990–958.938 | 37 | 2.09 | 1.16 | |
| 37 | 2.24 | 0.79 | ||
| 962.010–962.428 | 37 | 2.23 | 1.73 | |
| 37 | 1.09 | 36.32 | ||
| 962.729–962.839 | 37 | 2.23 | 6.30 | |
| 37 | 0.27 | 84.51 | ||
| d | ||||
| 952.213–952.803 | 37 | 3.58 | 46.52 | |
| 954.286–954.980 | 37 | 2.32 | 2.32 | |
| 956.225–956.428 | 37 | 2.88 | 3.47 | |
A variability test was performed on the two data sets by checking their consistency with a constant flux level at the 0.1% significance level: the test yielded a negative result, meaning that the light curves clearly exhibit variability.
The overall increase of the brightness was approximated by a linear slope: the 32-GHz data can be represented by a linear increase of the flux of 41% in 6.4 days, whereas the 37-GHz data can be described by a flux rise of 39% in 10.7 days (see Table 2a).
A consistency check of the two light curves was performed for the period in which they overlap, namely JD = 2452954.878–2452958.962 . In this period, the data at 32 and 37 GHz were characterized by a sampling of and data-points per day, and average flux uncertainties of 4.6% and 5.0%, respectively. The difference in scatter of the two data trains is reflected in the fractional root-mean-square variability amplitude (see Vaughan et al. vaughan2003 (2003), and references therein), which is 9.1% at 32 GHz and 13.9% at 37 GHz. However, a Kolmogorov-Smirnov test showed that the differences between the 32-GHz and the 37-GHz data (rescaled to the 32-GHz frequency) are normally distributed at 95% significance level, confirming that the measurement errors can well account for the discrepancies between the two curves. The light curves are hence consistent with each other.
The period of overlap of the two light curves covers the inter-day flux variation recorded in the source during the core campaign: the rise in flux is consistent at both frequencies with the linear increase of 35% in 4.1 days which best fits the 32-GHz data (see Table 2b).
A search for faster variations was then performed in both light curves for the whole core-campaign period, during which the sampling of each light curve is such that it is easy to identify subsets of data separated in time by gaps of hours.
At 32 GHz, four subsets of light curve can be fitted by a linear trend, whose slope is significantly variable. The result of the variability test (made by assuming the slope equal to zero) and the best-fit value of the slope are reported, for each subset, in Table 2c. Seven subsets of data at 37 GHz can also be approximated by linear slopes (see Table 2c), with the exception of seven measurements during JD = 2452952, 2452954, and 2452956 (see Table 2d). The most extreme deviation was the one recorded during JD = 2452956 (which yielded a flux difference of in the distribution discussed above), corresponding to a linear increase of the flux of 42% in 0.12 days. The other two strong deviations can be described by linear flux variations of 33% in 0.41 days and 20% in 0.12 days, respectively.
The reliability of the observations can be best estimated by comparing the measurements taken simultaneously with different telescopes (see e.g. Witzel et al., witzel1992 (1992), for a comparison of the 5-GHz observations of S5 0716+71 performed at the same time with the VLA and the Effelsberg telescope in May 1989). Therefore, although a careful analysis of the 37-GHz data showed that the measurements characterized by extreme deviations were not affected by any obvious systematic effect, the lack of any counterpart at other radio frequencies did not allow us to consider the lower limits to the brightness temperatures inferred from those variations (up to K) as a reliable constraint on the variability brightness temperature of the source.
2.2 Optical data
2.2.1 Observations
Table 1b (cols. 1–4) shows names and locations of the nineteen observatories which contributed to the core campaign with -band optical data, together with the sizes of the telescopes used and the amount of useful observations provided.
It was recommended that the optical observers performed intranight observations of S5 0716+71 and of the field reference stars nos. 1 to 8 whose magnitudes are given in Villata et al. (villata1998 (1998)). The choice of the exposure times was left to the observers, who found the optimal compromise between high accuracy and good temporal sampling.
The core-campaign period was characterized by unfavourable weather conditions in most of the observing sites. However, the high declination of the source, the long northern nights, and the large number of telescopes involved allowed a considerable overlap among observations carried out with telescopes located at very different longitudes. This led to unprecedented dense monitoring of the source over such a long period: 2849 useful observations were performed in days, with an average rate of frames per hour.
2.2.2 Data reduction, calibration and assembly
Ten out of nineteen data sets (44% of the collected data) were homogeneously analysed with aperture photometry on de-biased and flat-fielded frames. The remaining data sets were analysed with different procedures by the observers themselves.
The instrumental magnitudes were then processed in order to obtain the standard magnitudes of S5 0716+71 and the relevant errors. Due to the variety of characteristics of the telescopes and detectors involved, as well as of the collected photometric results, not all the reference stars suggested to the observers were available for the calibration. Moreover, because the source was faint during most of the core campaign, the long exposure times required often caused the saturation of reference stars 1 and 2. In order to achieve a homogeneous data calibration and minimize the instrumental offsets, we defined our calibration sequence of reference stars common to most of the data sets and free of saturation, i.e. stars 3, 5 and 6. The uncertainty in the calibrated magnitudes of S5 0716+71 was estimated, for each subset of data taken during the same night and under comparable observing conditions, as follows: the two stars of the calibration sequence closest in magnitude to the source were selected, and their magnitude difference calculated. For each frame, the deviation of this quantity with respect to its mean was found. The error was taken as the larger of this deviation and the standard deviation of the difference over the night.
Binning (over time intervals from 5 to 20 minutes) was applied to intranight data trains affected by noise and/or low accuracy due to either non-optimal sky conditions or too short integration times.
The calibrated light curves relevant to the various telescopes were then assembled according to the procedure described in Villata et al. (villata2002 (2002)). Instrumental offsets were computed, night by night, whenever this was allowed by the temporal overlap between two data sets, i. e. when one of the two datasets had at least two data points belonging to the time interval covered by the second data set. Each offset was defined as the mean magnitude difference of the overlapping parts of the two light curves, the difference being computed between pairs of data points separated in time by no more than 5 minutes (see Table 1b, col. 5). The data sets were then corrected by the above offsets. Data subsets characterized by both lower accuracy and worse temporal sampling were finally discarded when higher-accuracy and better-sampled data trains were available in the same time interval. Data points affected by errors greater than 0.05 mag were not included in the final light curve, unless no other data were available within 10 minutes. The average accuracy of the final light curve is of order .
2.2.3 The light curve
The -band core-campaign light curve is displayed in Fig. 1b. Flux densities were derived from magnitudes using the absolute calibrations of Bessel (bessel1979 (1979)), and dereddened with the extinction laws of Cardelli et al. (cardelli1989 (1989)), under the assumption of a Galactic extinction (provided by NED; from Schlegel et al. schlegel1998 (1998)).
This light curve is characterized by a mean sampling of 20 minutes through the whole core-campaign period, and of about 14 minutes during the INTEGRAL observation.
The source displayed remarkable variability during the core campaign: the overall peak-to-peak -band variation was mJy ( mag), and the fractional root mean square variability amplitude .
A weekly modulation of the emission with intra-day features superimposed characterized the relatively faint state of the source before JD = 2452963.0: during this period the source brightness varied between 7.2 and 12.4 mJy (), the mean flux was mJy (), and . After JD = 2452963.0, a brightness rise of 7.8 mJy ( mag) occurred in 25.7 hours, and the source reached 19.2 mJy ( mag), the highest level recorded during the core-campaign period.
The IDV features do not generally show well-defined shapes, suggesting that there might be blending between successive flares. Their linear parts (in magnitude scale), lasting up to hours, display rising and declining rates not faster than 13% per hour. These variation rates are comparable with the steepest slopes reported by Wagner et al. (wagner1996 (1996)) (% h-1) and also with the slopes found by Villata et al. (villata2000 (2000)) (12% h-1). Lower-amplitude intra-day variations, on comparable time scales, were reported by Ghisellini et al. (ghisellini1997 (1997)), Sagar et al. (sagar1999 (1999)) and Nesci et al. (nesci2002 (2002)). Detailed temporal and spectral analysis of the optical variability will be given in forthcoming papers.
3 INTEGRAL observations and data analysis
INTEGRAL (Winkler et al. winkler2003 (2003)) observed S5 0716+71 from 2003 November 10th, 11:20:04 UT to 2003 November 17th, 09:09:31 UT, for a total amount of ks.
The observations were strongly affected by the biggest ever recorded solar flare (classified as X28), which occurred on November 04, 2003. Because of this event, SPI (Vedrenne et al. vedrenne2003 (2003)) underwent annealing treatment during revolutions 132–136 and was not operational for most of the granted observing time. Of the two detectors of JEM-X (Lund et al. lund2003 (2003)), only JEM-X 2 was used, while JEM-X 1 was switched off. IBIS/ISGRI (Ubertini et al. ubertini2003 (2004); Lebrun et al. lebrun2003 (2003)) and IBIS/PICsIT (Ubertini et al. ubertini2003 (2004); Di Cocco et al. dicocco2003 (2003)) were both operational.
The INTEGRAL data were analysed by means of the INTEGRAL Offline Scientific Analysis (OSA) software, whose algorithms are described in Westergaard et al. (westergaard2003 (2003)) for JEM-X and Goldwurm et al. (goldwurm2003 (2003)) for IBIS. Version 4.2 of the OSA software was used for the analysis of the IBIS data, whereas the improved OSA 5.0 was necessary for the JEM-X data analysis. The PICsIT data could not be analysed due to the failure of the OSA software pipeline.
3.1 JEM-X
The JEM-X observation is split into 145 different science windows with an average exposure of ks each. The OSA software was used to look for sources within an offset angle of to avoid spurious detections. S5 0716+71 was not detected in any of the single science windows, neither in the 3-35 keV band nor in any sub-band. There was also no other detected source in the field of view.
We combined the images from all the individual science windows into a mosaic (corresponding to a total effective exposure of ksec) with the varmosaic routine of the FTOOL package; however, the source remained undetected.
We estimated an upper limit to the flux of S5 0716+71 by means of the statistical variance of the mosaic intensity at the position of the source. The upper-limit intensity (cts cm -2 s-1), with being the square root of the variance, was multiplied by the ratio of the flux of the Crab Nebula in the JEM-X band (Toor & Seward toor1974 (1974); Nørgaard et al. norgaard1994 (1994)) and the JEM-X intensity obtained from a mosaic image of the Crab. Assuming the spectrum of S5 0716+71 to be identical to that of the Crab (; see Toor & Seward toor1974 (1974)), we obtained a flux upper limit of erg cm-2 s-1 (see Table 3a), which is lower than the upper limit derived by Pian et al. (pian2005 (2005)) from a shorter (189 ks) observation performed in April 2004.
| a. JEM-X | |||
|---|---|---|---|
| Energy | Intensity | Photon | Flux |
| range (keV) | (10-5 cts/cm2/s) | index | (10-12 erg/cm2/s) |
| b. IBIS/ISGRI | |||
| Energy | Count rate⋆⋆ | Photon | Flux |
| range (keV) | (cts/s) | index | (10-11 erg/cm2/s) |
-
⋆
Photon index adopted to derive the flux from the count rate, under the assumption that
-
⋆⋆
Count rate errors are 1 uncertainties
3.2 IBIS/ISGRI
The ISGRI-instrument data set consists of 150 science windows, corresponding to a total effective exposure of 362 ksec. The standard energy binning was used for the image deconvolution, and the individual frames were accumulated into a co-added mosaic image. Several sources, including Mrk 3 and Mrk 6, were reported as significant detections by the OSA software.
S5 0716+71 was not detected by the source locator at significance in any energy bin of the mosaic image. A signal was detected at a significance greater than in at least one energy bin between 15 and 200 keV in 54% of the individual science windows. The reliability of these detections was checked by extracting, from each science window, the count rate at the sky position of S5 0716+71 and in 12 background regions located within 1∘ of the source. A two-sample Kolmogorov-Smirnov test showed that the resulting distributions of source and background count rates in each sub-band were consistent with them being drawn from the same parent distribution at the 5% significance level, confirming the non-detection of S5 0716+71 at the science-window level also.
In order to estimate an upper limit to the source flux in the ISGRI energy band, we extracted, for each sub-band, the value of the statistical variance of the count rate at the position of the source from the mosaic333Note that the parameter responsible for pixel spread in constructing the mosaic was not activated in our ISGRI analysis (OBS1_PixSpread=0), in order to obtain a better estimate of variance in the mosaic (A. Goldwurm, priv. comm.) of all the science windows. The corresponding standard deviation () was multiplied by the HWHM of the distribution of the significances of the mosaic () to take systematic errors into account (A. Goldwurm, priv. comm.). The upper limits () to the count rate derived with this procedure are shown in Table 3b.
The above-mentioned result was crosschecked by estimating, for each energy sub-band, the standard deviation from the statistical variances of all the science windows (A. Goldwurm, priv. comm.). The flux and variance at the nominal position of the source were extracted from each science window. The mean of these fluxes was then computed by weighting it by the inverse of the corresponding variances. The error in the mean flux, representing , was found to have the same value as in the case of the mosaic, thus yielding equivalent upper limits.
The count-rate upper limits derived with these methods were converted into fluxes through XSPEC by using the results of the spectral analysis of three BeppoSAX observations (Giommi et al. giommi1999 (1999); Tagliaferri et al. tagliaferri2003 (2003)) above keV, where the source spectrum can be well represented by a power law (). In addition, the Crab Nebula spectrum () was also considered, for consistency with the assumption made for the computation of the JEM-X flux. By varying the assumed photon index in the range , we obtained the 3 flux upper limits given in Table 3b.
A comparison of this result with the ISGRI flux of S5 0716+71 derived by Pian et al. (pian2005 (2005)) in the 30–60 keV range from their % shorter observation (256 ksec) of April 2004 was performed by computing the flux in the same energy bin, under the assumption of a spectral index equal to that of the Crab Nebula. The upper limit obtained in this way was erg cm-2 s-1, a factor of below their detection.
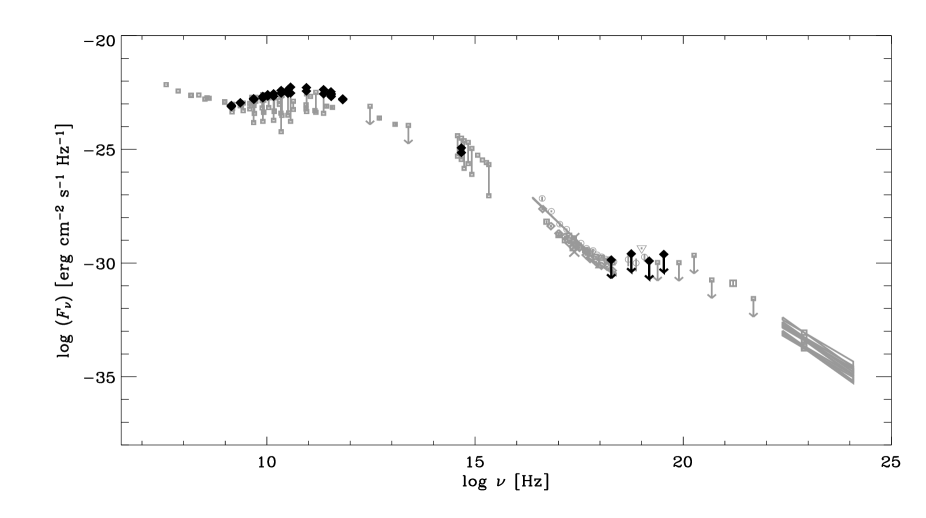
4 The spectral energy distribution (SED)
The broadband monitoring carried out during the INTEGRAL pointing (see Table 1 for a list of the ground-based observing facilities) allowed us to assemble, for the first time, the SED of S5 0716+71 with truly simultaneous data spanning more than 10 decades of frequency and characterized by an exceptional energy sampling.
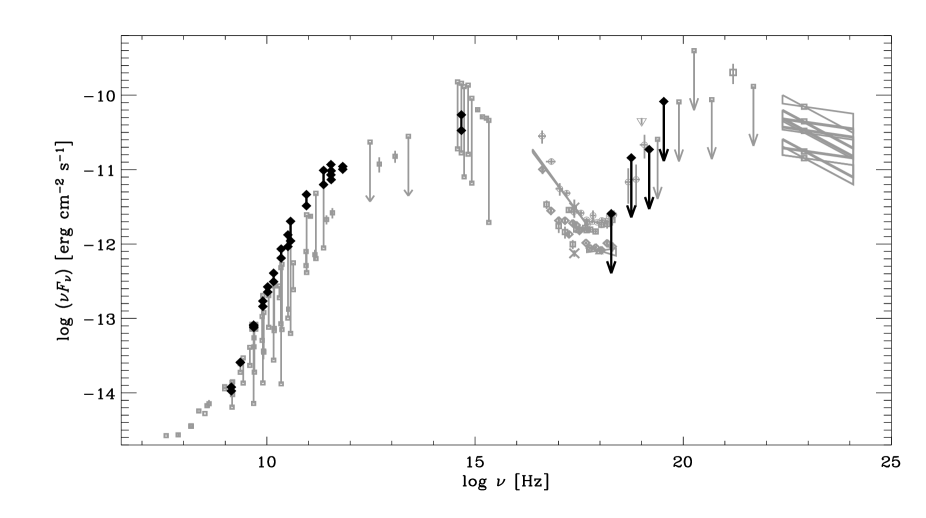
The SED of S5 0716+71 is displayed in Fig. 2, whereas the vs diagram is shown in Fig. 3 (Online Material). The flux variation ranges at radio-to-optical frequencies recorded during the INTEGRAL pointing period (see Sect. 2), as well as the upper limits estimated from the non-detection of the source by INTEGRAL (see Sect. 3) are plotted with dark diamonds, and are superposed on the historical data or variation ranges, drawn with grey symbols444Previous studies of the SED of S5 0716+71 can be found in Wagner et al. (wagner1996 (1996)), Ghisellini et al. (ghisellini1997 (1997)), Giommi et al. (giommi1999 (1999)), Ostorero et al. (ostorero2001 (2001)), and Tagliaferri et al. (tagliaferri2003 (2003))..
The low-energy part of the SED, which is commonly interpreted as due to synchrotron emission, shows the unprecedented brightness of the source in the radio-millimeter energy range and the moderate emission recorded at optical frequencies. The synchrotron peak (representing the most relevant output of the synchrotron component) is likely to be located around Hz.
During the core campaign, the synchrotron spectrum of S5 0716+71 was inverted (, with ) in the radio-millimeter wavelength domain, with a turnover frequency close to 90 GHz (see Agudo et al. agudo2006 (2006)). The spectral index of the partially opaque part of the spectrum was derived from the simultaneous radio measurements at 5 and 32 GHz (considerably below the turnover) performed on JD=2452955 and JD=2452961 with the Effelsberg 100-m radio telescope (see Fuhrmann et al., in prep.) Its value is on JD=2452955, and on JD=2452961: as the millimeter-flux rose towards the end of the observing period, the radio spectrum became more inverted.
As usually found in compact radio sources, the spectrum at frequencies lower than the turnover was not rising as fast as the optically thick spectrum of a homogeneous spherical synchrotron source (). Such behaviour is traditionally interpreted as the result of a superposition of spectra characterized by different synchrotron self-absorption (SSA) frequencies, which might be produced either by a finite number of homogeneous components (Kellermann & Pauliny-Toth kellermann1969 (1969)) or by an inhomogeneous source with gradients in the magnetic field and particle density (Condon & Dressel condon1973 (1973); de Bruyn deBruyn1976 (1976); Marscher marscher1977 (1977)).
The variability observed in the radio-millimeter energy range, of which we showed an example in the 32 and 37 GHz light curves presented in Sect. 2.1, hence occurred in a regime in which SSA processes might have played an important role.
The IDV study carried out during the fainter radio-to-optical state of the source of February 1990 (Wagner et al. wagner1990 (1990); Quirrenbach et al. quirrenbach1991 (1991)), reported a variable radio spectrum which was on average optically thin both in the 5.0–8.4 GHz energy range () and in the 1.4–5.0 GHz band () (Wagner et al. wagner1996 (1996)). The long-term behaviour of the radio spectral indices indicates spectra on average inverted in the 4.8–14.5 GHz band (; ) during 1985–1992 (Wagner et al. wagner1996 (1996)), as well as in the 5.0–15.0 GHz band () during 1978–2002 (Raiteri et al. raiteri2003 (2003)), where also a flatter-when-brighter trend and a weak correlation between spectral flattening and ejection of a new component were recognized by Raiteri et al. (raiteri2003 (2003)) and Bach et al. (bach2005 (2005)), respectively. However, no other truly simultaneous spectral information on the source spectrum from radio up to millimeter frequencies is available to date.
The moderate level of the optical emission recorded during the bright radio state is consistent with the absence of correlation, at zero time lag, between major optical and radio events in the source, as already noticed by Raiteri et al. (raiteri2003 (2003)) from inspection of the historical (1978–2002) radio-optical light curve.
As far as the high-energy part of the SED is concerned, the upper limits provided by JEM-X (see Sect. 3.1) and by IBIS/ISGRI (see Sect. 3.2) in the two lower-energy bins are consistent with the levels recorded by ASCA (Kubo et al. kubo1998 (1998)) and BeppoSAX (Giommi et al. giommi1999 (1999); Tagliaferri et al. tagliaferri2003 (2003)) during past observations, and indicate that the source was fainter than during the INTEGRAL observation of April 2004 (Pian et al. pian2005 (2005)), represented in Fig. 2 by the grey triangle at keV ( Hz). The two higher-energy IBIS/ISGRI upper limits are comparable with the limits derived from the OSSE observations (McNaron-Brown et al. mcnaron1995 (1995)).
5 Discussion and conclusions
The known high duty cycle of S5 0716+71 was confirmed by the intensive simultaneous radio-to-optical monitoring performed during the core campaign. The source was variable in both the radio and optical bands, although the amplitude of IDV recorded in the radio regime was significantly lower than in previous studies.
Let us assume long-term stationary radio emission, and consider a Gaussian brightness distribution for the variable source region. If the event which triggers the flux fluctuations propagates isotropically through the source, the flux variability observed in the radio band allows one to estimate the brightness temperature of the source through the relation:
| (1) |
where is the flux density in Jy, is the wavelength in cm, in years is a function of the mean flux and the flux variation in the time interval considered according to the relation
| (2) |
(Wagner et al. wagner1996 (1996); see also Jones et al. jones1974 (1974)), is the source redshift, and is the luminosity distance of the source in Mpc, given by
| (3) |
(Carroll et al. carroll1992 (1992)) in the case of a -dominated universe (, , ; see Spergel et al. spergel2003 (2003)). Assuming =72 km sec-1 Mpc-1 (Freedman freedman2001 (2001)) and a redshift , the source luminosity distance would be greater than 1510 Mpc. The brightness temperature derived from the overall increase of the source flux recorded at 32 and 37 GHz during the period of overlap of the two-frequency measurements ( days) is hence determined to be K, if the observed flux variations are not affected by any propagation effects. Higher lower limits to the brightness temperature can be derived under less-conservative assumptions: a uniform distribution of the source brightness, and/or an anisotropic propagation of the perturbation which causes the variability would yield values up to K. Moreover, a redshift limit would increase by a factor of . In any case, our brightness temperature exceeds the IC limit of K by at least two orders of magnitude.
If relativistic boosting of the radiation is the explanation of this excessive value, Doppler factors would be required in order to lower the intrinsic brightness temperature of the source below the theoretical limit555A more accurate value of the IC limit, and consequently a better estimate of the Doppler factor derived from the brightness temperature, would require detailed knowledge of the characteristics of the intrinsic spectrum of the source, including the synchrotron upper cutoff frequency, the self-absorption frequency, the radio spectral index, etc. (see e.g. Kellermann & Pauliny-Toth kellermann1969 (1969); Blandford blandford1990 (1990); Readhead readhead1994 (1994))..
A recent analysis of the historical data set of VLBI images of S5 0716+71 at several frequencies performed by Bach et al. (bach2005 (2005)) showed that Doppler factors 20–30 are consistent with the proper motion of the jet components. These values, which rule out slower kinematic scenarios of the source jet presented previously (Witzel et al. witzel1988 (1988); Gabuzda et al. gabuzda1998 (1998)), could largely account for the above brightness temperature, provided that the source region responsible for the observed flux variability had the same kinematic properties as the VLBI jet components.
The source flux evolution recorded in the centimeter–millimeter domain was always dominated by that of a core of size 0.1 mas. Confirmation of this evidence was recently provided by the 15-GHz VLBA measurements during August 2003 (Kovalev et al. kovalev2005 (2005)) and by the analysis of space-VLBI (VSOP) observations performed in 2000 (Bach et al. bach2006 (2006)). The observed variability hence originates from either the sub-parsec jet or regions at the base of the jet itself.
If the variability originates from one or more jet components moving according to the kinematics described by Bach et al. (bach2005 (2005)), and characterized by inverted or flat radio spectra (possibly becoming steeper as the components move away from the core), the brightness temperature would only apparently exceed the IC limit. The non-detection of the source by INTEGRAL might hence easily be the consequence of the non-occurrence of any Compton catastrophe in the source. This scenario would also enable us to reconcile the excessive VLBA brightness temperature of K derived by Kovalev et al. (kovalev2005 (2005)) with a value lower than the IC limit, assuming a Doppler factor (note that the VLBA brightness temperature scales by ).
On the other hand, if the variable core emission is affected by a Doppler enhancement different from that of the resolved VLBI jet components, the IC-limit violation would be real for Doppler factors . In this case, Compton catastrophes would have occurred in the source: the high-energy non-detection would hence provide a constraint for any model of the source emission taking second-order Compton scattering (e.g. Bloom & Marscher bloom1996 (1996)), and hence the possibility of Compton catastrophes, into account.
Some alternative explanations for the excessive brightness temperature take propagation effects into account. The correlation between optical brightness and radio spectral index, as well as the simultaneous change of variability time-scale observed during the February 1990 campaign (Wagner et al. wagner1990 (1990); Quirrenbach et al. quirrenbach1991 (1991); Wagner et al. wagner1996 (1996)), have been among the strongest arguments against the extrinsic origin of radio IDV in S5 0716+71 in the past decade. However, the radio and optical intra-day variability observed during our campaign, when the source was in a brighter radio-to-optical state and had an inverted spectrum up to millimeter frequencies, do not appear to be obviously correlated. This might be the consequence of optical-depth effects (which can modify the shape and amplitude of flares) on radio emission intrinsically correlated with that in the optical band; alternatively, the radio and optical radiation observed might have come from non-cospatial components characterized by different sizes. In the absence of correlated radio-optical variations, the possibility of a contribution of ISS to the observed radio variability cannot be completely ruled out, implying that the brightness temperature inferred from variability is not representative of the photon density of the source; in particular, the violation of the IC limit would again be only apparent in an ISS-driven variability scenario.
It is very unlikely that this variability can be explained by scintillation alone. In fact, ISS is not a very efficient mechanism in the 32-37 GHz (8-9 mm) regime, to which our brightness temperature refers. Moreover, the simultaneous observations at 86 GHz (3 mm), where ISS is less efficient than at 32-37 GHz, showed that ISS can be definitely ruled out as an explanation for the observed (comparable) variability at these frequencies and for the corresponding excessive brightness temperatures (Agudo et al. agudo2006 (2006)). Therefore, if ISS contributed to the observed 32-37 GHz flux evolution, in all likelihood it was not the dominant variability mechanism.
In conclusion, violations of the brightness-temperature IC limit were inferred from the radio variability observed at 32-37 GHz. If the recorded radio emission is either intrinsic and beamed with Doppler factors , or strongly affected by ISS, the violation of the IC limit would be apparent, and readily consistent with the non-detection of the source by INTEGRAL in the X–-ray regime. Intrinsic flux variations in the presence of lesser beaming effects would instead imply a real violation of the theoretical limit; in this case, the non-detection of corresponding -ray avalanches provides a strong constraint for modelling of the Compton catastrophe in this source. At any rate, our unprecedented simultaneous broad-band measurements will help to define the parameter space of SSC emission models in detailed studies of the multifrequency properties of S5 0716+71.
Acknowledgements.
We acknowledge an anonymous referee for a careful reading of the manuscript and for helpful advice. We acknowledge support by BMBF, through its agency DLR for the project 50OR0303 (S. Wagner). We acknowledge EC funding under contract HPRN-CT-2002-00321 (ENIGMA). V. M. Larionov and V. Hagen-Thorn acknowledge support from the Russian Foundation for Basic Research under grant 05-02-17562. S. Britzen acknowledges support by the Claussen-Simon Stiftung. A. S. Hojaev acknowledges NSC, Taiwan for an invitation and support as a Visiting Expert at IoA of NCU. This research has made use of: optical observations on the WHT, La Palma, made with the ULTRACAM photometer: we acknowledge the support of V. S. Dhillon (University of Sheffield, UK) and T. R. Marsh (University of Warwick, UK); data from the University of Michigan Radio Astronomy Observatory, which is supported by the National Science Foundation and by funds from the University of Michigan; data from the Westerbork Synthesis Radio Telescope, operated by ASTRON with financial support from the Netherlands Organisation for Scientific research (NWO); the NASA/IPAC Extragalactic Database (NED), which is operated by the Jet Propulsion Laboratory, California Institute of Technology, under contract with the National Aeronautics and Space Administration; the CATS database (Verkhodanov et al. verkhodanov1997 (1997)) of the Special Astrophysical Observatory. We are grateful to A. P. Marscher, A. Mastichiadis and J. G. Kirk for stimulating discussions on the problems of the brightness temperature and IC catastrophes, to the INTEGRAL Team for useful advice on the INTEGRAL data analysis, and to Y. Y. Kovalev for discussing the paper.References
- (1) Agudo, I., Krichbaum, T. P., Ungerechts, H., et al. 2006, A&A, submitted
- (2) Baars, J. W. M., Genzel, R., Pauliny-Toth, I. I. K., & Witzel, A. 1977, A&A, 61, 99
- (3) Bach, U., Krichbaum, T. P., Ros, E., et al. 2005, A&A, 433, 815
- (4) Bach, U., Krichbaum, T. P.,Kraus, A., Witzel, A., & Zensus, J.A. 2006, in press; astro-ph/0511761
- (5) Baker, D. N., Borovsky, J. E., Benford, G., & Eilek, J. A. 1988, ApJ, 326, 110
- (6) Benford, G. 1992, ApJ, 391, L59
- (7) Bessel, M. S. 1979, PASP, 91, 589
- (8) Biermann, P., Schaaf, R., Pietsch, W., et al. 1992, A&AS, 96, 339
- (9) Blandford, R. D., Netzer, H., & Woltjer, L. 1990, in Active galactic Nuclei, eds. T. J-L. Courvoisier & M. Mayor (Springer-Verlag, Berlin), 181
- (10) Bloom, S. D., & Marscher, A. P. 1996, ApJ, 461, 657
- (11) Brandt, S., Budtz-Jørgensen, C., Lund, N., et al. 2003, A&A, 411, L243
- (12) Britzen, S., Brinkmann, W., Campbell, et al. 2005, A&A, submitted
- (13) Cardelli, J. A., Clayton, C., & Mathis, J. S. 1989, ApJ, 345, 245
- (14) Carroll, S. M., Press, W. H., & Turner, E. L. 1992, ARAA, 30, 499
- (15) Chang, K. & Refsdal, S. 1979, Nature, 282, 561
- (16) Chenevez, J., Lund, N., Westergaard, N.J., et al. 2004, Proc. of The 5th INTEGRAL Workshop, The INTEGRAL Universe, Münich, 16-20 Feb. 2004
- (17) Cohen, A. S., Lane, W. M., Cotton, W. D., et al. 2002, Bulletin of the American Astronomical Society, 201st AAS Meeting, Vol. 34, p. 1274
- (18) Collmar, W. 2006, in Proc. Blazar Variability Workshop II: Entering the GLAST Era, Miller H. R. (ed.), ASP Conf. Ser., in press
- (19) Comastri, A., Fossati, G., Ghisellini, G., & Molendi, S. 1997, ApJ, 480, 534
- (20) Condon, J. J., & Dressel, L. L. 1973, Ap. Lett., 15, 203
- (21) Eckart, A., Hill, P., Johnston, K. J., et al. 1982, A&A, 108, 157
- (22) Eckart, A., Witzel, A., Biermann, P. et al. 1986, A&A, 168, 17
- (23) Eckart, A., Witzel, A., Biermann, P. et al. 1987, A&AS, 67, 121
- (24) de Bruyn, A. G. 1976, A&A, 52, 439
- (25) Dhawan, V., Bartel, N., Rogers, A. E. E., et al. 1990, ApJ, 360, L43
- (26) Douglas, J. N., Bash, F. N., Bozyan, F. A., Torrence, G. W., & Wolfe, C. 1996, AJ, 111, 1945
- (27) Di Cocco, G., Caroli, E., Celesti, E., et al. 2003, A&A, 411, L189
- (28) Freedman, W. L., Madore, B. F., Gibson, B. K., et al. 2001, ApJ, 553, 47
- (29) Gabuzda, D. C., Kovalev, Y. Y., Krichbaum, T. P., et al. 1998, A&A, 333, 445
- (30) Gabuzda, D. C., Kochenov, P. Yu., Cawthorne, T. V., & Kollgaard, R. I. 2000, MNRAS, 313, 627
- (31) Gear, W. K., Stevens, J. A., Huges, D. H., et al. 1994, MNRAS, 267, 167
- (32) Ghisellini, G., Villata, M., Raiteri, C. M., et al. 1997, A&A 327, 61
- (33) Giommi, P., Massaro, E., Chiappetti, L., et al. 1999, A&A, 351, 59
- (34) Goldwurm, A., David, P., Foschini, L., et al. 2003, A&A, 411, L223
- (35) Greve, A., Steppe, H., Graham, D., Schalinski, C. J. 1994, A&A, 286, 654
- (36) Hales, S. E. G., Mayer, C. J., Warner, P. J., & Baldwin, J. E. 1991, MNRAS, 251, 46
- (37) Hales, S. E. G., Waldram, E. M., Rees, N., & Warner, P. J. 1995, MNRAS, 274, 447
- (38) Hartman, R. C., Bertsch, D. L., Bloom, S. D., et al. 2000, ApJS, 123, 79
- (39) Heeschen, D. S., Krichbaum, T. P., Schalinski, C. J., & Witzel, A. 1987, AJ, 94, 1493
- (40) Heidt, J., & Wagner, S. J. 1996, A&A, 305, 42
- (41) Hoyle, F., Burbidge, G. R., & Sargent, W. L. W. 1966, Nat, 209, 751
- (42) Jones, T. W., O’Dell, S. L., & Stein, W. A. 1974, ApJ, 192, 261
- (43) Jorstad, S. G., Marscher, A. P., Mattox, J. R., et al. 2001, ApJS, 134, 181
- (44) Kedziora-Chudczer, L., Jauncey, D. L., Wieringa, M. H., et al. 1997, ApJ 490, L9
- (45) Kellermann, K. I., & Pauliny-Toth, I. I. K. 1969, ApJ, 155, L71
- (46) Kovalev, Y. Y., Kellermann, K. I., Lister, M. L., et al. 2005, AJ, 130, 2473
- (47) Kraus, A., Krichbaum, T. P., Wegner, R., et al. 2003, A&A, 401,161
- (48) Krichbaum, T. P., Witzel, A., Graham, D. A., et al. 1993, A&A, 275, 375
- (49) Kubo, H., Takahashi, T., Madejski, G., et al. 1998, ApJ, 504, 693
- (50) Kühr, H., & Schmidtt, G. D. 1990, AJ, 99, 1
- (51) Kühr, H., Witzel, A., Pauliny-Toth, I. I. K., & Nauber, U. 1981, A&AS, 45, 367
- (52) Lawrence, C. R., Readhead, A. C. S., Linfield, R. P., et al. 1985, ApJ 296, 458
- (53) Lebrun, F., Leray, J. P., Lavocat, P., et al. 2003, A&A, 411, L141
- (54) Lesch, H., & Pohl, M. 1992, A&A, 254, 29
- (55) Lund, N., Budtz-Jørgensen, C., Westergaard, N. J., et al. 2003, A&A, 411, L231
- (56) Marscher, A. P. 1977, ApJ, 216, 244
- (57) Mattox, J. R. 1998, Bulletin of the American Astronomical Society, 192nd AAS Meeting, Vol. 30, p. 859
- (58) McNarown-Brown, K., Johnson, W. N., Jung, G. V., et al. 1995, ApJ, 451, 575
- (59) Moshir, M., Kopan, G., Conrow, T., et al. 1990, IRAS First Source Catalogue, ver. 2.0 (Greenbelt: NASA/GSFC)
- (60) Nesci, R., Massaro, E., & Montagni, F. 2002, Publ. Astron. Soc. Aust., 19, 143
- (61) Nørgaard, H. U., Nielsen, C., Budtz, C., et al. 1994, A&A, 284, 705
- (62) Ostorero, L., Raiteri, C. M., Villata, M., et al. 2001, Mem. Soc. Astron. Ital., 72, 147
- (63) Ott, M., Witzel, A., Quirrenbach, A., et al. 1994, A&A, 284, 331
- (64) Perley, R. A. 1982, AJ 87, 859
- (65) Perley, R. A., Fomalont E. B., & Johnston, K. J. 1982, ApJ, 255, L93
- (66) Pian, E., & Treves, A. 1993, ApJ, 416, 130
- (67) Pian, E., Foschini, L., Beckmann, V., et al. 2005, A&A, 429, 427
- (68) Polatidis, A. G., Wilkinson, P. N., Xu, W., et al. 1995, ApJS, 98, 1
- (69) Qian, S. J., Quirrenbach, A., Witzel, A., et al. 1991, A&A, 241, 15
- (70) Quirrenbach, A., Witzel, A., Krichbaum, T. P., et al. 1989, Nat, 337, 442
- (71) Quirrenbach, A., Witzel, A., Wagner, S. J., et al. 1991, ApJ, 372, L71
- (72) Quirrenbach, A., Witzel, A., Krichbaum, T. P. et al. 1992, ApJ, 258, 279
- (73) Quirrenbach, A., Kraus, A., Witzel, A., et al. 2000, A&AS, 141, 221
- (74) Racine, R. 1970, ApJ, 159, 99L
- (75) Raiteri, C. M., Villata, M., Tosti, G., et al. 2003, A&A, 402, 151
- (76) Raiteri, C. M., Villata, M., Ibrahimov, M. A., et al. 2005, A&A, 438, 39
- (77) Readhead, A. C. 1994, ApJ, 426, 51
- (78) Rees, M. J. 1967, MNRAS, 135, 345
- (79) Rengelink, R. B., Tang, Y., de Bruyn, A. G., et al. 1997, A&AS, 124,259
- (80) Rickett, B. J. 1990, ARA&A, 28, 561
- (81) Rickett, B. J., Quirrenbach, A., Wegner, R., et al. 1995, A&A, 293, 479
- (82) Riley, J. M. W., Waldram, E. M., & Riley, J. M. 1999, MNRAS, 306, 31
- (83) Saikia, D. J., Salter, C. J., Neff, S. G., et al. 1987, MNRAS, 228, 203
- (84) Sagar, R., Gopal-Krishna, M. V., et al. 1999, A&AS, 134, 453
- (85) Sbarufatti, B., Treves, A., & Falomo, R. 2005, ApJ, 635, 173
- (86) Schlegel, D. J., Finkbeiner, D. P.. & Davis, M. 1998, ApJ, 500, 525
- (87) Schönfelder, V., Bennett, K., Bloom, J. J., et al. 2000, A&AS, 143, 145
- (88) Slysh, V. I. 1992, ApJ, 391, 453
- (89) Spergel, D. N., Verde, L., Peiris, H. V., et al. 2003, ApJS, 148, 175
- (90) Stickel, M., Fried, J.W., & Kühr, H. 1993, A&A, 98, 393
- (91) Tagliaferri, G., Ravasio, M., Ghisellini, G., et al. 2003, A&A, 400, 477
- (92) Teräsranta, H., Tornikoski, M., Mujunen, A., et al. 1998, A&A 132, 305
- (93) Toor, A., & Seward, F. D. 1974, AJ, 79, 995
- (94) Ubertini, P., Lebrun, F., Di Cocco, G., et al. 2003, A&A, 411, L131
- (95) Vaughan, S., Edelson, R., Warwick, R. S., & Uttley, P. 2003, MNRAS 345, 1271
- (96) Vedrenne, G., Roques, J.-P., Schönfelder, V., et al. 2003, A&A, 411, L63
- (97) Verkhodanov, O. V., Trushkin, S. A., Andernach, H., & Chernenkov, V. N. 1997, Astronomical Data Analysis Software and Systems VI, eds. G. Hunt & H. E. Payne, ASP Conf. Ser., 125, 322
- (98) Villata, M., Raiteri, C. M., Lanteri, L., Sobrito, G., & Cavallone, M. 1998, A&AS 130, 305
- (99) Villata, M., Mattox, J., Massaro, E., et al. 2000, A&A, 363, 108
- (100) Villata, M., Raiteri, C. M., Kurtanidze, O. M., et al. 2002, A&A 390, 407
- (101) Villata, M., Raiteri, C. M., Aller, H. D., et al. 2004, A&A, 424, 497
- (102) Wagner, S. J. 1992, in Gravitational Lenses, ed. R. Kayser, S. Refsdal & T. Schramm (Springer, Berlin), 189
- (103) Wagner, S. J., & Witzel, A. 1995, ARA&A, 33, 163
- (104) Wagner, S. J., Sanchez-Pons, F., Quirrenbach, A., & Witzel, A. 1990, A&A, 235, L1
- (105) Wagner, S. J., Witzel, A., Krichbaum, T. P., et al. 1993, A&A, 271, 344
- (106) Wagner, S. J., Witzel, A., Heidt, J., et al. 1996, AJ, 111, 2187
- (107) Waltman, E., Johnston, K.J., Spencer J.H., et al. 1981, A&A, 101, 49
- (108) Westergaard, N. J., Kretschmar, P., Oxborrow, C. A., et al. 2003, A&A, 411, L257
- (109) Winkler, C., Courvoisier, T. J.-L., Di Cocco, G., et al. 2003, A&A, 411, L1
- (110) Witzel, A. 1992, in Physics of Active Galactic Nuclei, ed. W. J. Duschl & S. J. Wagner (Springer, Berlin), 484
- (111) Witzel, A., Heeschen, D. S., Schalinski, C., & Krichbaum, T. P. 1986, Mitt. d. Astron. Gesell., 65, 239
- (112) Witzel, A., Schalinski, C., Johnston, K. J., et al. 1988, A&A, 206, 245
- (113) Zhang, X., Zheng, Y., Chen, H., et al. 1997, A&AS, 121, 59