GRB 050505: A high redshift burst discovered by Swift
Abstract
We report the discovery and subsequent multi-wavelength afterglow behaviour of the high redshift () Gamma Ray Burst GRB 050505. This burst is the third most distant burst, measured by spectroscopic redshift, discovered after GRB 000131 () and GRB 050904 (). GRB 050505 is a long GRB with a multipeaked -ray light curve, with a duration of s and an inferred isotropic release in -rays of ergs in the keV rest frame energy range. The Swift X-Ray Telescope followed the afterglow for days, detecting two breaks in the light curve at ks and ks after the burst trigger. The power law decay slopes before, between and after these breaks were , and respectively. The light curve can also be fit with a ‘smoothly broken’ power law model with a break observed at ks, with decay slopes of and before and after the break respectively. The X-ray afterglow shows no spectral variation over the course of the Swift observations, being well fit with a single power law of photon index . This behaviour is expected for the cessation of continued energisation of the ISM shock followed by a break caused by a jet, either uniform or structured. Neither break is consistent with a cooling break. The spectral energy distribution indeed shows the cooling frequency to be below the X-ray but above optical frequencies. The optical – X-ray spectrum also shows that there is significant X-ray absorption in excess of that due to our Galaxy but very little optical/UV extinction, with for a SMC-like extinction curve.
keywords:
gamma-rays: bursts – gamma-rays: observations – galaxies: high redshift – galaxies: ISM1 Introduction
Gamma Ray Bursts (GRBs) are expected to be visible over a large range of redshifts with a potential upper limit of Lamb & Reichart (2000). The lowest recorded GRB redshift to date is GRB 980425 with Tinney et al. (1998), whilst the highest is GRB 050904 at Kawai et al. (2005)111We also note that a photometric redshift of has been reported for GRB 060116 (Malesani et al. 2006, Grazian et al. 2006) but this has yet to be confirmed spectroscopically. Bursts at high redshift are potentially important since they can be powerful probes of the early Universe. Long duration bursts ( s) are likely caused by the core-collapse of a massive star Hjorth et al. (2003); Stanek et al. (2003), linking these bursts directly to contemporary star formation. In addition, high redshift GRBs allow us to probe the intervening matter between the observer and GRB, and particularly the conditions of their host galaxies (e.g. Vreeswijk et al. 2004).
So far, only bursts have a firm redshift determination, mostly obtained through spectroscopy of their optical afterglow. The record holder is GRB 050904, see Watson et al. (2005), Cusumano et al. (2005) and Tagliaferri et al. (2005) for more details. Previously the highest redshift burst was GRB 000131 Andersen et al. (2000). Unfortunately BATSE detected GRB 000131 during a partial data gap Kippen (2000) so its position was not localised until hours after the trigger, thus its early time behaviour is unknown. No breaks were directly observed in the light curve for GRB 000131 but, based on the spectral index, an upper limit on the jet break time of days has been hypothesised Andersen et al. (2000). In contrast, the rapid position dissemination for GRB 050505 allowed a rapid redshift determination, and its automated follow-up program provided a well-covered X-ray afterglow light curve. Here we present the results from Swift Gehrels et al. (2004) on GRB 050505. Two breaks were detected in the X-ray light curve, the first of which we consider to be due to the cessation of continued energisation of the ISM shock and the second is a jet break, caused by either a structured or uniform jet. Both breaks are inconsistent with a cooling break passing through the X-ray band (see ).
2 Swift Observations of GRB 050505.
At 23:22:21 UT on the of May , the Swift Burst Alert Telescope (BAT; Barthelmy et al. 2005), triggered and located GRB 050505 on-board (trigger ID ; Hurkett et al. 2005). The BAT mask-weighted light curve (see Fig ) shows a multi-peaked structure with a 222The time during which of the counts are accumulated ( keV) of seconds. The initial peak began seconds before the trigger and extended to seconds after the trigger. There were three further short spikes with peaks at , and seconds, where is the trigger time.
The observed keV BAT spectrum was adequately fit by a single power law with a photon index (with ) and a mean flux over of () ergs cm-2 s-1 in the keV range and () ergs cm-2 s-1 in the keV range. All errors in this paper are quoted at confidence unless otherwise stated. Whilst fitting a cutoff power law does not give a significantly better fit () it does provide us with an indication of the for this burst. We find a photon index and a lower limit of keV (at the confidence level).
The burst was detected in each of the four standard BAT energy bands and had a ratio of fluence in the keV band to that in the keV of , close to the mean ratio of the BATSE catalogue333http://cossc.gsfc.nasa.gov/docs/cgro/batse/4Bcatalog/index.html. The total fluence in the keV band is () ergs cm-2 Hullinger et al. (2005), which is slightly higher than the average fluence detected to date by Swift.

Swift executed an automated slew to the BAT position and the X-Ray Telescope (XRT; Burrows et al. 2005), began taking data at 00:09:23 UT on May 2005, minutes after the burst trigger. The delay in the spacecraft slew was due to an Earth limb observing constraint. The XRT was in Auto state, where autonomous data mode switching was enabled, but the on-board software did not automatically locate a position due to low source brightness. Ground processing revealed an uncatalogued X-ray source within the BAT error circle located at RA = 09:27:03.2, Dec = +30:16:21.5 (J2000) with an estimated uncertainty of arcseconds radius ( containment; Kennea et al. 2005). Updating the XRT boresight, Moretti et al. (2005) have corrected this position to RA = 09:27:3.16, Dec = +30:16:22.7 with an estimated uncertainty of arcseconds (also containment). No data was obtained in WT mode due to the delayed slew, since this mode is only used for sources brighter than 1 mCrab.
Observations continued over the next days, though the X-ray afterglow was not detected after the day. Co-adding the final days of observations produced a total of ks of data providing an upper limit of counts s-1, consistent with the extrapolated decay (see ).
The Swift Ultra-Violet/Optical Telescope (UVOT; Roming et al. 2005), observed the field starting at 00:09:08 UT on the May 2005, minutes after the burst trigger. The initial data were limited to one second exposure in each of the four filters. No new sources were found in the XRT error circle to limiting magnitudes ( in arcsecond radius apertures) of , , and . Additional co-added, deeper exposures ( s) with the UVOT also failed to detect an optical counterpart at the location of the GRB Rosen et al. 2005a ; 2005b . The deeper exposure in V placed a limiting magnitude for the source at (3 confidence level) for a total exposure of s co-added from a series of short exposures over the time span of s to s after the trigger. Due to the delayed slew of the satellite we cannot confirm whether this burst was intrinsically subluminous or had faded below the detection level of the UVOT. However, the optical counterpart for this burst was detected by several other facilities (see Table ), which argues for the case that it was merely too faint to be detected by the UVOT minutes post-burst.
2.1 X-ray Light curve and Spectral Analysis.
In the PC mode the XRT suffers from pile-up when the count-rate is counts s-1 Vaughan et al. (2005). To counter the effects of pile-up we extracted a series of grade spectra from the first ks of data using annuli of varying inner radii. These background corrected spectra were then fitted in XSPEC with an absorbed power law. We deem the point at which pile-up no longer affects our results to be when the power law index does not vary when the inner radius of the annulus is increased. For GRB 050505 this occurred when we excluded the inner pixels (radius). Data after ks were not piled up and therefore required no correction.
The X-ray light curve of GRB 050505 is shown in Fig and , with observations starting at ks after the trigger time and extending to ks. We characterise the behaviour of the XRT flux in terms of the standard power law indices . Thus a series of power law models were fit to the light curve data. The simplest model considered was a single power law of decay index . This model was rejected for GRB 050505 as it gave an unacceptable value of .
‘Broken’ and ‘doubly broken’ power laws were also fitted to the data. These models consist of two or three (respectively) power law sections whose slopes join but change instantaneously from to at the break times. A ‘broken’ power law model is also a poor description of the lightcurve ( ks) with . A ‘doubly broken’ power law provides a much better statistical fit to the data with ( improvement over both the simple and the broken power law). The model consists of a shallow decay, = , which breaks sharply at ks to a steeper decay of . The steeper decay breaks sharply again at ks into a yet more rapidly decaying index of .
A ‘smoothly broken’ power law was also fit to the data, it consists of two power law sections; however, the transition between these slopes is not instantaneous, but may spread over several decades in time:
| (1) |
where is the smoothing parameter, is the break time and is a normalisation constant. This produces a smooth break rather than a sharp break as in the previous models. Typically the values of the smoothing parameter, , reported in the literature range between , with a value of being favoured both observatonally and theoretically Stanek et al. (2005); Beuermann et al. (1999). A larger value of the smoothing parameter gives a sharper break. The light curve of GRB 050505 is well fit by a smoothly broken power law with . Unfortunately there is degeneracy between the smoothing factor and the initial decay index, with any value of between and producing a good fit to the data (limit of ). However, if we constrain the model parameters so that must have a positive value and that equals , the electron spectral index (calculated from our spectral index, , Zhang & Mészáros (2004)), then we find that a smoothing parameter in the range of is allowed. This range of smoothing factors produces . Restricting to we find , , ks and (see Fig ).


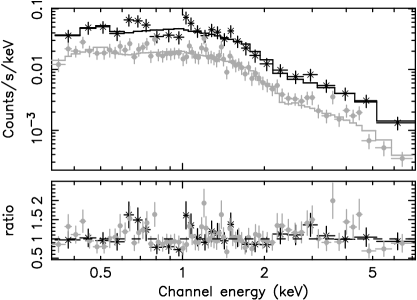
Spectral fits were performed over keV using grade events (as selected for the light curve analysis), binned to 20 counts per data point, individually for co-added data encompassing to ks and to ks, as well as the summed spectra for both intervals combined (see Table ).
The spectra were fit with a power law model (see Fig ) with the absorption, , set at the Galactic column density ( cm-2, Dickey & Lockman 1990), and with power law models with excess absorption (either in our Galaxy or the GRB host galaxy). During our analysis both Wisconsin and Tübingen-Boulder ISM absorption models Arnaud & Dorman (2003) were used; there was no significant difference in either the statistical quality of the fit or in the resulting derived parameters between the two. We present results obtained using the Tübingen-Boulder model using the local interstellar medium abundances of Anders and Grevesse Anders_1989 (1989) 444We also preformed spectral fits using the abundances of Wilms, Allen and McCray Wilms_2000 (2000) and found that they produced values that agreed, within errors, to those given by the Anders and Grevesse abundances..
It is clear from Table that there is no evidence for spectral change over the duration of the observations. This was confirmed by making a hardness ratio time series in the bands keV and keV, no variation was apparent. The fit to the total data-set reported in Table also shows that there is significant excess absorption in this spectrum (at confidence). Statistically both Galactic and extra-galactic absorption fits appear equally likely, however, if the excess absorption were to be due to gas in our Galaxy alone then the value of the excess absorption is almost twice the column density quoted by Dickey and Lockman Dickey_1990 (1990). Therefore, we conclude that the bulk component of excess absorption must come from the host galaxy with a value of = assuming local ISM abundances in the GRB rest frame.
The photon index , is typical of the photon indices seen in other GRB afterglows Nousek et al. (2005), even though we are sampling a higher range of spectral energies due to the high redshift of this burst. With a redshift of Berger et al. 2005a we are measuring the spectrum over a rest-frame range of keV. The spectrum is well modelled up to such high energies in the rest frame of the GRB, and the photon index is comparable to the values found from low redshift bursts.
| Modela | Co-added data for - ks | Co-added data for - ks | All data co-added | ||||||
|---|---|---|---|---|---|---|---|---|---|
| Photon | Excess | (DOF) | Photon | Excess | (DOF) | Photon | Excess | (DOF) | |
| index | ( cm-2) | index | ( cm-2) | index | ( cm-2) | ||||
| PL+Gal | - | (27) | - | () | - | () | |||
| PL+Gal+Abs | () | () | () | ||||||
| PL+Gal+ZAbs | () | () | () | ||||||
| z fixed at | |||||||||
3 Follow-Up Detections of GRB 050505.
The first reported detection of an optical counterpart for GRB 050505 was made by Cenko et al. 2005a observing from the Keck I telescope, quickly followed by a measurement of the redshift by the same collaboration Berger et al. 2005a . See Table for a summary of all of the optical observations reported on the GCN network as well as data from Faulkes Telescope North, reported here for the first time.
| Filter | Limiting mag. | Detected mag. | Duration (s) | Mid-point time (s) | Observatory | References |
|---|---|---|---|---|---|---|
| BOOTES - Very Wide Field Camera | Jelinek et al. 2005 | |||||
| TAROT | Klotz et al. 2005 | |||||
| TAROT | Klotz et al. 2005 | |||||
| TAROT | Klotz et al. 2005 | |||||
| AAVSO | Hohman et al. 2005 | |||||
| BOOTES - IR | de Ugarte Postigo et al. 2005 | |||||
| SARA | Homewood et al. 2005 | |||||
| - | 23006 | Keck | Berger et al. 2005b | |||
| - | 23006 | Keck | Berger et al. 2005b | |||
| - | UKIRT WFCAM | Rol et al. 2005 | ||||
| Faulkes Telescope North | this paper | |||||
| Faulkes Telescope North | this paper | |||||
| Faulkes Telescope North | this paper |
Unfortunately the initial spacecraft message sent to the GCN network erronously flagged this event as not a GRB, which consequently meant that the majority of robotic follow-up missions did not observe GRB 050505 promptly. The sparse nature of this combined data-set naturally limits the knowledge that can be obtained.
4 Discussion
4.1 Physical Origin of the Light curve Break
A doubly broken power law fit contains breaks at ks and ks in the observer’s frame, which translate to ks and ks in the rest frame of the burst. The amplitudes of these temporal breaks are and .
The combined BAT and XRT light curve (shown in Fig ) is consistent with the schematic diagram (fig of Nousek et al. 2005) of the canonical behaviour of Swift XRT early light curves. For GRB 050505 there is necessarily a steep decline from the bulk of the BAT emission to the early XRT emission, which would comprise the first power law segment identified by Nousek et al., the early flat slope of the XRT decay () would comprise the second segment of canonical decay and the second slope of the doubly broken power law fit () would comprise the third canonical segment. The BAT and XRT light curves are consistent with joining in the minute gap that separates them (see O’Brien et al. 2005), though this behaviour cannot be confirmed with the data we have available.
Light curve breaks can be caused by the passage through the X-ray band of the cooling frequency, the ending of continued shock energization, the presence of a structured jet or jet deceleration causing the relativistic beaming to become broader than the jet angle. We examine these possibilities here.
We can immediately rule out the presence of a cooling break for either break as this would result in and a change in spectral index Sari et al. (1998).
Either of the X-ray light curve breaks might represent the end of the energy injection into the forward shock of the relativistic outflow Nousek et al. (2005); Zhang et al. 2005 and references therein , given the lack of spectral variation (and presuming the emission before the break was dominated by the forward shock). However, the temporal placement of the first break makes it the more favourable of the two for this interpretation.
Nousek et al. (2005) consider that a shallow flux decay is caused by continuous energy injection into the forward shock either due to a decrease in the Lorentz factor of the outflow towards the end of the prompt emission or by long lasting central engine activity. The decreasing Lorentz factor () scenario requires that with , but Nousek et al. find, on the basis of their observed change in decay slope, when modelling the light curve with just a single broken power law, that for this burst (see their table ), thus disallowing this interpretation. However, our more detailed, multi-broken power law analysis shows that this scenario is valid for either of our breaks ( for both breaks) except when for a wind medium ( and for the first and second break respectively).
The long-lasting central engine activity scenario requires that the source luminosity decays slowly with time555 in the luminosity relation of Nousek et al. (2005) has been capitalised to prevent confusion with the power law index used by Panaitescu (2005a), with , with the average value found by Nousek et al. being of the order . The change in decay slope from their single broken power law model leads the authors to find for GRB 050505, which is consistent with the lower limit of this mechanism. However, this value of is unphysical as it requires the luminosity to increase with time. Our analysis shows that the long-lasting central engine activity scenario is valid (i.e. , with in the range to ), again for either of our breaks, as long as the X-ray frequency, , is above the cooling frequency, . We are unable to distinguish, in this case, whether a wind or homogenous cirumburst medium is favoured.
Another possible cause of either of the breaks in the light curve of GRB 050505 could be a structured jet outflow. In this case the ejecta energy over solid angle, , is not constant, but varies with the angle measured from the outflow symmetry axis Mészáros et al. (1998). Panaitescu 2005a suggests that since afterglow light curves are power laws in time can be approximated as a power law in (see their eqn 13), with a power law index of .
We assume a typical value of (the electron spectral index) to be (Gallant, Achterberg & Kirk 1999) and use the observed values of to calculate from eqns and of Panaitescu 2005a . This relation only applies when , where or . For GRB 050505 the observed values of give greater than , within errors, for both wind and uniform environments and for the observing frequency above or below the cooling frequency.
For , where falls off sufficiently fast that the afterglow emission is dominated by the core of the jet we expect (homogenous environment) or (wind environment) (Panaitescu 2005a). Thus a structured jet appears to be just consistent with both breaks. However, is too shallow to be explained by the spherical fireball model, unless the observer is located off the jet core. In this case the value of implies that our line of sight should be located exceptionally close to the edge of the core.

The signatures of a jet break, where the relativistic outflow from the GRB slows sufficiently that and the jet spreads laterally, are a temporal break with a typical amplitude of Rhoads (1999); Chevalier & Li (2000); Sari et al. (1999), no spectral variation Piran (2005) and a post-break decay index equal to , the electron spectral index Rhoads (1999). The relation of post-break is valid for , otherwise a different relation should be adopted Zhang & Mészáros (2004); Dai & Cheng (2001). There is no evidence for spectral variation during our observations (see Table 1). Unfortunately there were insufficent optical detections of this GRB pre- and post-break to confirm the presence of a jet break in other wavelengths at either epoch.
The temporal index of an X-ray light curve post-jet break should equal , the electron spectral index Rhoads (1999). We calculate from our measured spectral index, , that and , assuming that is above and below the cooling frequency, , respectively Zhang & Mészáros (2004); Sari et al. (1999). We measure a value of , which is not compatible with either value of , which rules out the first break being due to a jet break. However, which agrees, within the limits, to the case (). However, since may be , within the error range, we calculated the expected post-break slope from Dai and Cheng (2001; , ) giving an expected decay index of , which is also consistent with . With this value of we can constrain the jet break parameters further Rhoads (1999) and conclude that the amplitude of the second break is consistent with a value of 0.95, which is the value expected from optically thin synchrotron emission when , thus supporting the case that the second break is a jet break.
Having considered the various potential origins for the breaks in the light curve of GRB 050505 for the doubly broken model we conclude that the first break is due to the end of energy injection into the forward shock, i.e. that GRB 050505 fits with the canonical light curve model proposed by Nousek et al. (2005), and that the second break is due to a jet, either structured or uniform.
The ‘smoothly broken’ core-dominated power law provides a good fit to the XRT light curve data; however, the large degree of smoothing involved produces a degeneracy between the smoothing parameter, the first decay index and the break time. If we take the example case for (see Fig ), then a break is observed at ks in the observer’s frame. This translates to ks in the rest frame of the burst, with .
The magnitude of this break allows us to rule out a cooling break or the end of continued energy injection into the forward shock. A structured jet could explain the magnitude of this break if the observer is placed off the jet core (Panaitescu 2005b). This would then naturally explain the initial shallow decay index and the very smooth break. The magnitude of the break is also compatable with a jet break from optically thick synchrotron emission (). However, a break this early requires an unreasonably large circumburst density ( cm-3) to produce a value of (Ghirlanda et al. 2004), the true -ray energy released, that is comparable with the typical values of seen thus far Bloom et al. (2003). Thus the parameters of the smoothly broken power law model fit are inconsistent with all of the afterglow models considered here.
4.2 Multiwavelength Spectral Energy Distribution
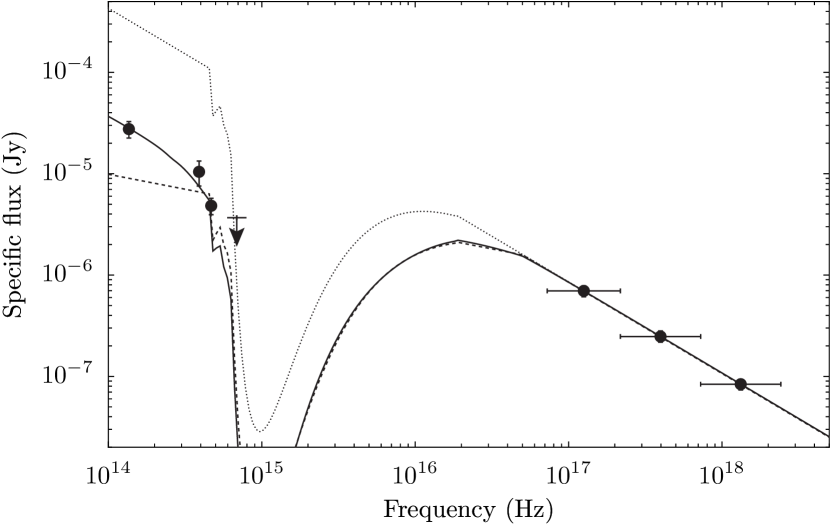
In Figure 6 we show the optical – X-ray spectrum of GRB 050505. The X-ray fluxes were obtained from a spectral fit between ks and ks after the bursts; the optical data (UKIRT band and the FTN data) were scaled to a common epoch, chosen to be the logarithmic average of the X-ray data ( ks). The magnitudes have been corrected for the estimated Galactic extinction using the dust maps by Schlegel et al. (1998), and have been converted to fluxes using the calibration provided by Fukugita et al. (1995) for the optical and that by Tokunaga and Vacca (2005) for the infra red magnitudes. Since all optical data were taken between the time of the two breaks, we have used the light curve decay index. However, the decay in the optical can be different. We tested several other values for the decay index (at most different from ), and found the resulting optical fluxes differ at most by (0.2 mag).
We fit the broad-band spectrum with two basic models, a power law and a broken power law, both accounting for the Lyman break (with the redshift fixed at ) and intrinsic host-galaxy extinction (also with the redshift fixed at ). The Lyman break has been modelled as described in Madau (1995); the optical/UV absorption has been modelled following Pei (1992). A single power law is excluded, even allowing for dramatic extinction in the host galaxy ( with the spectral index fixed at as determined from the X-ray data alone). A broken power law, with the high-frequency index also fixed at , results in a much better fit. We have applied variants of extinction: none, a Galactic-like extinction curve and an SMC-like extinction curve. The SMC-like extinction curve provides a good fit, resulting in the colour excess being and the low-frequency index ( confidence limits). The break frequency is largely unrestricted and was kept fixed at a value of Hz, although values of Hz and Hz are acceptable (with varying amounts of host-galaxy extinction). However, the low number of data points result in a relatively low , and shows a certain degeneracy: a Galactic-like extinction curve results in an equally good fit. This is mostly because the observed wavelength of the distinct Å feature666A strong increase in absorption is found for both the Milky Way and LMC around this wavelength, but is noticeably absent in the SMC (see e.g. Savage & Mathis, 1979). falls between our available photometry at this redshift, and the intrinsic extinction is almost entirely determined from the two and band points (the -band point being located on the edge of the Lyman break). The resulting values for a Galactic extinction curve are and ().
The difference between the two power law indices is . To obtain a better constraint for the break frequency, we have fixed the indices at and . This results in the cooling frequency being located between Hz and Hz (this is dependent on whether a Galactic or SMC extinction curve is used). The inferred is the same as before.
Our best fit results favour a cooling break between the optical and X-ray wavebands; in addition, a modest amount of host-galaxy extinction would be needed to explain our data fully, but no clear distinction between Galactic or SMC-like extinction can be made. A fit with SMC-like extinction, however, agrees marginally better with the expected for a cooling break.
Berger et al. (2005b) measured a Hydrogen column density of from the Ly absorption in their optical spectrum, and a metallicity of . We can therefore immediately rule out the Galactic like extinction. Fitting the X-ray spectrum with intrinsic absorption, setting all elements heavier than He to an abundance of , gives cm-2, ie , in addition to the Galactic absorption component. This host absorption is higher than the Hydrogen column directly measured by Berger et al. (2005b). It is unlikely that this difference is caused by an evolution of the dust and gas properties, since the timescales of the X-ray and optical observations are similar. A reconciliation of these results can in principle be achieved by ionisation in the host, however, the ionisation fraction required is too high as to be considered seriously.
The magnitude of the difference between these two hydrogen column densities is not easily explained. We estimate a 10% error in the Galactic in this direction. Setting the Galactic column density to 110% of its value does not reduce the excess Hydrogen column density in the rest frame of the burst sufficiently to reconcile the X-ray absorption with the value of Berger et al. (2005b). Nor can a difference in column densities of this magnitude be explained by remaining uncertanties in the XRT calibration.
We also performed a spectral fit allowing both Galactic and host values of to vary, rather than constraining the Galactic value to that given by Dickey & Lockman (1990), using the XSPEC STEPPAR command to explore the absorption column parameter space. The host absorption column still exceeded the value given by Berger et al. (2005b) at greater than 90% confidence. We speculate that that some curvature of unknown origin may be present in the X-ray spectrum.
From the Hydrogen column density, and using the relation between and for the SMC (Martin et al. 1989), we can infer . We note that this value is likely to be lower, with the metallicity being half of the estimated SMC ISM metallicity (Pei 1992). The inferred value is moderately in agreement with the we find from directly fitting the optical – X-ray spectrum with an SMC-like extinction curve (assuming ), although the Galactic extinction curve results in an extinction measurement which is equally well compatible with the inferred . This approximately agrees with as found by Berger et al. (2005b). Such a low extinction value is not uncommonly seen in GRB afterglows (e.g. Galama & Wijers 2001, Stratta et al. 2004).
4.3 Burst Properties
From the redshift of GRB 050505 () and the mean flux over the observed keV spectrum we calculate an isotropic equivalent radiated energy, , in the extrapolated keV rest frame energy range to be ergs, using the standard cosmology Spergel et al. (2003): km s-1 Mpc-1, () (), and a K-correction of .
If we take the second break in the light curve to be a jet break we are then able to calculate the properties of GRB 050505. Using the formulation of Frail et al. Frail_2001 (2001), and assuming that the efficiency of the fireball in converting the energy of the ejecta into -rays is , we obtain a range in from ( cm-3) to ( cm-3) Panaitescu et al. (2002). Frail et al. (2001) conclude that opening angles of are required for less than 10 per cent of the GRB sample. However, such a narrow beaming angle would not be unexpected for a high redshift burst as GRBs with wide jets would be too faint to be detected by current -ray missions.
From this we can calculate the beaming fraction Sari et al. (1999) to be between ( cm-3) and ( cm-3) and , the true -ray energy released, to be in the range of ( cm-3) to ergs ( cm-3) for a rest frame energy band of keV. We note that the typical of bursts thus far is ergs Bloom et al. (2003) with a burst-to-burst variance about this value of dex (or a factor of ), thus this burst agrees well with the typical value provided the circumburst density is of the order cm-3.
We found it useful to calculate from these values of via the Ghirlanda relation Ghirlanda et al. (2004) and compare these values to the observed lower limit of keV ( keV). We calculated that the Ghirlanda relation gave = keV (for cm-3) and keV (for cm-3), which agrees with the lower observed limit if the circumburst density is high. We also calculated via the Amati correlation Amati et al. (2002); Lloyd-Ronning & Ramirez-Ruiz (2002). Using equation of Ghirlanda et al. Ghirlanda_2005 (2005) for GRBs of known redshift gives keV, consistent with our observed limit.
5 Conclusions
We have presented multi-wavelength data for GRB 050505. Our earliest X-ray data starts minutes after the GRB trigger time as the Swift satellite was unable to slew to it immediately due to an Earth limb constraint. The X-ray light curve of GRB 050505 (see Figs and ) can be adequately fit with either a ‘smoothly broken’ or ‘doubly broken’ power law model.
The ‘smoothly broken’ power law model (see Fig ) favours a smoothing factor of (highly smoothed transition). This produces an initially shallow decay with , which breaks over several decades in time to a steeper slope, , of . () The values of the decay indices are poorly constrained but, assuming a smoothing parameter , then a break is observed at ks in the observer’s frame with . The magnitude of this break is inconsistent with all of the afterglow models considered here.
A ‘doubly broken’ power law model (see Fig ) consists of a shallow decay, , first detected at ks, followed by a break in the observer’s frame at ks and a steeper decay . This decay breaks sharply again at ks into a yet more rapidly decaying index of = , which continues until at least ks ().
We see no change in the X-ray spectral properties during Swift’s observations of this GRB. The best fit model parameters for the X-ray spectrum indicates that this burst has a typical photon index of and an excess absorption component from the host galaxy of () ().
Having considered the temporal position and amplitude of the two breaks in the doubly broken light curve we conclude that the first break is due to the end of energy injection into the forward shock Nousek et al. (2005); Zhang et al. 2005 and references therein , i.e. that GRB 050505 fits with the canonical light curve model proposed by Nousek et al. (2005), and that the second break is jet break caused by either a structured or uniform jet.
The optical – X-ray spectrum indicates that the cooling break is located between the optical and X-ray bands, as seen in many other GRB afterglows. A modest amount of intrinsic UV/optical extinction is required in addition, which for an SMC-like extinction law would result in . We note that a Galactic extinction law fits equally well, but the Solar metallicity inferred from the optical spectrum (Berger et al 2005b) shows it to be more SMC-like. Interestingly, the column density inferred from the X-ray spectrum with the metallicity set to is higher than that directly measured from the HI column.
The redshift of allowed us to calculate the intrinsic parameters for this GRB, in conjunction with the second light curve break time observed in Swift’s X-ray observations. The identification of this break with a jet break provides a value for that is in good agreement with respect to previous GRBs, provided that the circumburst density is of the order cm-3 and the values are consistent with the Ghirlanda Ghirlanda et al. (2004); Ghirlanda_2005 (2005) and Amati Amati et al. (2002); Lloyd-Ronning & Ramirez-Ruiz (2002) relations. It also suggests that GRB 050505 has a narrow beaming angle; however, this degree of beaming is not unexpected for GRBs at high redshift since GRBs with wider jets could potentially be too faint to be detected by any of the current -ray missions.
Acknowledgments
This work is supported at the University of Leicester by the Particle Physics and Astronomy Research Council (PPARC) and at Penn State by NASA contract NAS5-00136. The Faulkes Telescope North is supported by the Dill Faulkes Educational Trust. CPH gratefully acknowledges support from a PPARC studentship. VLP, MP and PR gratefully acknowledge ASI grant I/R/039/04. The authors acknowledge Iain Steele (LJMU) and Cristiano Guidorzi (LJMU) for their assistence with the FTN observations and Rhaana Starling (Univeristy of Amsterdam) for useful discussions. We are also grateful to the referee, Bruce Gendre, for his constructive and valuable comments.
References
- Amati et al. (2002) Amati L., et al., 2002, A&A, 390, 81.
- (2) Anders E. & Grevesse N. 1989, Geochimica et Cosmochimica Acta. 53, 197.
- Andersen et al. (2000) Andersen M. I., et al. 2000, A&A, 364, L54.
- Arnaud & Dorman (2003) Arnaud K. & Dorman B. 2003, XSPEC online manual.
- Barthelmy et al. (2005) Barthelmy S. D. et al. 2005, Space Science Review, 120, 143.
- (6) Berger E., et al. 2005a, GCN Circ. 3368.
- (7) Berger, E. et al. 2005b, in press (astro-ph/0511498).
- Beuermann et al. (1999) Beuermann K., et al. 1999, A&A, 352, L26.
- Bloom et al. (2003) Bloom J. S., Frail D. A. & Kulkarni S. R. 2003, ApJ, 594, 674.
- Burrows et al. (2005) Burrows D. N., et al. 2005, Space Science Review, 120, 165.
- (11) Cenko S. B., et al. 2005a, GCN Circ. 3366.
- (12) Cenko S. B., et al. 2005b, GCN Circ. 3377.
- (13) Chen, H. -W., Prochaska, J. X., Bloom, J. S. & Thompson, I. B. 2005, ApJ, 634, L25.
- Chevalier & Li (2000) Chevalier R. A. & Li Z. 2000, ApJ, 536, 195.
- Cusumano et al. (2005) Cusumano, G., et al. 2005, Nature, submitted (astro-ph/0509737).
- Dai & Cheng (2001) Dai Z. G. & Cheng K. S. 2001, ApJ, 558, L109.
- (17) Dickey & Lockman. 1990, ARAA, 28, 215.
- (18) Frail D. A. 2001, ApJ, 562, L55.
- (19) Fruchter A., Krolik J. H. & Rhoads J. E. 2001, ApJ, 563, 597.
- (20) Fukugita M., Shimasaku K. & Ichikawa T. 1995, PASP 107, 945.
- (21) Galama T. J. & Wijers R. A. M. J. 2001, ApJ, 549, L209.
- (22) Gallant Y., Achterberg A. & Kirk J. G. 1999, A&AS, 138, 549.
- Gehrels et al. (2004) Gehrels N., et al. 2004, ApJ, 611, 1005.
- Ghirlanda et al. (2004) Ghirlanda G., Ghisellini G. & Lazzati D. 2004, ApJ, 616, 331.
- (25) Ghirlanda G., Ghisellini G. & Firmani C. 2005, MNRAS, 361, L10.
- (26) Grazian, A., et al. 2006, GCN Circ. 4545.
- Hjorth et al. (2003) Hjorth J., et al. 2003, Nature, 423, 847.
- Hohman, Henden & Price (2005) Hohman D., Henden A. & Price A. 2005, GCN Circ. 3370.
- Homewood, Hartmann & Wood (2005) Homewood A., Hartmann D. H., & Wood M. 2005, GCN Circ. 3398.
- Hullinger et al. (2005) Hullinger D., et al. 2005, GCN Circ. 3364.
- Hurkett et al. (2005) Hurkett C. P., et al. 2005, GCN Circ. 3360.
- Jelinek et al. (2005) Jelínek M. et al. 2005, GCN Circ. 3373.
- Kawai et al. (2005) Kawai, N. et al. 2005, GCN Circ. 3937.
- Kennea et al. (2005) Kennea J. A., Burrows D. N., Hurkett C. P., Osborne J. P. & Gehrels N. 2005, GCN Circ 3365.
- Kippen (2000) Kippen R. M. 2000, GCN Circ. 530.
- Klotz, Boer & Atteia (2005) Klotz A., Boer M. & Atteia J. L. 2005, GCN Circ. 3403.
- Lamb & Reichart (2000) Lamb D. Q. & Reichart D. E. 2000, ApJ, 536, 1.
- Lloyd-Ronning & Ramirez-Ruiz (2002) Lloyd-Ronning N. M. & Ramirez-Ruiz E. 2002, ApJ, 576, 101.
- (39) Madau P. 1995, ApJ, 441, 18.
- (40) Malesani, D., et al. 2006, GCN Circ. 4541.
- (41) Martin, N., Maurice, E. & Lequeux, J. 1989, A&A, 215, 219.
- Mészáros et al. (1998) Mészáros P., Rees M. J. & Wijers R. 1998, ApJ, 499, 301.
- (43) Moretti, A., et al. 2005, A&A, submitted (astro-ph/0511604).
- Nousek et al. (2005) Nousek J. A., et. al. 2005, ApJ, accepted (astro-ph/0508332).
- O’Brien et al. (2005) O’Brien P. T. et al. 2005, ApJ, submitted (astro-ph/0601125).
- Panaitescu et al. (2002) Panaitescu A. & Kumar P. 2002, ApJ, 571, 779.
- (47) Panaitescu A. 2005a, MNRAS, 362, 921.
- (48) Panaitescu A. 2005b, MNRAS, 363, 1409.
- (49) Pei Y. C. 1992, ApJ, 395, 130.
- Piran (2005) Piran T. 2005, Rev. Mod. Phys. 76, 1143.
- (51) Predehl, P. & Schmitt, J. H. M. M. 1995, A&A, 293, 889.
- Preece et al. (2000) Preece R. D, Briggs M. S., Mallozzi R. S., Pendleton G. N., Paciesas W. S. & Band D. L. 2000, ApJS, 126, 19.
- Rhoads (1999) Rhoads J. E. 1999, ApJ, 525, 737.
- Rol et al. (2005) Rol E., et al. 2005, GCN Circ. 3372.
- Roming et al. (2005) Roming P. W. A., et al. 2005, Space Science Review, 120, 95.
- (56) Rosen S., et al. 2005, GCN Circ. 3367.
- (57) Rosen S., et al. 2005, GCN Circ. 3371.
- Sari et al. (1998) Sari R., Piran T. & Narayan R. 1998, ApJ, 497, L17.
- Sari et al. (1999) Sari R., Piran T. & Halpern J. P. 1999, ApJ, 519, L17.
- (60) Savage, B. D. & Mathis, J. S. 1979, ARA&A, 17, 73.
- (61) Savaglio, S. & Fall, S. M. 2004, ApJ, 614, 293.
- (62) Schlegel, D. J., Finkbeiner, D. P. & Davis, M. 1998, ApJ, 500, 525.
- Spergel et al. (2003) Spergel et al. 2003, ApJS, 148, 175.
- Stanek et al. (2003) Stanek K. Z., et al. 2003, ApJ, 591, L17.
- Stanek et al. (2005) Stanek K. Z., et al. 2005, ApJ, 626, L5.
- (66) Starling, R. L. C. et al. 2005, A&A, 442, L21.
- (67) Stratta, G. et al. 2004, ApJ, 608, 846.
- (68) Tagliaferri G., et al. 2005, A&A, 443, L1.
- Tinney et al. (1998) Tinney C., et al. 1998, IAU Circ. 6896.
- (70) Tokunaga, A. T. & Vacca, W. D. 2005, PASP, 117, 421.
- de Ugarte Postigo et al. (2005) de Ugarte Postigo A., et al. 2005, GCN Circ. 3376.
- Vaughan et al. (2005) Vaughan S., et al. 2005, ApJ, accepted (astro-ph/0510677).
- Vreeswijk et al. (2004) Vreeswijk P. M., et al. 2004, A&A 419, 927.
- Watson et al. (2005) Watson, D., et al. 2005, ApJL, accepted (astro-ph/0509640).
- (75) Wilms J., Allen A., & McCray R. 2000, ApJ, 542, 914.
- Zhang & Mészáros (2004) Zhang B. & Mészáros P. 2004, IJMPA, 19, 2385.
- (77) Zhang B., et al. 2005, accepted (astro-ph/0508321).