Dynamics and High Energy Emission
of the Flaring HST-1 Knot in the M 87 Jet
Abstract
Stimulated by recent observations of a giant radio-to-X-ray synchrotron flare from HST-1, the innermost knot of the M 87 jet, as well as by a detection of a very high energy -ray emission from M 87, we investigated the dynamics and multiwavelength emission of the HST-1 region. We study thermal pressure of the hot interstellar medium in M 87 and argue for a presence of a gaseous condensation in its central parts. We postulate that this additional feature is linked to the observed central stellar cusp of the elliptical host. Interaction of the jet with such a feature is likely to result in formation of a stationary converging/diverging reconfinement/reflected shock structure in the innermost parts of the M 87 jet. We show that for a realistic set of the outflow parameters, a stationary and a flaring part of the HST-1 knot located pc away from the active center can be associated with the decelerated portion of the jet matter placed immediately downstream of the point where the reconfinement shock reaches the jet axis. We discuss a possible scenario explaining a broad-band brightening of the HST-1 region related to the variable activity of the central core. In particular, we show that assuming a previous epoch of the high central black hole activity resulting in ejection of excess particles and photons down along the jet, one may first expect a high-energy flare of HST-1 due to inverse-Comptonisation of the nuclear radiation, followed after a few years by an increase in the synchrotron continuum of this region. The synchrotron flare itself could be accompanied by a subsequent inverse-Compton brightening due to upscattering of the ambient (mostly starlight) photons. If this is the case, then the recently observed order-of-magnitude increase in the knot luminosity in all spectral bands could be regarded as an unusual echo of the order-of-magnitude outburst that had happened previously (and could be eventually observed some years ago) in the highly relativistic active core of the M 87 radio galaxy. We show that very high energy -ray fluxes expected in a framework of the proposed scenario are consistent with the observed ones.
keywords:
radiation mechanisms: non-thermal — shock waves — galaxies: active — galaxies: jets — galaxies: individual (M 87)1 Introduction
A kiloparsec-scale jet in M 87, the giant elliptical radio galaxy in Virgo cluster — the very first extragalactic jet ever discovered (Curtis, 1918) — provides us with an exceptional laboratory for studying physics of relativistic collimated outflows. This is because its proximity ( Mpc, 1 arcsec = 78 pc) allows for observations of the jet and of ambient medium at different frequencies, with a very high spatial resolution. This jet has in fact been studied in great detail in all wavelengths. One of the most remarkable features of this jet is the inner HST-1 knot region, observed at about 60 pc from the active core (Biretta et al., 1999; Perlman et al., 2003; Harris et al., 2003, 2006). Complexity of this innermost part of the outflow, which consists of stationary and superluminal sub-components, as well as its uniquely variable broad-band emission, calls for an explanation. Here we investigate the properties of HST-1 knot and present an attempt to provide such an explanation.
Below we summarize observational constraints on the physics of the M 87 jet in general. Next, in section 2, we investigate properties of the ambient medium necessary for understanding the dynamics of the jet. We argue that the enhanced thermal pressure connected with a stellar cusp in the innermost parts of the host galaxy is likely to form a stationary converging/diverging reconfinement/reflected shock structure in the jet. In section 3, we conclude that indeed the stationary and flaring upstream edge of HST-1 knot can be associated with the decelerated portion of the jet matter placed immediately downstream from the point where the reconfinement shock reaches the jet axis. The presented interpretation gives us a framework in which one can model the broad-band emission of this part of the jet, and its high energy -ray emission in particular. In section 4, we present an evaluation of the radiation fields at the position of HST-1 knot. We find that the energy density of the starlight and of the nuclear emission can be comparable to the energy density of the equipartition magnetic field in this jet region. This means that the high energy -ray inverse-Compton emission of HST-1 knot’s flaring point should be expected at the (very roughly) similar level as its observed radio-to-X-ray synchrotron emission. Since the latter one has recently increased significantly up to erg s-1 (Harris et al., 2006), the expected TeV flux from HST-1 knot should then be promisingly comparable to the one detected from the M 87 system (Aharonian et al., 2003; Beilicke et al., 2005). This issue is investigated further in section 5. There we present a possible scenario relating variable emission of the HST-1 knot/reconfinement nozzle with a modulated activity of the relativistic central core. In particular, we show that assuming the previous epoch of the high nuclear activity of a central black hole, resulting in ejection of excess particles and photons down along the jet, one may expect first a high-energy flare of HST-1 due to inverse-Compton scattering of the nuclear radiation, followed a few years later by an increase in the synchrotron continuum emission of this region. Interestingly, the predicted -ray fluxes (assuming energy equipartition between radiating electrons and the jet magnetic field) are consistent with the observed ones. Final summary and conclusions from our study are presented in the last section 6.
1.1 M 87 Jet
Very Long Baseline Interferometry observations reported by Junor et al. (1999) show a presence of a very broad radio-emitting limb-brightened outflow close ( parsec) to the M 87 center, characterized by an opening angle of . This outflow experiences a strong collimation at the projected distance equivalent to (Schwarzschild radii) from the central supermassive black hole (hereafter ‘SMBH’), i.e., with the appropriate conversion arcsec pc, at the distance of mas pc. The collimation continues out to pc from the center, where the jet adopts an opening angle that remains roughly stable further away from the core. A detection of synchrotron self-absorption features in the radio spectrum of the M 87 nuclear region allowed the placement of an upper limit on the jet magnetic field G at pc (Reynolds et al., 1996). Recently, by modeling a turn-over frequency along the jet in the radio spectra, Dodson et al. (2005) found G for mas pc, and G further away along the jet.
The bright components of the radio jet placed at pc from the jet base are characterized by no, or some sub-relativistic proper motions, (Junor & Biretta, 1995; Dodson et al., 2005). Further out along the jet, the knots detected at several pc from the core (e.g., the knot L placed at pc) are also sub-luminal, however with slightly larger apparent velocities (Reid et al., 1989; Biretta et al., 1999). Surprisingly, several knots placed even further out () occurred to be highly superluminal, with reaching . In particular, Hubble Space Telescope observations reported by Biretta et al. (1999) showed that the unresolved stationary feature upstream of the HST-1 knot (at pc) seems to emit various components down the jet, both slow and fast, with the maximum apparent velocity of . Also, all the components of knot D ( pc) are superluminal, with . Finally, knot E placed at pc from the core is characterized by a relatively high velocity of . All the measured superluminal features, if interpreted as moving blobs, suggest the bulk Lorentz factor for the portion of the jet larger than , and the jet viewing angle less than (Biretta et al., 1999). (With all the projected distances along the jet cited in this section should be multiplied by a factor of .)
A stationary feature placed at the upstream edge of HST-1 knot has been flaring in the optical and X-rays since 2002. The results of Very Large Array, Chandra X-ray Observatory and Hubble monitoring programs presented by Harris et al. (2003) and Perlman et al. (2003) established month-to-year variability of its radio-to-X-ray synchrotron continuum, with a comparable amplitude over the entire broad waveband. The HST-1 knot is unresolved by Hubble, indicating its spatial dimension smaller than pc. The equipartition magnetic field at the position of this knot, when evaluated at the quiescence state and neglecting corrections due to expected relativistic bulk velocity of the radiating plasma, is of the order of G. Magnetic field lines thereby are predominantly perpendicular to the jet axis, as suggested by polarization studies (Perlman et al., 2003). The degree of the linear polarization decreases from upstream of the HST-1 flaring region ( pc), to at the position of the flux maximum ( pc), and then to downstream of it ( pc). The most recent data show that until the year 2005 the X-ray emission of HST-1 knot increased by as much as a factor of (Harris et al., 2006).
At the distance pc away from the center the jet brightens significantly, forming a prominent knot (knot A) followed by the subsequent knots (B and C), to disappear at approximately kpc into an amorphous radio lobe visible at low radio frequencies (Owen et al., 2000). VLA studies indicate subluminal apparent velocities of these outer jet components, with (Biretta et al., 1995). The kpc-scale jet, when observed in radio, exhibits filamentary limb-brightened morphology (Owen et al., 1989). Both its optical and X-ray emissions are synchrotron in origin, similar to the inner parts of the outflow (Biretta et al., 1991; Meisenheimer et al., 1996; Sparks et al., 1996; Perlman et al., 1999, 2001; Marshall et al., 2002; Wilson & Yang, 2002). All along the jet the radio-to-optical power-law slope is , while the optical-to-X-ray one with the exception of HST-1 knot, for which (Perlman & Wilson, 2005; Waters & Zepf, 2005). This indicates a general ‘broken power-law’ character of the broad-band synchrotron spectrum along the M 87 jet. As discussed in Stawarz et al. (2005), the kpc-scale jet’s magnetic field is not likely to be lower than G.
HEGRA Cherenkov Telescopes System detected the M 87 emission with the photon flux of cm-2 s-1 (Aharonian et al., 2003). Assuming a spectral index for the observed emission , this corresponds to the isotropic of luminosity erg s-1. The observations were taken in the period 1998-99, when the HST-1 flaring region was in its quiescence epoch. Different scenarios were proposed to account for the detected TeV signal, including various versions of modeling M 87 active nucleus (‘misaligned’ and ‘structured’ BL Lac; Bai & Lee, 2001; Reimer et al., 2004; Ghisellini et al., 2005; Georganopoulos et al., 2005), but also a high energy emission of the M 87 host galaxy (Pfrommer & Ensslin, 2003) or of the kpc-scale jet (of its brightest knot A in particular; Stawarz et al., 2003). The evidence for a year-timescale variability established by the subsequent Whipple and H.E.S.S. observations (Le Bohec et al., 2004; Beilicke et al., 2005), indicating a likely decrease of the TeV signal from M 87 from 1999 till 2004 by about an order of magnitude (down to erg s-1), excludes the later two possibilities, imposing however interesting constraints on the kpc-scale jet magnetic field intensity (Stawarz et al., 2005). At the same time, synchrotron radio-to-X-ray emission of the HST-1 flaring region increased by more than an order of magnitude (see Harris et al., 2006).
2 Host Galaxy Emission Profiles
Chandra studies presented by Young et al. (2002) demonstrate that the X-ray surface brightness of Virgo A cluster (centered at the position of M 87 radio galaxy) is of the modified King profile , with the parameter and the critical radius . This implies a density profile of the X-ray emitting hot gas , i.e. for (see, e.g., Sarazin, 1986). Both the temperature and the abundance of this gas decrease smoothly toward the cluster center, reaching at values of keV and , respectively (Böhringer et al., 2001). It is not clear if the abundance decrease is real, or only apparent, caused by resonant line scattering (but see Gastaldello & Molendi, 2002). However, even with this ambiguity, one can conclude from the X-ray observations that the number density of hot thermal electrons in the M 87 host galaxy decreases from cm-3 at to cm-3 at from the active core (Young et al., 2002; Di Matteo et al., 2003). All of these constraints are in agreement with a general finding that the central electron number density in giant ellipticals is typically cm-3, and declines as with the distance from their cores (Mathews & Brighenti, 2003). Unfortunately, even with the excellent spatial resolution of Chandra the thermal gas X-ray emission profile cannot be probed precisely in the innermost portions of M 87, , because of numerous X-ray emission features there (see Feng et al., 2004). As argued below, one can instead use the optical observations to constrain the parameters of this gaseous medium.
Optical observations of M 87 reported by Young et al. (1978) indicate that the modified isothermal sphere model (usually applied to elliptical galaxies) is inconsistent with the observed starlight emission profile for the projected radii of . In particular, they showed a presence of a central luminosity excess, explained by Young et al. (1978) in terms of a dynamical effect of a SMBH placed at the center of the galaxy on its stellar neighborhood. Hubble observations (Lauer et al., 1992) confirmed the presence of this additional stellar component in agreement with the interpretation involving SMBH strongly bounding nearby stars and creating a central stellar cusp with an increased stellar velocity dispersion (in this context see also Dressler & Richstone, 1990; Macchetto et al., 1997). The observed optical (starlight) surface brightness profile of the host galaxy is therefore described by with for and for , and composed of two separate components, namely a central cusp with the luminosity density pc-3 (in the filter for ), and a modified King profile with the curvature radius and a tidal radius . The later component is consistent with a general property of the elliptical galaxies, namely (Silva et al., 1998).
As discussed in Young (1980), in the case of the adiabatic growth of a central SMBH (i.e., the growth at a rate slower than the dynamical time scale of the stellar cluster but faster than the relaxation time scale), the expected density profile of stars follows a power law, with (see also van der Marel, 1999). Hence, the expected starlight brightness profile for the adiabatic stellar cusp is , i.e. much steeper than the one observed in M 87. However, as noted by Lauer et al. (1992), the behavior discussed by Young et al. (1978) is in fact an asymptotic one, holding for , while in the outer regions of a cusp an expected profile should be flatter, similar to observed in M 87. This central stellar cusp profile joins smoothly with the galactic starlight profile at further distances from the core, implying a stellar density dependence of . Note that Hubble observations (Lauer et al., 1995; Faber et al., 1997) of elliptical galaxies show that they never possess a homogeneous surface brightness distribution expected in the case of a pure King-like profile, but they can be divided into two classes: (i) the ‘core type’ galaxies with the brightness profile described by a broken power law with and within some critical (break) radius (in M 87 case ), and (ii) the ‘power-law type’ galaxies characterized by a single value of within the whole central region. As noted recently by de Ruiter et al. (2005), radio loud galaxies are always of the ‘core type’, although not every ‘core type’ galaxy is radio loud. Also, the break radius is proportional to the galactic luminosity, roughly . One can therefore suspect the presence of an additional thermal pressure component within the host galaxies of radio-loud AGNs, ‘matching’ the central stellar cusps.
Our main assumption follows from the observational fact reported by Trinchieri et al. (1986), that the optical and X-ray surface brightness profiles for three bright Virgo A ellipticals are almost identical, i.e. that . Since the starlight emissivity is proportional to the number density of the stars, while the X-ray (bremsstrahlung) emissivity is proportional to the square of the hot gas number density, one obtains . This result was considered by Mathews & Brighenti (2003) as a general property of elliptical galaxies. Indeed, in the case of M 87 host galaxy, at the distances one observes leading to , and at the same time leading to (see above). This is in a good agreement with the expected behavior . Therefore, hereafter we also assume that in the inner parts of M 87 the distribution of the hot thermal gas (i.e. of the pressure) follows closely the distribution of the stars (i.e. of the mass). We also assume for simplicity a constant temperature of the hot gas keV within (see Di Matteo et al., 2003), leading to the pressure profile simply proportional to the gas density profile, , i.e.
| (3) |
with the normalization dyn cm-2 (Young et al., 2002). Here pc, and kpc. The resulting distribution of the gas pressure is shown in Figure 1. One can see that the gas pressure decreases from dyn cm-2 at pc up to dyn cm-2 at kpc. In addition, the pressure profiles adopted by Falle & Wilson (1985) and Owen et al. (1989) in their studies of the M 87 jet are shown for comparison. The former one is dyn cm-2, while the latter one is dyn cm-2 between and kpc, and dyn cm-2 for kpc. Note that these two approximations imply a lower gas pressure than the one adopted by us.
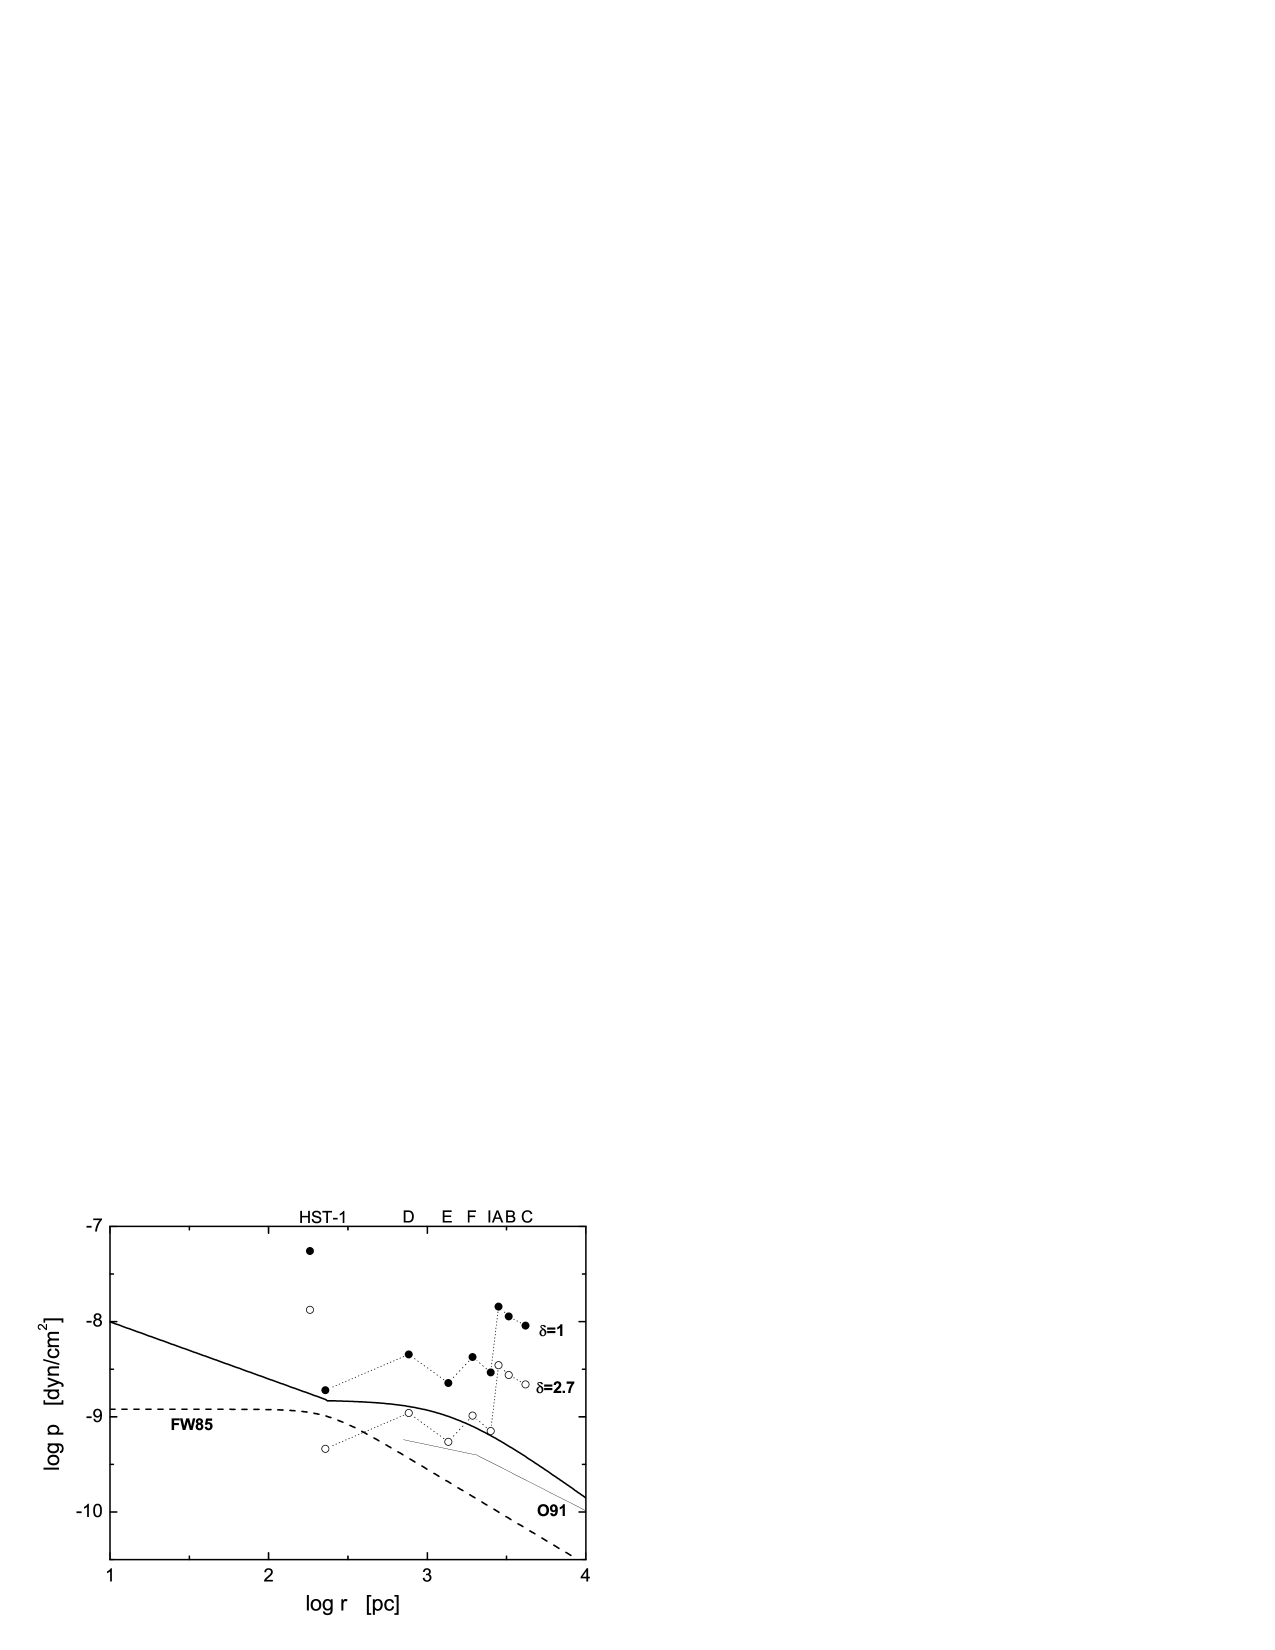
Figure 1 shows the de-projected positions of different knots (starting from HST-1 up to C) of the M 87 jet111Knot HST-1: , knot D: , knot E: , knot F: , knot I: , knot A: , knot B: , knot C: . assuming the jet viewing angle (Bicknell & Begelman, 1996; Heinz & Begelman, 1997), and the minimum pressure of these knots (a sum of the pressure due to ultrarelativistic radiating electrons and due to the tangled magnetic field),
| (4) |
(see Kataoka & Stawarz, 2005, and Appendix B). Here is the observed radio flux of the knot at GHz, is its observed knot’s radius (assuming spherical geometry), and is the knot’s Doppler factor. In Figure 1 we consider two jet’s Doppler factors: and . The later one is appropriate for the expected jet viewing angle and the jet bulk Lorentz factor on kpc scales (Bicknell & Begelman, 1996; Heinz & Begelman, 1997). We also took (except the HST-1 flaring region, i.e., the upstream edge of HST-1 knot disconnected from the other knots in Figure 1, for which we assume ) and used the knots’ GHz fluxes given by Perlman et al. (2001)222Knot HST-1 (total): mJy, knot D: mJy, knot E: mJy, knot F: mJy, knot I: mJy, knot A: mJy, knot B: mJy, knot C: mJy.. For the flaring region of HST-1 knot we took the GHz flux of mJy, as given in Harris et al. (2003) for the quiescence epoch of this part of the jet. Note, that the first bright knot HST-1 is placed very close to , i.e. the radius where the change in the ambient pressure profile between the central cusp and the unperturbed King-like distribution is expected to occur. In addition, downstream of this region, for , the M 87 jet is overpressured in respect to the gaseous medium by a factor of a few, and even by more than an order of magnitude at the position of the brightest knot A further away. However, with the beaming effects included, the minimum pressure of the knots D, E, F and I is almost the same as the ambient medium pressure. Note also that the HST-1 flaring region is highly overpressured.
An additional gaseous X-ray condensation in the center of M 87 host galaxy, linked to the observed in optical stellar cusp, increases a thermal pressure of the galactic medium (with respect to the ‘pure’ King-like profile) by as much as an order of magnitude at the distance pc from the core. On the other hand, a small volume occupied by this additional component implies only a small excess X-ray thermal luminosity. Figure 2 shows this light increase in the X-ray surface brightness profile. We calculate the X-ray surface brightness of host galaxy with and without this central component. Because the bremsstrahlung emissivity is proportional to the square of the thermal gas density, the appropriate surface brightness, as a function of the projected distance from the nucleus , is
| (5) |
where and kpc (Lauer et al., 1992). We assumed a constant temperature of the gaseous medium within the galaxy, and took the pressure profile as given by equation 1 with and without the central cusp. As shown in Figure 2, the additional central component increases only slightly the X-ray surface brightness, in particular by a factor of within pc.

Interestingly, Hardcastle et al. (2002) reported larger, by a factor of two, number of counts from a thermal X-ray halo surrounding the central regions ( pc) of FR I radio galaxy 3C 31 than the number of counts expected from the pure model fitted to the entire 3C 31 host galaxy profile. We believe that this excess can be related to a condensation of the hot interstellar medium in the central parts of the host galaxy, as discussed above. In the case of the M 87 source, however, it would be difficult to claim a presence of an analogous feature at pc based on the available Chandra data, due to extremely complicated M 87 X-ray structure consisting of gaseous rings, voids, as well as due to strong non-thermal keV emission of the jet itself (see Feng et al., 2004; Di Matteo et al., 2003). Because of such complexity, the thermal pressure profile proposed above should be really considered as a simple approximation only. For the purpose of the analysis presented below, it is however accurate enough.
Let us note, that the spatial scale for the postulated here central gaseous condensation is very small when compared to the scale of the M 87 radio lobes. Thus, its presence does not contradict with widely discussed disruption of cooling-flow atmospheres by kpc-scale radio outflows (see, e.g., Bicknell & Begelman, 1996, for the particular case of M 87 source). In fact, the sound-crossing time over the region with the spatial scale is less than Myr (for the interstellar medium parameters as considered in this section), i.e. less than the lifetime of the inner lobes in the M 87 radio galaxy (Bicknell & Begelman, 1996), suggesting relatively short timescale for formation/regeneration of the central gaseous cusp.
3 HST-1 Knot as a Reconfinement Shock
We do not intend to explain here the observed gradual collimation of the M 87 jet in its innermost parts. Instead we note that the initial collimation of the broad nuclear outflow may be due to a dynamically dominating magnetic field (Gracia et al., 2005), as the jets in active galactic nuclei are most likely launched by the magnetohydrodynamical processes. On the other hand, a dominant electromagnetic jet flux should be converted at some point to the particle flux, since the large-scale jets seem to be rather particle dominated (see a discussion in Sikora et al., 2005). Let us therefore speculate, that at sufficiently large distance from the nucleus — where the initial collimation is completed — the relativistic jet in the M 87 radio galaxy is already particle dominated, and starts to expand freely. In such freely expanding jet, the pressure decreases very rapidly with the distance, , from the core. For example, in the case of cold jet matter the thermal pressure goes as for (Sanders, 1983). At the same time, the ambient gas pressure decreases much less rapidly: above we argue that in the M 87 galaxy one has with for pc. Hence, as , accordingly to the discussion in Komissarov & Falle (1997), the initially free jet in M 87 certainly (i) will become reconfined at some point , (ii) will develop a reconfinement shock at its boundary, possibly leading to limb-brightenings of the reconfining outflow, and moreover (iii) the converging reconfinement shock will reach the jet axis at some further position along the jet, , beyond which the whole jet itself will come to a pressure equilibrium with the external gas medium. A simple evaluation of the reconfinement shock parameters is presented in Appendix A for the cases of the jet matter described by a non-relativistic equation of state (hereafter ‘cold jet’), as done previously in Komissarov & Falle (1997) (see also in this context Sanders, 1983; Falle & Wilson, 1985; Wilson & Falle, 1985; Wilson, 1987; Falle, 1991; Komissarov, 1994), and also for an ultrarelativistic equation of state (hereafter ‘hot jet’).
At what distance from the M 87 nucleus, , does the jet reconfinement start? Reid et al. (1989) noted that at the projected distance pc from the core the jet radio morphology (opening angle, transverse intensity profile) changes. Further out, beyond pc, the jet brightness drops below the detection level, and then increases again at pc forming a weak radio knot L. Beyond this knot, the jet radio brightness decreases again, until pc where a very bright knot, HST-1 appears (see section 1). Bearing in mind all the difficulties and uncertainties present in measurements regarding detailed morphology of the nuclear jet radio structure, we conclude that it is reasonable to identify with the jet region between and (i.e. pc) from the M 87 center, and to assume that the jet thereby is already relativistic and particle dominated. Indeed, the initial — hydromagnetic by assumption — collimation of a broad nuclear outflow seems to be already completed at smaller distances from the core. Giannios & Spruit (2006) argue that the Poynting-flux dominated nuclear outflows in AGNs become kinetic flux dominated at distances , i.e., in the case of M 87 radio galaxy, at about pc projected (for ), in agreement with our assumption.
With , one should expect the reconfinement shock to reach the jet axis at projected distance from the center in the case of a cold jet, or at in the case of a hot jet (see Appendix A). In other words, if the jet at is dynamically dominated by cold particles, is expected to roughly coincide with the knot L, while for the ultrarelativistic jet matter — consisting of (mildly) relativistic particles plus magnetic field — should rather be identified with the HST-1 complex. Again, noting all the rough approximations used by us to derive and , below we argue that the latter interpretation is more likely. When the reconfinement shock reaches the jet axis, converging supersonic flow downstream of the reconfinement shock is expected to create the second stationary ‘reflected’ shock. This reflected shock is in turn diverging from the jet axis along the outflow, starting from (Komissarov & Falle, 1997). The jet pressure immediately beyond is therefore expected to be higher than the ambient medium pressure. This is qualitatively consistent with what is presented in Figure 1 for the HST-1 complex. Therefore we postulate that the extremely compact and overpressured HST-1 flaring point, present at the very beginning of the HST-1 complex, is placed at (thus favoring hot jet scenario), while the outer parts of the HST-1 complex — superluminal features characterized by the minimum pressure in rough equilibrium with the surrounding medium (see Figure 1) — can be identified with the region occupied by a diverging reflected shock further away from .

For a given , where pc is the projected distance of the HST-1 flaring region and is the jet viewing angle, plus the adopted ambient pressure profile with and dyn cm-2, kinetic power of the jet implied by the model is
| (6) |
(see Appendix A). The evaluated is shown in Figure 3 for different jet viewing angles. Note that for the implied luminosity is erg s-1, consistent with the jet power required to feed radio lobes (Bicknell & Begelman, 1996; Owen et al., 2000). Figure 3 presents also the jet kinetic power implied by the reconfinement shock position at pc (projected distance of the knot L), i.e. the location preferred in the cold jet scenario. In this case is an order of magnitude lower.
Previously, reconfinement shocks in FR I jets were proposed to be placed at much larger distances from the central engines, namely at the position of the brightest knots kpc from active nuclei (Laing & Bridle, 2002)333For a possibility of stationary reconfinement shocks in the small-scale jets of blazar sources see, e.g., Jorstad et al. (2001).. In the case of the M 87 jet it would be then at knot A (Falle & Wilson, 1985). In fact, it is possible that beyond HST-1 complex () the M 87 jet breaks free again, and forms another reconfinement shock around , i.e. exactly at the position of knot A. On the other hand, knots beyond HST-1 complex were successfully explained by Bicknell & Begelman (1996) as oblique shocks formed by helical modes of Kelvin-Helmholtz instabilities characterized by a growing amplitude along the jet, disrupting finally the outflow near knot C (see also in this context Lobanov et al., 2003). For our following analysis, the discussion on the dynamics of the kpc-scale parts of the M 87 jet, beyond HST-1 is, however, not crucial.
4 Photon Fields
We evaluate energy densities of the ambient radiation fields along the jet axis, as measured in the rest frame of M 87 host galaxy at different distances from the center. First, we note that the optical starlight emission is dominated by photons at frequencies of Hz (Müller et al., 2004), and that its emissivity profile is expected to follow the galactic mass (i.e., star) distribution. Hence, the emissivity is in a form
| (9) |
with erg s-1 cm-3, corresponding to the -band galaxy luminosity (see section 2). We integrate equation 5 along a ray and a solid angle with (see Stawarz et al., 2005) to obtain a profile of the starlight photons energy density for M 87, , shown in Figure 4. Note that at distances kpc it is roughly constant with erg cm-3. We can also evaluate the energy density of the X-ray photons for the observed X-ray emission of the hot gas with the temperature keV in M 87. We note that the bremsstrahlung emissivity is simply proportional to the square of the gas number density, , and hence, with the assumed constant gas temperature, to the square of the gas pressure, . By using the gas pressure profile given in the equation 1, and integrating along a ray and a solid angle with the cluster termination radius Mpc, we obtain a distribution of the X-ray photons energy density, , shown in Figure 4. Within the first kpc from the core the energy density of the thermal X-ray photons is higher than the energy density of the cosmic microwave background (CMB) photons, erg cm-3.
Energy density of the diffused radiation from stars and hot interstellar medium can be compared with the energy density of the synchrotron emission produced within each knot of the M 87 jet. As discussed in section 1, synchrotron emission of the knots is peaked at optical frequencies. Thus, in order to evaluate the energy density of the synchrotron photons within the jet, we take the optical fluxes measured at Hz by Perlman et al. (2001) for all the knots444Knot D: Jy, knot E: Jy, knot F: Jy, knot I: Jy, knot A: Jy, knot B: Jy, knot C: Jy., except of the HST-1 flaring point, for which we take Jy, as given in Harris et al. (2003), corresponding to its quiescence epoch. We also assume a spherical geometry for the emission regions, with the radius in the case of the knot HST-1 (considering only its flaring component) and for the others. Figure 4 illustrates the resulting energy density of the synchrotron photons along the M 87 jet (neglecting relativistic corrections), , where is the optical flux of a knot at Hz. In deprojecting distances of the knots from the active core jet viewing angle was assumed for illustration.

Finally, any stationary observer located at the jet axis is illuminated by the radiation produced within the active nucleus. Obviously, this emission is anisotropic, relativistically beamed into a narrow cone depending on the (unknown) bulk Lorentz factor of a nuclear jet. In this context we note, that the sub-pc-scale ( mas pc) jet in M 87 has a slightly different position angle than the large-scale jet in this source, with the misalignment in position angle (Junor & Biretta, 1995). For these reasons, it is not obvious that the large-scale jet is indeed illuminated from behind by the beamed nuclear emission and what is the beaming amplification of such an emission, i.e., if the jet flow at pc from the center is placed within the beaming cone of the nuclear jet. If, however, jet misalignment can be neglected in this respect (because of relativistic and projection effects which make apparent misalignment much larger than the real one) then, as discussed in Stawarz et al. (2003), energy density of the nuclear jet emission in the galactic rest frame along the jet axis is , where is the synchrotron luminosity of the nuclear jet observed at some viewing angle , is the bulk Lorentz factor of the nuclear jet and is the appropriate nuclear Doppler factor. For example, with and one obtains . In Figure 4, for illustration we assume the nuclear beaming correction factor , and note that the uncertainty in this approximation (for a fixed ) can be more than one order of magnitude. We further take erg s-1 (Tsvetanov et al., 1998) characterizing steady state of the M 87 nucleus, obtaining thus a profile of shown in Figure 4. Let us mention, that is peaked at the observed photon frequencies Hz.
In the rest frame of the jet, the energy densities of different radiation fields depend on the bulk Lorentz factor and inclination of some particular part of the jet. For example, the energy density of the starlight emission (as well as of the cluster and CMB photon field) are amplified in a plasma rest frame accordingly to . Relativistic corrections also decrease the comoving energy density of the synchrotron radiation accordingly to (as appropriate for a stationary shock feature). Finally, the nuclear emission in the rest frame of the outer jet is decreased by a factor (Stawarz et al., 2003). Note, that even varying the jet viewing angle alone influences deprojected distances of the jet features and therefore the energy densities of the galactic and nuclear radiation fields. In a framework of our model, HST-1 flaring point corresponds to a compact region just downstream of the reconfinement/reflect shocks system. Estimation of the appropriate bulk Lorentz factor of the radiating plasma is not trivial in this case, because we need to consider the oblique shock geometry. In particular, the jet matter downstream of the reconfinement and reflected shock fronts may still be relativistic, depending on the distance from the jet axis (see Appendix A).
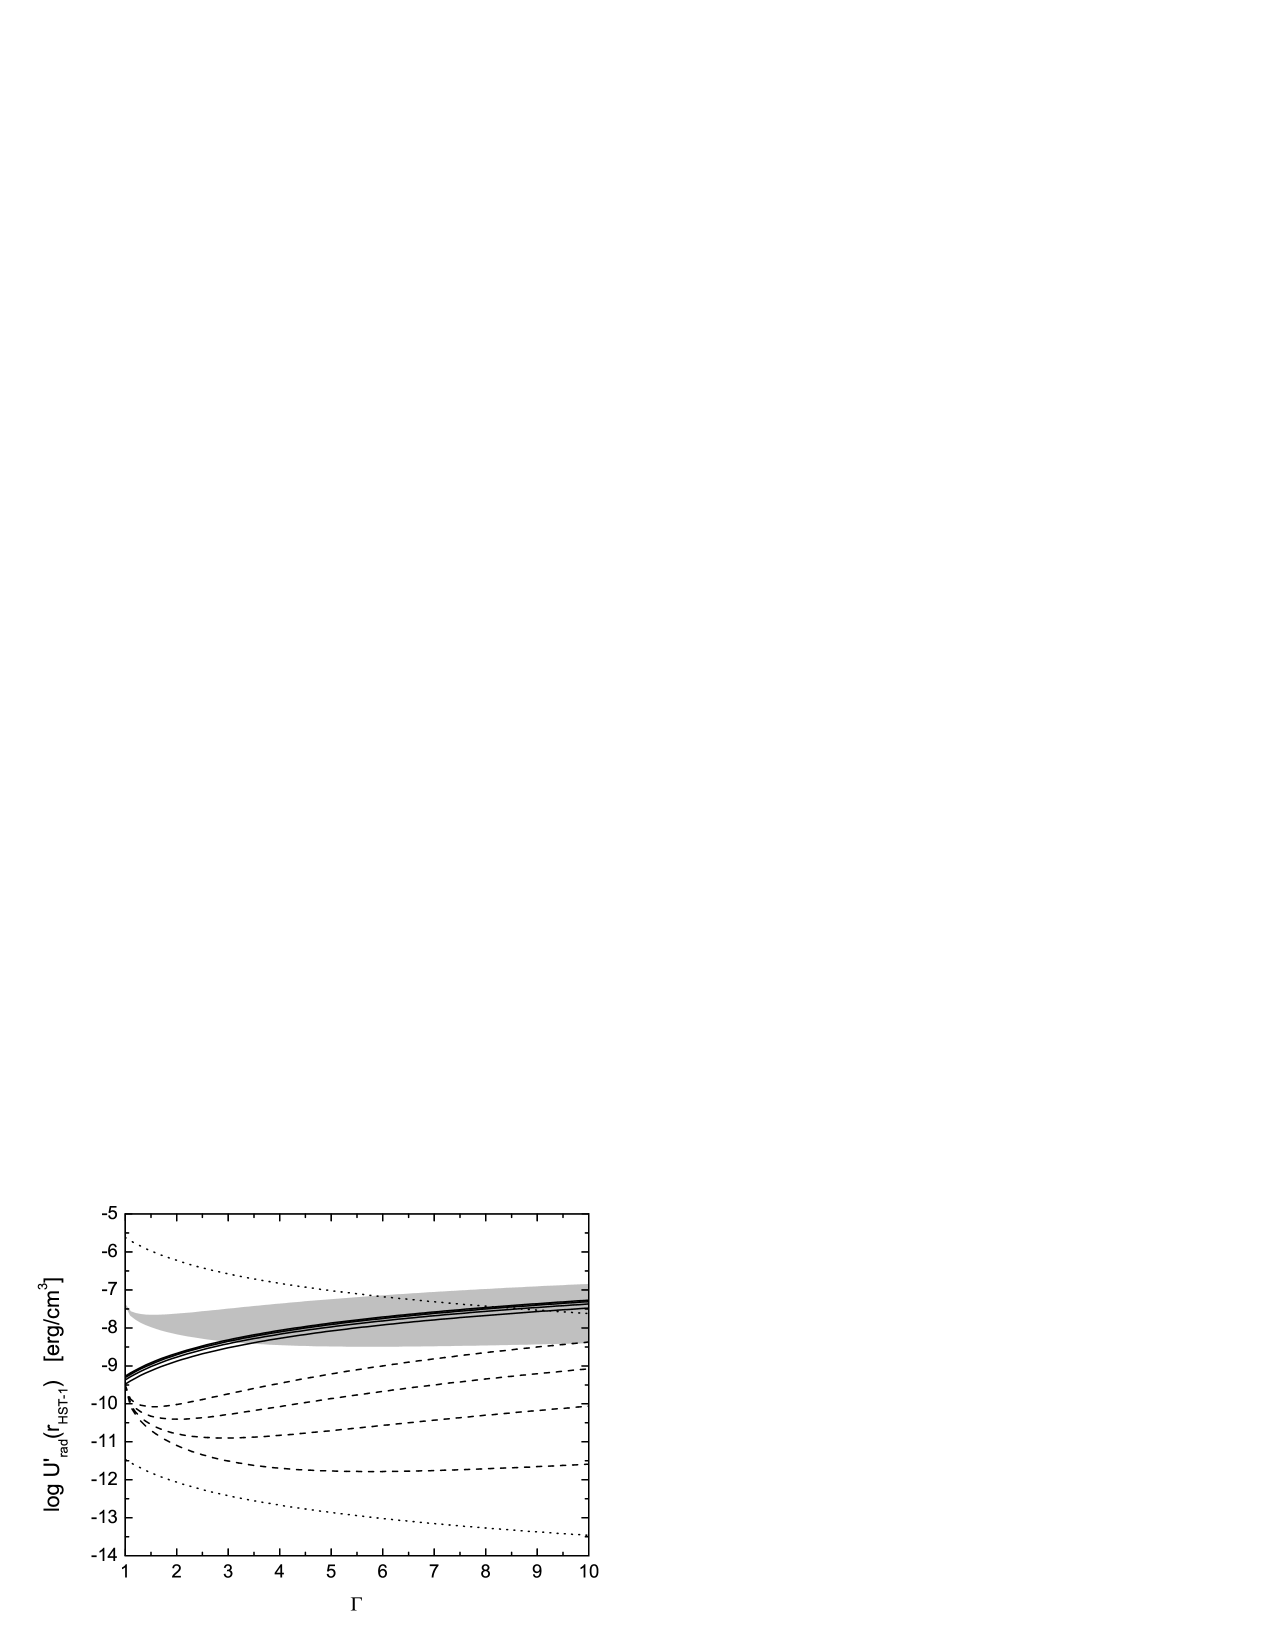
If the HST-1 flaring point corresponds to a significantly decelerated portion of the jet matter located at the very jet axis close to , the comoving energy densities of the starlight and synchrotron photon fields are comparable, as presented in Figures 4 and 5 for different jet viewing angles. With an increasing bulk Lorenz factor the energy density of the starlight emission increases from about erg cm-3 for up to erg cm-3 for (Figure 5). A shift in the deprojected position of the HST-1 flaring region due to a different jet viewing angle is of negligible importance, because the entire HST-1 complex is located within the central plateau of . The internal energy density of the jet synchrotron emission initially decreases with a growing velocity of the emitting region, but for the larger values of it increases again, since for a given the appropriate jet Doppler factor decreases with an increasing (large) . One can however conclude, that for a wide range of parameters shown in Figure 5 (namely, and ), in the rest frame of the HST-1 flaring region, the starlight emission is expected to dominate over the internal synchrotron photon field. On the other hand, one should be aware that as the HST-1 flaring point is unresolved (while at the same time synchrotron energy density goes with the emission region size as ), the estimated should be considered as a lower limit only. In addition, here we only considered a quiescent epoch of M 87. The biggest uncertainties correspond however to a photon field of a nuclear jet illuminating HST-1 knot from behind. Figure 5 illustrates two extreme cases for at the position of this knot, corresponding to the nuclear Lorentz factor and , and also to and . The estimated energy density of the synchrotron emission of the nuclear jet varies by a few orders of magnitude (!) for these two examples, and may exceed or be much smaller than the other components, and . Figure 5 shows also for a comparison the energy density of the equipartition magnetic field, with G, for .
5 HST-1 Knot as a TeV Source?
Let us suppose that the active core of M 87 experienced at some moment an outburst, resulting in the flare of its synchrotron emission and ejection of a portion of the “jet matter” with the excess kinetic power (when compared to the steady-state epoch of the jet activity). Both photons and particles travel along the jet, arriving at some time to the location of the HST-1 knot, where the reconfinement shock formed within a steady jet reaches the jet axis. Flare synchrotron photons emitted by the active nucleus are then comptonized to TeV energies (hereafter ‘IC/nuc’ process), while the excess jet matter shocked around causes synchrotron (hereafter ‘SYN’) and the additional inverse-Compton brightening of the HST-1 flaring region. As discussed in the previous section and also below, this additional inverse-Compton brightening should be dominated by Compton scattering of the starlight emission (hereafter ‘IC/star’ process) or synchrotron self-Compton process (‘SSC’). We note, that some short time-scale variations of the emission coming from the nucleus in its high state can be imprinted in the observed IC/nuc flux of the outer parts of the jet. In addition, due to different velocities of the nuclear photons and particles, TeV flare resulting from the IC/nuc process in HST-1 knot is expected to lead SYN, IC/star and SSC brightening of the HST-1 flaring region by some time . Note that the increase in the seed photon energy density for a given synchrotron flux (i.e. for a given particle energy density) results in an increase of the inverse-Compton flux only if the electrons involved in the inverse-Compton scattering are weakly cooled by radiative losses (‘slow cooling regime’).
Assuming that the observed sub-luminal velocities of the jet features observed between the core and the HST-1 knot are only pattern velocities, not reflecting the true bulk velocity of the jet spine (see a discussion in Dodson et al., 2005), and that this true bulk velocity is highly relativistic , the appropriate delay time difference is roughly
| (10) |
where pc is a projected distance of the HST-1 flaring region from the core. For example, period yr between presumable maximum of the TeV emission (1998/1999) and the observed maximum of the synchrotron emission of the HST-1 knot (2005) is consistent with the jet viewing angle for , with for , and finally with for . The assumed hypothetical nuclear flare should be observed some years before the IC/nuc flare of the HST-1 knot, where
| (11) |
For example, yr for , yr for , and yr for . We note in this context, that interestingly De Young (1971) reported radio flare of M 87 nucleus in 1969-1971. If — again for illustration — one identifies the considered nuclear flare with this event, then equations 6 and 7 imply and .
In the rest frame of the HST-1 knot, assuming moderate bulk velocity and jet viewing angle, the energy densities of the starlight, nuclear and internal synchrotron photons are peaked at similar photon frequencies Hz. Thus, electrons upscattering all these photons to the observed TeV energies are mostly the slowly cooled ones, with energies (the optical spectral index of HST-1 knot is consistent with ; Perlman et al., 2003). The resulting TeV fluxes due to the IC/star, IC/nuc and SSC processes are then produced in the transition between Thomson and Klein-Nishina regimes. Hence, for a rough evaluations one can approximate the expected observed TeV fluxes by , where is the observed optical luminosity of the HST-1 knot, while and are the comoving energy densities of the appropriate seed photons and the equipartition magnetic field. Function arises due to possible anisotropy of the seed photons in the emitting region rest frame (see Stawarz et al., 2003, and Appendix B). Using the observed radio fluxes of the HST-1 flaring region as measured at GHz, the optical flux at Hz, and the emitting region size in arcseconds, one obtains (see Appendix B)
| (12) |
| (13) |
and
| (14) | |||||
In the above we assumed that at every moment (i.e., for a given and ) the HST-1 flaring region is in equipartition regarding energies of the ultrarelativistic electrons and the magnetic field. We also introduced internal nuclear luminosity , which should correspond to the assumed nuclear outburst, and not to the steady-state discussed in the previous section.
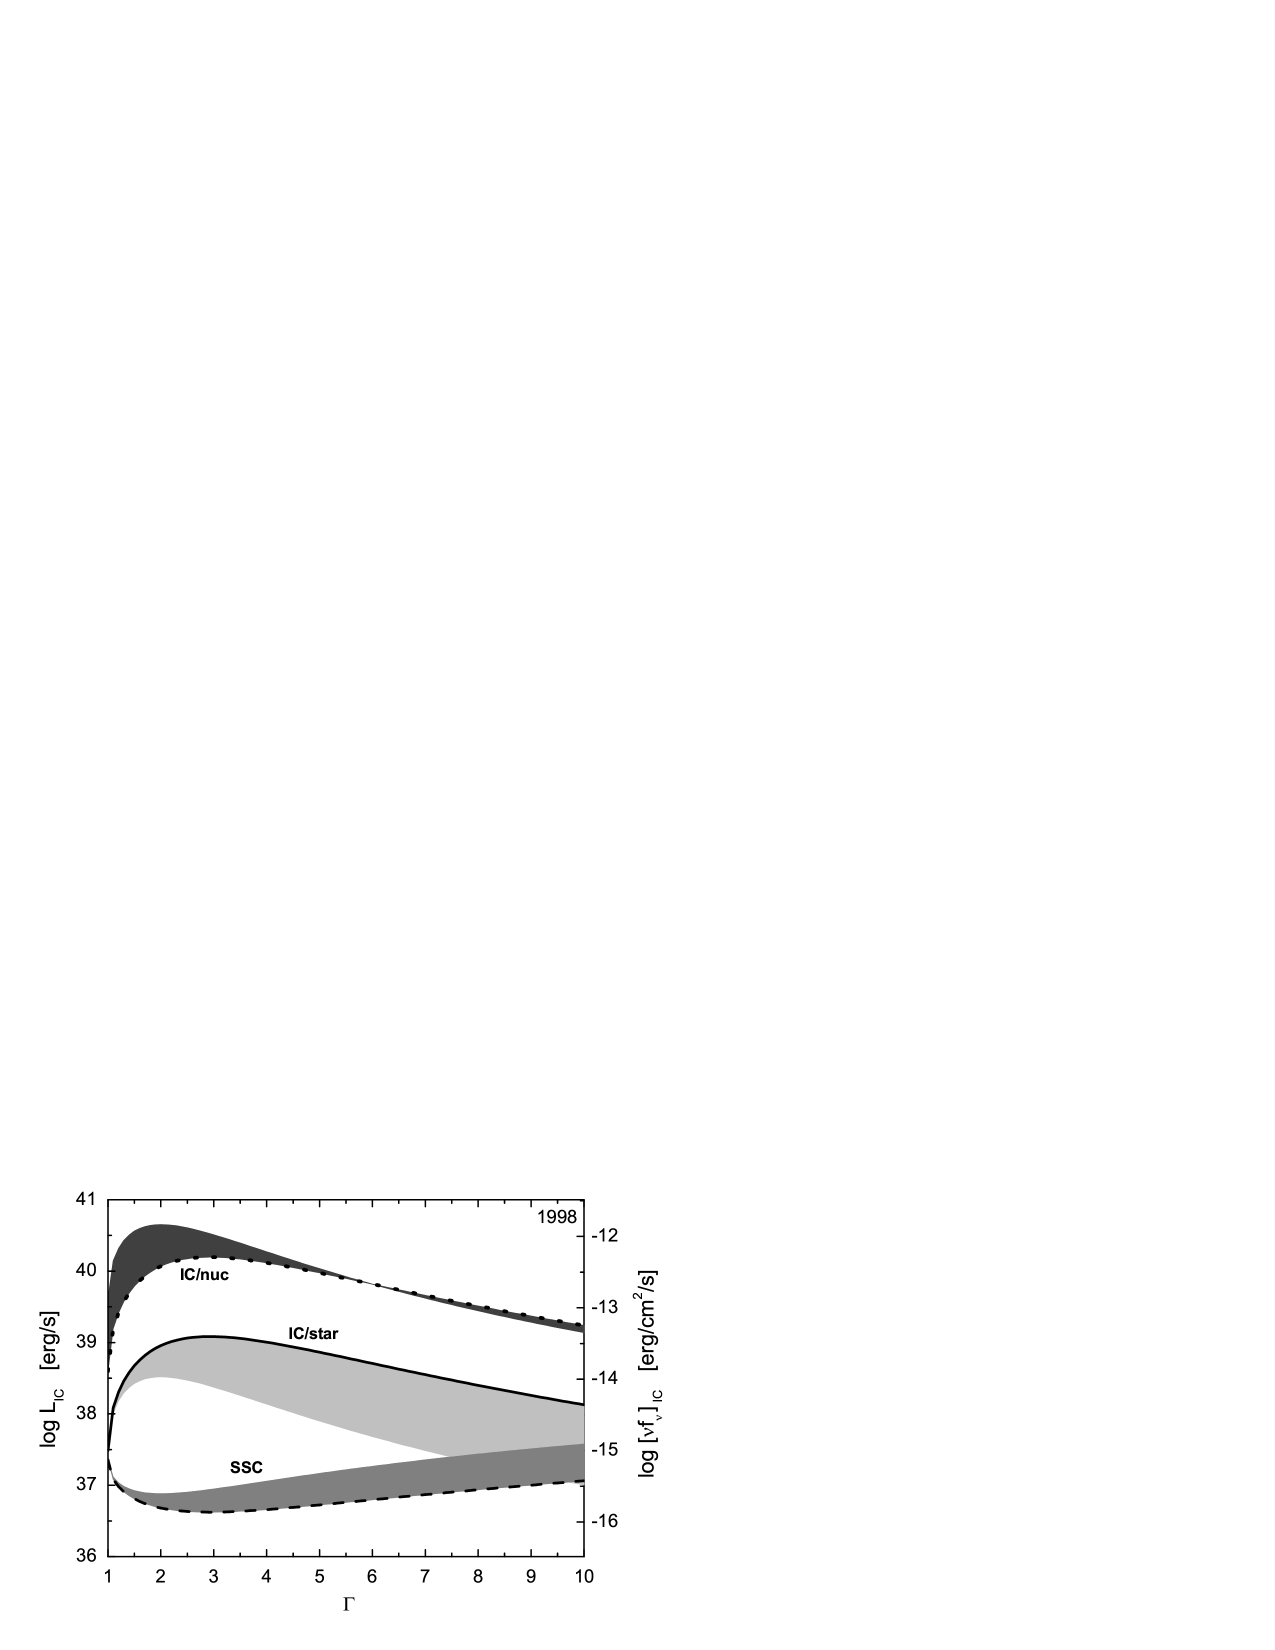
Different constraints presented and cited in previous sections suggest the most likely jet viewing angle of . In Figure 6 we present the expected TeV emission of the HST-1 flaring region in 1998 assuming , and resulting from IC/nuc, IC/star and SSC processes (equations 8-10), as functions of the bulk Lorentz factor of this part of the jet. For illustration, shaded regions indicate also the appropriate luminosity expected for . Here we took mJy, Jy and (Harris et al., 2003). The expected TeV IC/star emission is in this case erg s-1, and the corresponding SSC emission is even lower. However, the IC/nuc emission could eventually account for the HEGRA detection ( erg s-1) only if the bulk Lorentz factor of the HST-1 flaring region was and the assumed nuclear flare was characterized by erg s-1 (as taken in Figure 6). We note, that for such parameters the comoving energy density of the nuclear photons, erg cm-3, dominates over the comoving energy densities of the magnetic field and the starlight emission ( erg cm-3 and erg cm-3, respectively). Hence, cooling of the considered TeV energy electrons is mainly due to the IC/nuc process. We also note, that the obtained above value of the preferred bulk Lorentz factor refers in our model strictly to the compact (unresolved) and decelerated portion of the outflow placed at the jet axis immediately after , which is responsible for production of the flaring emission, and not to whole outflow at the same distance from the nucleus. In fact, oblique geometry of the reconfinement shock implies that the other parts of the jet, located further from the jet axis, may suffer much less deceleration, and thus that the average bulk Lorentz factor of the whole outflow may be higher than the one characterizing HST-1 flaring region.
With the preferred and , the Doppler factor of the HST-1 flaring region is , while the jet-counterjet synchrotron brightness asymmetry is (still constistently with the observational limits). Assuming (in agreement with values usually derived by means of modeling broad-band emission of BL Lac objects; Urry and Padovani, 1995), the Doppler factor of the nuclear M 87 jet would be roughly . This implies that the nuclear outburst assumed in our model would be observed with the isotropic luminosity erg s-1. This is higher than the observed luminosity of the M 87 nucleus in its steady-state epoch (Tsvetanov et al., 1998) by only a factor . We note, that order-of-magnitude flares on time scales of years are common in blazar sources. In addition, as mentioned above, synchrotron emission of the HST-1 flaring region has increased between 1998 and 2005 by a similar factor (Harris et al., 2006). This is another indication that the model presented here is self-consistent (if only roughly ). Moreover, we expect characteristic timescale for the variability of the emission produced within the HST-1 flaring region yr for , again in a rough agreement with the observed one at radio, optical, X-ray, and -ray frequencies.
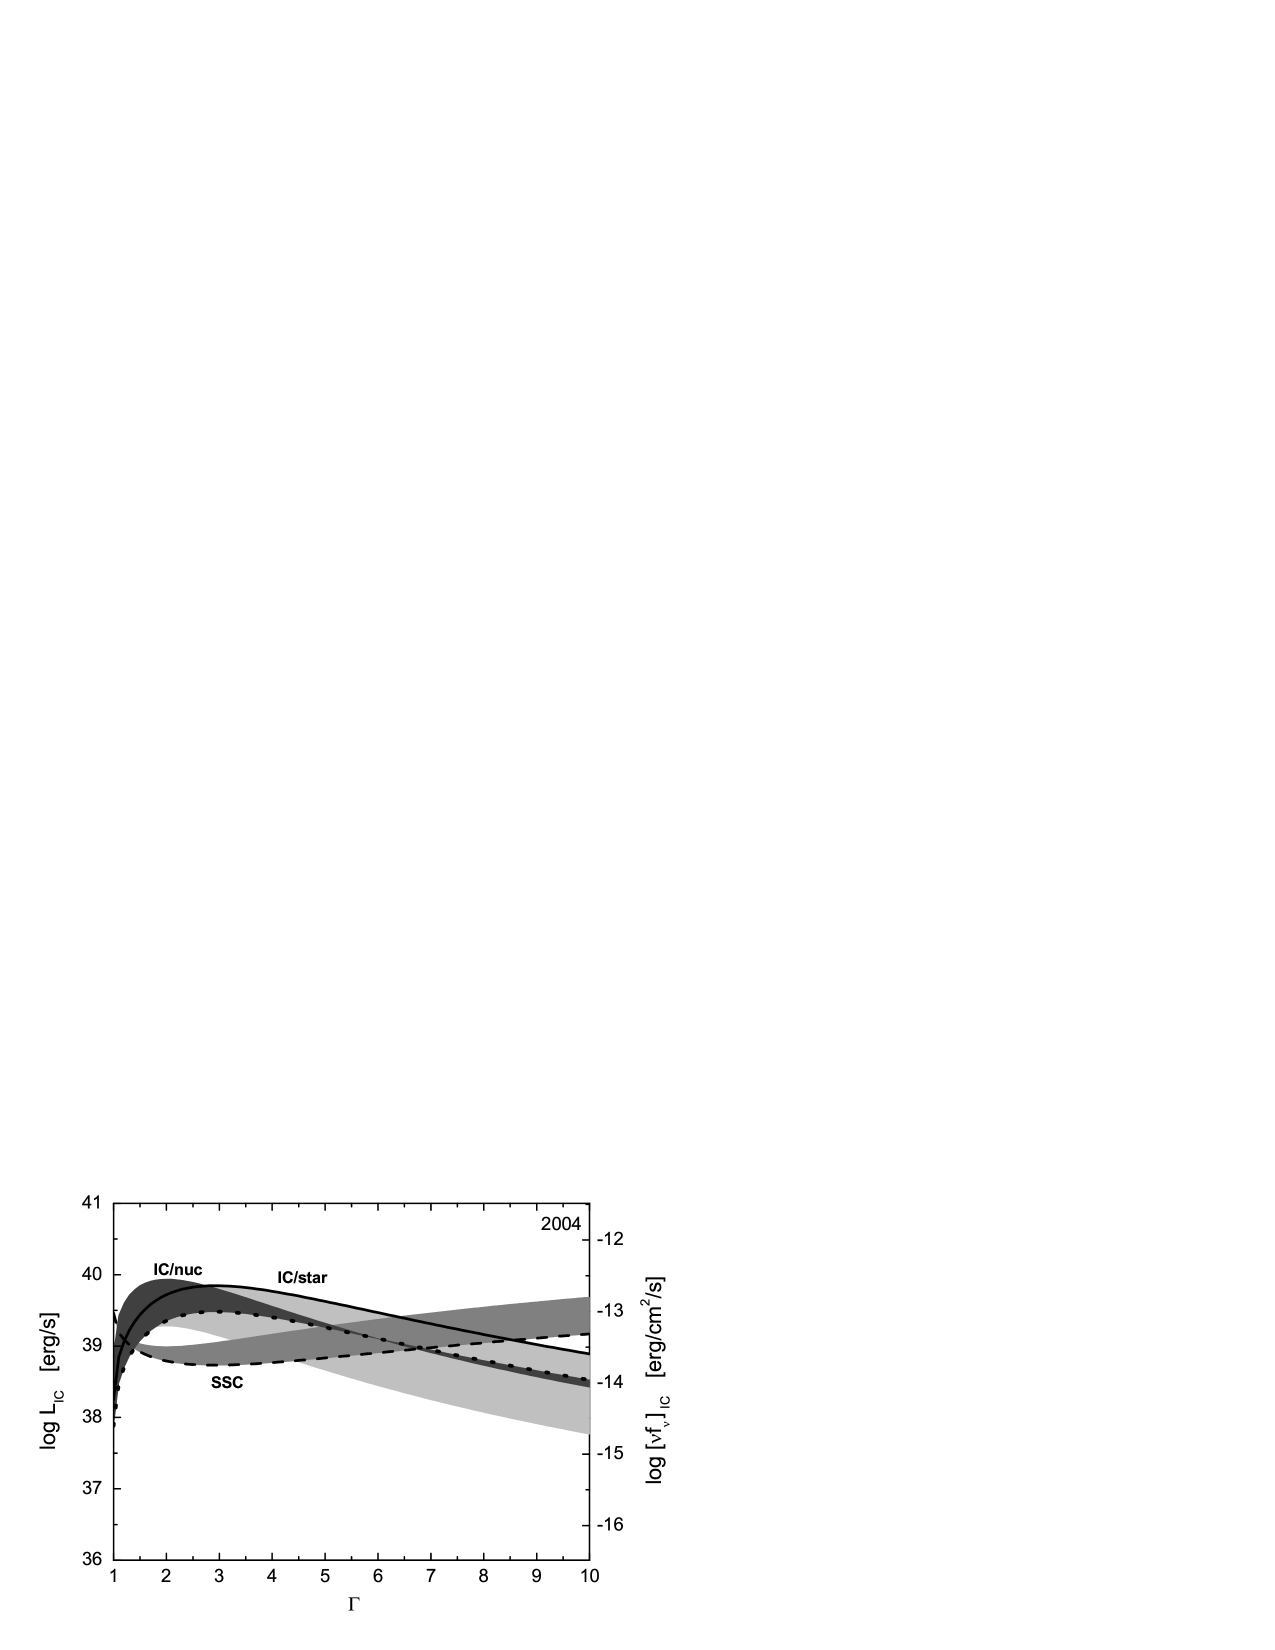
Let us investigate next the expected TeV emission at some later time, during the synchrotron flare of HST-1, when the nuclear seed photon energy density in the knot’s rest frame has decreased significantly. Figure 7 shows the expected TeV IC/nuc, IC/star and SSC luminosities again for and , but this time with mJy, Jy taken to illustrate synchrotron continuum of HST-1 flaring region in 2004 (Harris et al., 2006), and erg s-1 characterizing the quiescence nuclear emission (factor of below the high activity epoch considered above). In such a case, for one expects erg s-1 and erg s-1. Also except for the small bulk Lorentz factors () and large jet viewing angle (). The considered parameters imply now erg cm-3 and erg cm-3, i.e. that radiative cooling of the TeV energy electrons is mainly due to their synchrotron emission. We finally note that the synchrotron emission of the HST-1 flaring region has increased between 2004 and 2005 by a factor of . Thus, in a framework of the presented model, we expect also the TeV flux due to the IC/star process to increase in 2005 when compared with the 2004 level.
6 Summary and Conclusions
Supermassive black holes present in centers of active galaxies are known to influence trajectories of nearby stars, and to create in this way central stellar cusps observed by Hubble. Here we propose that the distribution of the hot gas within ellipticals follows closely distribution of the stars not only in the outer parts of the galaxies, as observed in a number of such systems, but also in the innermost parts. If this is the case, then one should expect excess of thermal pressure (when compared to the pure -type profile of the gas number density) within pc from the galactic center. The resulting small excess in X-ray surface brightness due to free-free radiation of the hot gas seems to be required to explain some Chandra observations. This additional gaseous component can also result in a stronger confinement of the jets, leading to formation of stationary reconfinement/reflected shocks within the outflows. We propose that in the case of the M 87 radio galaxy, HST-1 knot present at pc from the center can be identified with the downstream region of such a reconfinement/reflected shock. In particular, we argue that stationary, compact ( pc), variable (on the time scale of, at least, months and years), and overpressured (by a factor ) HST-1 flaring region is placed immediately downstream of the point where the converging reconfinement shock reaches the jet axis (‘reconfinement nozzle’). Thereby some portion of the hot relativistic jet decelerates from highly relativistic to mildly relativistic bulk velocities (from bulk Lorentz factor down to ), while other parts of the jet (placed further away from the jet axis) are expected to decelerate less strongly due to a larger angle between the upstream bulk velocity vector and the shock normal. The liberated bulk kinetic energy of the outflow is transformed at the shock front to the turbulent magnetic field energy (consistently with the decrease in the degree of linear polarization observed in HST-1 knot), and, in similar amount (by assumption), to the ultrarelativistic particles.
Although the reconfinement/reflected shock structure is stationary in the observer’s rest frame, variations and changes in the central engine lead inevitably to flaring of this part of the outflow, in particular when the excess particles and photons emitted by the active nucleus in its high-activity epoch and traveling down the jet arrive after some time to the reconfinement nozzle. In a framework of this scenario, one should expect firstly high-energy -ray flare due to comptonization of the photons from the nuclear outburst, and then, after some delay depending on the bulk velocity of the nuclear jet, synchrotron flare due to excess nuclear particles shocked at the nozzle. This delayed synchrotron flare could be accompanied by the subsequent inverse-Compton brightening due to upscattering of the ambient radiation fields by the increased population of the ultrarelativistic particles. It is tempting to speculate that such a sequence of events was in fact observed in HST-1 flaring region, especially as for a realistic set of the jet parameters the evaluated radiative fluxes are in agreement with the multiwavelength observations performed between 1998 and 2005.
Acknowledgments
Ł.S., M.O., and A.S. were supported by MEiN through the research project 1-P03D-003-29 in years 2005-2008. Ł.S. acknowledges also the ENIGMA Network through the grant HPRN-CT-2002-00321. M.S. acknowledges partial support from Polish MEiN grant 1-P03D-009-28. A.S. was supported by NASA contract NAS8-39073, and partly by the National Aeronautics and Space Administration through Chandra Award Number GO5-6113X issued by the Chandra X-Ray Observatory Center, which is operated by the Smithsonian Astrophysical Observatory for and on behalf of NASA under contract NAS8-39073. Authors thank Katherine Aldcroft, Daniel E. Harris, and the referee Geoff Bicknell for helpful comments and discussions.
Appendix A Reconfinement Shock
In the rest frame of a shock, the relativistic shock jump conditions can be written as
| (15) |
| (16) |
and
| (17) |
where velocities and refer to the normal components of the upstream (‘’) and downstream (‘’) bulk velocity vectors, respectively (see, e.g., Kirk & Duffy, 1999). Here is the proper enthalpy of the fluid, is its isotropic pressure, and its the proper number density. Let us consider first the case of the upstream cold plasma dominated dynamically by the rest energy of the particles with a mass , with the thermal pressure negligible, i.e. the enthalpy being approximately equal to the proper rest-mass energy density , namely , where is the appropriate adiabatic index. One can find that in such a case
| (18) |
Now let us consider a supresonic jet which breaks free at some distance from the central engine, and next experiences reconfinement by the ambient medium starting from the distance . Following Komissarov & Falle (1997), we denote by the angle between the tangent to the converging reconfinement shock at some given distance , and by the angle between the pre-shock jet bulk velocity vector close to the shock at the same distance . Note, that by the definition and , where is the distance of the reconfinement shock from the jet axis at given . We also assume that both angles are small, i.e. and . As the reconfinement shock is stationary in the observer rest frame, one has
| (19) |
where is the pre-shock jet bulk velocity, and is the pre-shock bulk Lorentz factor, and, obviously, . The jet luminosity is , where is the radius of the free jet and is the pre-shock (free) jet opening angle. Taking the external pressure of the ambient gaseous matter , by means of the condition , one obtains an equation for the distance of the reconfinement shock from the jet axis
| (20) |
where
| (21) |
and we expressed the term as a parameter . With the initial condition , the solution to the above equation,
| (22) |
implies that the reconfinement shock reaches the jet axis at the distance
| (23) |
Note, that at one has
| (24) |
where is the relativistic Mach number of a free jet, and is the jet sound speed in units. For a cold jet matter considered here . Since at jet pressure equals external gas pressure, , one can therefore find that
| (25) |
This, together with the equation for , gives the condition
| (26) |
With one obtains for (see Komissarov & Falle, 1997).
Now let us consider an analogous case as before, but with a jet matter described by an ultrarelativistic equation of state, (i.e., with ). In this case the upstream pressure cannot be neglected anymore, and by combining equations A1-A2 one obtains for a relativistic jet
| (27) |
where . With the appropriate expression for the jet kinetic luminosity, , one obtains again
| (28) |
In addition, in the case of the ultrarelativistic equation of state the sound speed is , and hence by means of expression A10 in a form
| (29) |
one obtains condition .
Appendix B Radiative Formulae
For a given radio flux as measured at some observed radio frequency , and for the observed emission region size , the intensity of the equipartition magnetic field evaluated ignoring relativistic correction is
| (30) |
where and are the minimum and maximum frequencies of the synchrotron continuum, assumed to be a simple power-law characterized by a spectral index (see, e.g., Longair, 1994). As discussed by Stawarz et al. (2003), relativistic corrections give . Hence, taking and , one obtains
| (31) |
(see in this context Kataoka & Stawarz, 2005). This gives the comoving minimum magnetic field energy density .
As discussed in Stawarz et al. (2003), the observed inverse-Compton luminosities (produced in the Thomson regime) can be simply evaluated as
| (32) |
where is the observed synchrotron luminosity, is the comoving energy densities of the seed photons, while is the function of the kinematic jet parameters arising due to possible anisotropy of the seed photon fields in the jet rest frame. In section 5, the observed bolometric synchrotron luminosity is approximated by the optical one, . In section 5 we also assumed that at every moment (i.e., for a given synchrotron flux), the emission region is in the equipartition regarding energies of the radiating electrons and the magnetic field.
In the case of the synchrotron self-Compton emission, and , leading to
| (33) |
If the comptonisation of the starlight emission is considered, and . Hence,
| (34) |
Finally, for the comptonisation of the nuclear emission illuminating the jet from behind, we have and , where the factor is due to deprojecting the observed distance of the emission region. This leads to
| (35) |
The approximations derived above allow us to estimate in a simple way the expected -ray fluxes for a given , , , and the kinematic parameters of the jet.
References
- Aharonian et al. (2003) Aharonian, F.A., et al. 2003, A&A, 403, L1
- Bai & Lee (2001) Bai, J.M., & Lee, M.G. 2001, ApJ, 549, 173
- Beilicke et al. (2005) Beilicke, M., et al. 2005, In Proc. ‘22nd Texas Symposium on Relativistic Astrophysics’, 13-17 Dec. 2004, Palo Alto (USA)
- Bicknell & Begelman (1996) Bicknell, G.V., & Begelman, M.C. 1996, ApJ, 467, 597
- Biretta et al. (1991) Biretta, J.A., Stern, C.P., & Harris, D.E. 1991, AJ, 101, 1632
- Biretta et al. (1995) Biretta, J.A., Zhou, F., & Owen, F.N. 1995, ApJ, 447, 582
- Biretta et al. (1999) Biretta, J.A., Sparks, W.B., & Macchetto, F. 1999, ApJ, 520, 621
- Böhringer et al. (2001) Böhringer, H., et al. 2001, A&A, 365, 181
- Curtis (1918) Curtis H.D. 1918, Lick Obs.Publ., 13, 31
- de Ruiter et al. (2005) de Ruiter, H.R., Parma, P., Capetti, A., Fanti, R., Morganti, R., & Santantonio, L. 2005, A&A, 439, 487
- De Young (1971) De Young, D.S. 1971, Nature, 231, 253
- Di Matteo et al. (2003) Di Matteo, T., Allen, S.W., Fabian, A.C., Wilson, A.S., Young, A.J. 2003, ApJ, 582, 133
- Dodson et al. (2005) Dodson, R., Edwards, P.G., & Hirabayashi, H. 2005, PASJ, in press (astro-ph/0511383)
- Dressler & Richstone (1990) Dressler, A., & Richstone, D.O. 1990, ApJ, 348, 120
- Faber et al. (1997) Faber, S.M., Tremaine, S., Ajhar, E.A., Byun, Y.-I., Dressler, A., Gebhardt, K., Grillmair, C., Kormendy, J., Lauer, T.R., Richstone, D. 1997, AJ, 114, 1771
- Falle (1991) Falle, S.A.E.G. 1991, MNRAS, 250, 581
- Falle & Wilson (1985) Falle, S.A.E.G., & Wilson, M.J. 1985, MNRAS, 216, 79
- Feng et al. (2004) Feng, H., Zhang, S.-N., Lou, Y.-Q., & Li, T.-P. 2004, ApJ, 607, L95
- Gastaldello & Molendi (2002) Gastaldello, F., & Molendi, S. 2002, ApJ, 572, 160
- Ghisellini et al. (2005) Ghisellini, G., Tavecchio, F., & Chiaberge, M. 2005, A&A, 432, 401
- Giannios & Spruit (2006) Giannios, D., & Spruit, H.C. 2006, A&A, in press (astro-ph/0601172)
- Georganopoulos et al. (2005) Georganopoulos, M., Perlman, E.S., & Kazanas, D. 2005, ApJ, 634, L33
- Gracia et al. (2005) Gracia, J., Tsinganos, K., & Bogovalov, S.V. 2005, A&A, 442, L7
- Hardcastle et al. (2002) Hardcastle, M.J., Worrall, D.M., Birkinshaw, M., Laing, R.A., & Bridle, A.H. 2002, MNRAS, 334, 182
- Harris et al. (2003) Harris, D.E., Biretta, J.A., Junor, W., Perlman, E.S., Sparks, W.B., and Wilson, A.S. 2003, ApJ, 586, L41
- Harris et al. (2006) Harris, D.E., Cheung, C.C., Biretta, J.A., Sparks, W., Junor, W., Perlman, E.S., & Wilson, A.S. 2006, ApJ, 640, 211
- Heinz & Begelman (1997) Heinz, S., & Begelman, M.C. 1997, ApJ, 490, 653
- Jorstad et al. (2001) Jorstad, S.G., Marscher, A.P., Mattox, J.R., Wehrle, A.E., Bloom, S.D., & Yurchenko, A.V. 2001, ApJs, 134, 181
- Junor & Biretta (1995) Junor, W., & Biretta, J.A. 1995, AJ, 109, 500
- Junor et al. (1999) Junor, W., Biretta, J.A., & Livio, M. 1999, Nature, 401, 891
- Kataoka & Stawarz (2005) Kataoka, J., & Stawarz, Ł. 2005, ApJ, 622, 797
- Kirk & Duffy (1999) Kirk, J.G., & Duffy, P. 1999, J. Phys. G, 25, 163
- Komissarov (1994) Komissarov, S.S. 1994, MNRAS, 266, 649
- Komissarov & Falle (1997) Komissarov, S.S., & Falle, S.A. 1997, MNRAS, 288, 833
- Laing & Bridle (2002) Laing, R.A., & Bridle, A.H. 2002, MNRAS, 336, 1161
- Lauer et al. (1992) Lauer, T.R., et al. 1992, AJ, 103, 703
- Lauer et al. (1995) Lauer, T.R., Ajhar, E.A., Byun, Y.-I., Dressler, A., Faber, S.M., Grillmair, C., Kormendy, J., Richstone, D., & Tremaine, S. 1995, AJ, 110, 2622
- Le Bohec et al. (2004) Le Bohec, S., et al. 2004, ApJ, 610, 156
- Lobanov et al. (2003) Lobanov, A., Hardee, P.E., & Eilek, J. 2003, NewAR, 47, 629
- Longair (1994) Longair, M.S. 1994, High Energy Astrophysics, Cambridge Univ. Press, Cambridge
- Macchetto et al. (1997) Macchetto, F., Marconi, A., Axon, D.J., Capetti, A., Sparks, W., & Crane, P. 1997, ApJ, 489, 579
- Marshall et al. (2002) Marshall, H.L., Miller, B., Davis, D., Perlman, E., Wise, M., Canizares, C., & Harris, D. 2002, ApJ, 564, 683
- Mathews & Brighenti (2003) Mathews, W.G., & Brighenti, F. 2003, ARA&A, 41, 191
- Meisenheimer et al. (1996) Meisenheimer, K., Röser, H.-J., & Schlötelburg, M. 1996, A&A, 307, 61
- Müller et al. (2004) Müller, S.A.H., Haas, M., Siebenmorgen, R., Klaas, U., Meisenheimer, K., Chini, R., & Albrecht, M. 2004, A&A, 426, 29
- Owen et al. (1989) Owen, F.N., Hardee, P.E., & Cornwell, T.J. 1989, ApJ, 340, 698
- Owen et al. (2000) Owen, F.N., Eilek, J.A., & Kassim, N.E. 2000, ApJ, 543 611
- Perlman & Wilson (2005) Perlman, E.S., & Wilson, A.S. 2005, ApJ, 627, 140
- Perlman et al. (1999) Perlman, E.S., Biretta, J.A., Zhou, F., Sparks, W.B., & Macchetto, F.D. 1999, AJ, 117, 2185
- Perlman et al. (2001) Perlman, E.S., Biretta, J.A., Sparks, W.B., Macchetto, F.D., & Leahy, J.P. 2001, ApJ, 551, 206
- Perlman et al. (2003) Perlman, E.S., Harris, D.E., Biretta, J.A., Sparks, W.B., & Macchetto, F.D. 2003, ApJ, 599, L65
- Pfrommer & Ensslin (2003) Pfrommer, C., & Ensslin, T.A. 2003, A&A, 407, 73
- Reid et al. (1989) Reid, M.J., Biretta, J.A., Junor, W., Muxlow, T.W.B., & Spencer, R.E. 1989, ApJ, 336, 112
- Reimer et al. (2004) Reimer, A., Protheroe, R.J., & Donea, A.-C. 2004, A&A, 419, 89
- Reynolds et al. (1996) Reynolds, C.S., Fabian, A.C., Celotti, A., & Rees, M.J. 1996, MNRAS, 283, 873
- Sanders (1983) Sanders, R.H. 1983, ApJ, 266, 73
- Sarazin (1986) Sarazin, C.L. 1986, Rev.Mod.Phys., 58, 1
- Sikora et al. (2005) Sikora, M., Begelman, M.C., Madejski, G.M., & Lasota, J.-P. 2005, ApJ, 625, 72
- Silva et al. (1998) Silva, L., Granato, G.L., Bressan, A., & Danese, L. 1998, ApJ, 509, 103
- Sparks et al. (1996) Sparks, W.B., Biretta, J.A., & Macchetto, F. 1996, ApJ, 473, 254
- Stawarz et al. (2003) Stawarz, Ł., Sikora, M., & Ostrowski, M. 2003, ApJ, 597, 186
- Stawarz et al. (2005) Stawarz, Ł., Siemiginowska, A., Ostrowski, M. & Sikora, M. 2005, ApJ, 626, 120
- Trinchieri et al. (1986) Trinchieri, G., Fabbiano, G., & Canizares, C.R. 1986, ApJ, 310, 637
- Tsvetanov et al. (1998) Tsvetanov, Z.I., Hartig, G.F., Ford, H.C., Dopita, M.A., Kriss, G.A., Pei, Y.C., Dressel, L.L., & Harms, R.J. 1998, ApJ, 493, 83
- Urry and Padovani (1995) Urry, C.M., & Padovani, P. 1995, PASP, 107, 803
- Waters & Zepf (2005) Waters, C.Z., & Zepf, S.E. 2005, ApJ, 624, 656
- Wilson (1987) Wilson, M.J., 1987, MNRAS, 226, 447
- Wilson & Falle (1985) Wilson, M.J., & Falle, S.A.E.G. 1985, MNRAS, 216, 971
- Wilson & Yang (2002) Wilson, A.S., & Yang, Y. 2002, ApJ, 568, 133
- van der Marel (1999) van der Marel, R.P. 1999, AJ, 117, 744
- Young (1980) Young, P.J. 1980, ApJ, 242, 1232
- Young et al. (1978) Young, P.J., Westphal, J.A., Kristian, J., Wilson, C.P., & Landauer, F.P. 1978, ApJ, 221, 721
- Young et al. (2002) Young, A.J., Wilson, A.S., & Mundell, C.G. 2002, ApJ, 579, 560