Molecular Hydrogen in a Damped Lyman- System at
Abstract
We present the direct detection of molecular hydrogen at the highest redshift known today () in a Damped Lyman- (DLA) system toward the quasar PSS J 14432724. This absorber is remarkable for having one of the highest metallicities amongst DLA systems at , with a measured iron abundance relative to Solar of . We provide for the first time in this system accurate measurements of N i, Mg ii, S ii and Ar i column densities. The sulfur and nitrogen abundances relative to Solar, and respectively, correspond exactly to the primary nitrogen production plateau. H2 absorption lines are detected in four different rotational levels (, 1, 2 and 3) of the vibrational ground-state in three velocity components with total column densities of , 17.97, 17.48 and 17.26 respectively. The level is tentatively detected in the strongest component with . The mean molecular fraction is , with H i. We also measure HDH. The excitation temperatures for the two main components of the system are 96 and 136 K respectively. We argue that the absorbing galaxy, whose star-formation activity must have started at least yrs before , is in a quiescent state at the time of observation. The density of the gas is small, cm-3, and the temperature is of the order of K. The high excitation of neutral carbon in one of the components can be explained if the temperature of the Cosmic Microwave Background Radiation has the value expected at the absorber redshift, K. These observations demonstrate the feasibility to study H2 at the highest redshifts provided high enough spectral resolution and good S/N ratio are achieved.
1 Introduction
Although molecular hydrogen, H2, is the most abundant molecule in the Universe, it is very difficult to detect directly. Emission lines from the tracer molecule CO are usually used instead but, at , only the brightest objects can be detected with current facilities (e.g., Omont et al. 1996; Solomon & Vanden Bout 2005). For the time being, the only way to detect H2 directly at high redshift is to search for the absorption signature of the molecular UV transition lines from Damped Lyman- (DLA) systems observed in the spectra of quasars or those of -ray burst afterglows.
DLA systems are characterized by very large neutral hydrogen column densities, H i cm-2, that are typical of sightlines through local spiral galaxies. Inferred metallicities typically vary between [Zn,S/H and -0.5 at and are smaller at larger redshifts (e.g., Prochaska et al. 2003). The dust content is less than or about 10% of what is observed in the Galactic ISM for similar H i column densities (Ledoux et al. 2003). The detection of H2 molecules in high-redshift DLA systems through Lyman-Werner band absorption is observationally challenging due to the presence of the Ly forest. High spectral resolution, good S/N ratio and large wavelength coverage are simultaneously needed to detect the H2 lines and avoid spurious detections (e.g., Levshakov & Varshalovich 1985; Ge & Bechtold 1999; Petitjean et al. 2000; Levshakov et al. 2002; Ledoux et al. 2002, 2003; Cui et al. 2005).
We are conducting a survey for molecular hydrogen in DLA systems at high redshift (; see Ledoux et al. 2003), using the Ultraviolet and Visible Echelle Spectrograph (UVES; Dekker et al. 2000) at the European Southern Observatory’s Very Large Telescope, down to a detection limit of typically cm-2. Out of the 75 systems observed up to now, 14 have firm detections of associated H2 absorption lines. In this Letter, we present the highest redshift detection in our sample, in the DLA system toward the quasar PSS J 14432724. We describe the observations in Sect. 2 and the analysis of the data in Sect. 3. We conclude in Sect. 4.
2 Observations
The quasar PSS J 14432724 (, ) was observed with UVES in service mode on March 2-3 and 17-19, 2004. The red spectroscopic arm of UVES was used in the standard configuration with the central wavelength adjusted to 580 nm. The wavelength coverage was 478681 nm with only a small gap, between 575 and 584 nm, corresponding to the physical gap between the two red arm CCDs. The CCD pixels were binned and the slit width was fixed to , yielding, under the typical seeing conditions achieved during the observations, a resolving power . The total on-source integration time was 7.3 h, split into five exposures. The data were reduced using the UVES pipeline (Ballester et al. 2000) which is available as a dedicated context of the ESO MIDAS data reduction system. The wavelength scale of the spectra reduced by the pipeline was converted to vacuum-heliocentric values and individual exposures were scaled, weighted and combined altogether to produce the final object flux and variance spectra.
3 Analysis
3.1 The high metallicity and the star-formation history
The metallicity of the DLA system toward PSS J 14432724 is the highest among the ten DLA systems investigated up to now (Prochaska et al. 2003). Total integrated column densities and metallicities for N i, Mg ii, S ii, Ar i and Fe ii, obtained from Voigt-profile fitting of the observed transition lines, are given in Table 1. With the exception of Fe ii, these ions are observed here for the first time. We derive metallicities relative to Solar of [S/H and [Fe/H. The latter value is consistent with the previous measurement by Prochaska et al. (2001) but we note that the newly determined H i and Fe ii column densities are both larger by about 0.15 dex. Even though the depletion factor is moderate (i.e., [S/Fe), because of the high metallicity the dust-to-gas ratio measured in this system () is similar to that of other systems in which H2 is detected (see Fig. 15 of Ledoux et al. 2003). Substantial star-formation activity must have taken place in the past history of this DLA system. Note that the age of the Universe at is 1.5 Gyr (for , and H km s-1 Mpc-1).
Nitrogen is thought to have both primary and secondary origins depending on whether the seed carbon and oxygen nuclei are produced by the star itself or are already present in the ISM from which the star formed. In the case of secondary nitrogen production, the ratio of nitrogen to oxygen abundances increases with increasing oxygen abundance, whereas for primary production this ratio remains constant and nitrogen tracks oxygen (this is the so-called primary plateau). In the low-metallicity H ii regions of nearby galaxies, [N/O] abundance ratios tend to lie around the primary plateau (with [N/O) for [O/H, and have a secondary behaviour for [O/H (van Zee et al. 1998; Izotov & Thuan 1999). Similarly, most DLA systems show a plateau at [N/O (see Centurión et al. 2003; Pettini et al. 2002). The abundance of nitrogen relative to sulfur at toward PSS J 14432724, [N/S, corresponds exactly to the primary nitrogen production plateau (assuming [O/S). If we assume the widely accepted hypothesis that primary nitrogen is produced in intermediate-mass stars () during the Asymptotic Giant Branch phase (Henry et al. 2000), then star-formation activity must have started in this system at least yrs before accounting for the characteristic lag time for intermediate-mass stars to eject nitrogen. This is similar to what is observed in the system toward BRI 12020725 (D’Odorico & Molaro 2004).
Argon can be ionised in H i regions and is therefore a tracer of the radiation field. In the presently studied system, we find [Ar/S, which is higher than in most other DLA systems (Vladilo et al. 2003). This is consistent with the associated galaxy being in a quiescent state at the time of observation, as also inferred below from the analysis of H2 lines.
3.2 Molecular hydrogen
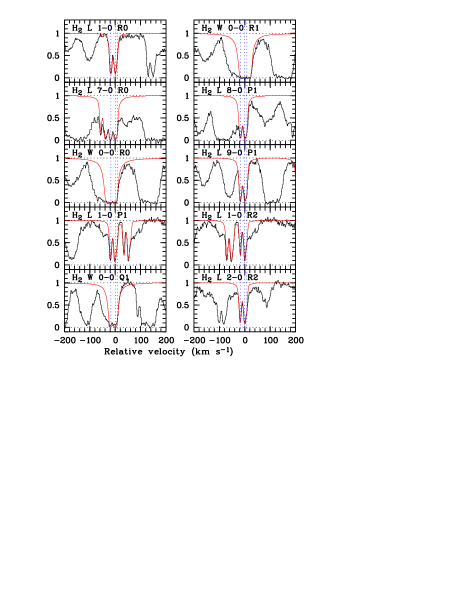
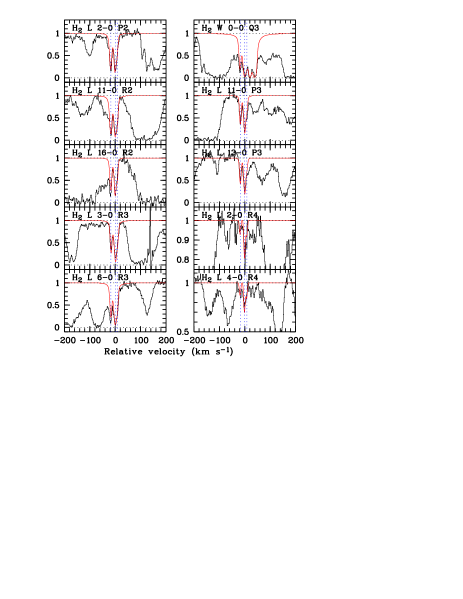
The H2 transitions are numerous and the spectral resolution of our data is high enough to allow unambiguous detection and detailed analysis of H2 (see Fig. 1). Great care has been exercised when fitting the absorption lines with multi-component Voigt profiles. H2 is detected in four different rotational levels (, 1, 2 and 3) of the vibrational ground-state in three velocity components with total column densities of , 17.97, 17.48 and 17.26 respectively (see Tables 1 and 2). The level is tentatively detected in the strongest component with . Blending is heavy however and this could be an upper limit. The detection of H2 confirms the previous claim that most of the gas in this DLA system is cold (Howk et al. 2005). The total H2 column density is one of the largest observed in DLA systems and the molecular fraction is , with H i. HD is not detected down to limits of HD and 13.7 for and 1 respectively, implying that HDH.
The excitation temperatures for the two main components of the system are 96 and 136 K respectively (see Table 2). The excitation temperatures for higher rotational levels are slightly larger, possibly as a consequence of the levels being populated by radiative or formation pumping. By equating H2 formation and destruction rates, we write:
| (1) |
where is the particle density, is the H2 dissociation rate in the unshielded UV background (in s-1) and is the correction factor for shielding (Draine & Bertoldi 1996; Hirashita & Ferrara 2005). cm3 s-1 is the H2 formation rate per unit volume and time, is the metallicity relative to Solar and is the fraction of metals into dust.
The H2 level is mostly populated by pumping of lower rotational levels by absorption of UV photons from the ambient radiation field and subsequent radiative cascade, and by direct formation of the molecule in this excited state. Following the simple procedure introduced by Jura (1975), we write the equation describing the equilibrium of the level population as:
| (2) |
where is the pumping efficiency into the level from the level and s-1 denotes the spontaneous transition probability from to .
Combining the above equations and using the total column densities given in Table 1, we find s-1. This is probably an upper limit given the possibility that be an upper limit. Assuming a temperature of K, we derive a density of cm-3. This value could be slightly larger in case of any -element enhancement. The corresponding H2 dissociation rate is s-1. This is of the order of or smaller than the highly variable photo-dissociation rate observed in the ISM of the Galaxy (e.g., Hirashita & Ferrara 2005). This probably indicates, as expected above, that there is little on-going star formation in the galaxy associated with this DLA system. This is consistent with the fact that no emitting counterpart has been found using the Lyman-break techniques down to (Prochaska et al. 2002) or in Lyman- emission down to erg cm-2 s-1 from 2D-spectroscopy at the Canada-France-Hawaii Telescope (Ledoux 1999).
3.3 The Cosmic Microwave Background temperature
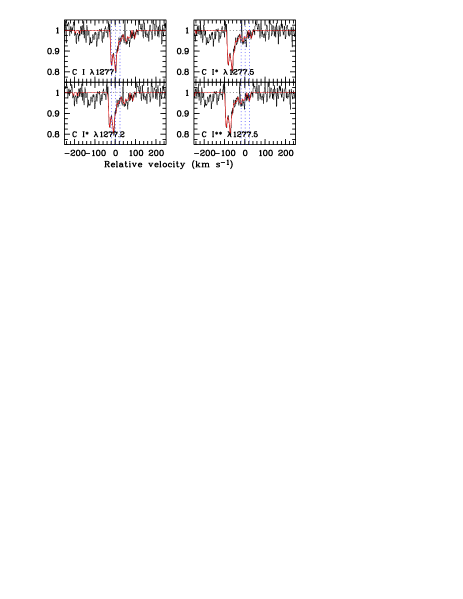
Absorption lines from the ground-state and first fine-structure excited level of C i are detected (see Fig. 2) at redshifts of and 4.22413, slightly larger than those of the molecular components. The Doppler parameters are larger as well indicating that the C i gas spans a slightly larger velocity range than the H2 gas (see also Ledoux et al. 2003). We measure C iC i and in each of the two components respectively. This is surprisingly small at high redshift. Indeed, the value expected for excitation by the Cosmic Microwave Background Radiation (CMBR) field alone, with a temperature of 14.2 K at , is (Silva & Viegas 2002). In addition, part of the excitation can be due to UV or IR pumping although this is probably negligible here. In Fig. 3, we plot the expected values for C iC i as a function of temperature of the cold gas. The first C i component has a density ( cm-3) that is similar to what is measured in the H2 gas and is thus probably predominantly associated with it. The second C i component probably has a lower density and the corresponding C iC i ratio is consistent with what is expected for excitation by the CMBR field alone.
4 Conclusion
The direct detection of H2 at high redshift is a unique tool for studying the ISM in the remote Universe. We have detected molecular hydrogen in one of the highest redshift DLA systems known to date (). We have shown that the gas is probably the left-over of intense star-formation activity that happened at least yrs before the time of observation and that the associated object is in a quiescent phase. The UV radiation field is of the order of or smaller than that in the Galaxy and the gas is cold ( K). The C iC i ratio in one of the components of the system is consistent with what is expected for excitation by the CMBR field at this redshift ( K). This study demonstrates the importance of this kind of observations for our understanding of how star formation proceeds at high redshift. The prospect of using -ray burst afterglows as background sources for similar studies is exciting and will boost this field in a near future (Draine & Hao 2002).
References
- Ballester et al. (2000) Ballester, P., Modigliani, A., Boitquin, O., Cristiani, S., Hanuschik, R., Kaufer, A., & Wolf, S. 2000, The Messenger, 101, 31
- Centurión et al. (2003) Centurión, M., Molaro, P., Vladilo, G., Péroux, C., Levshakov, S. A., & D’Odorico, V. 2003, A&A, 403, 55
- Cui et al. (2005) Cui, J., Bechtold, J., Ge, J., & Meyer, D. M. 2005, ApJ, 633, 649
- Dekker et al. (2000) Dekker, H., D’Odorico, S., Kaufer, A., Delabre, B., & Kotzlowski, H. 2000, Proc. SPIE, 4008, 534
- D’Odorico & Molaro (2004) D’Odorico, V., & Molaro, P. 2004, A&A, 415, 879
- Draine & Bertoldi (1996) Draine, B. T., & Bertoldi, F. 1996, ApJ, 468, 269
- Draine & Hao (2002) Draine, B. T., & Hao, L. 2002, ApJ, 569, 780
- Ge & Bechtold (1999) Ge, J., & Bechtold, J. 1999, in Highly Redshifted Radio Lines, Carilli, C. L., et al., eds., ASP Conf. Ser. 156, 121
- Grevesse & Sauval (2002) Grevesse, N., & Sauval, A. J. 2002, Adv. Space Res., 30, 3
- Henry et al. (2000) Henry, R. B. C., Edmunds, M. G., & Köppen, J. 2000, ApJ, 541, 660
- Hirashita & Ferrara (2005) Hirashita, H., & Ferrara, A. 2005, MNRAS, 356, 1529
- Howk et al. (2005) Howk, J. C., Wolfe, A. M., & Prochaska, J. X. 2005, ApJ, 622, L81
- Izotov & Thuan (1999) Izotov, Y. I., & Thuan, T. X. 1999, ApJ, 511, 639
- Jura (1975) Jura, M. 1975, ApJ, 197, 581
- Ledoux (1999) Ledoux, C. 1999, Ph.D. Thesis
- Ledoux et al. (2002) Ledoux, C., Srianand, R., & Petitjean, P. 2002, A&A, 392, 781
- Ledoux et al. (2003) Ledoux, C., Petitjean, P., & Srianand, R. 2003, MNRAS, 346, 209
- Levshakov & Varshalovich (1985) Levshakov, S. A., & Varshalovich, D. A. 1985, MNRAS, 212, 517
- Levshakov et al. (2002) Levshakov, S. A., Dessauges-Zavadsky, M., D’Odorico, S., & Molaro, P. 2002, ApJ, 565, 696
- Omont et al. (1996) Omont, A., Petitjean, P., Guilloteau, S., McMahon, R. G., Solomon, P. M., & Pécontal, E. 1996, Nature, 382, 428
- Petitjean et al. (2000) Petitjean, P., Srianand, R., & Ledoux, C. 2000, A&A, 364, L26
- Pettini et al. (2002) Pettini, M., Ellison, S. L., Bergeron, J., & Petitjean, P. 2002, A&A, 391, 21
- Prochaska et al. (2001) Prochaska, J. X., et al. 2001, ApJS, 137, 21
- Prochaska et al. (2002) Prochaska, J. X., Gawiser, E., Wolfe, A. M., Quirrenbach, A., Lanzetta, K. M., Chen, H.-W., Cooke, J., & Yahata, N. 2002, AJ, 123, 2206
- Prochaska et al. (2003) Prochaska, J. X., Gawiser, E., Wolfe, A. M., Castro, S., & Djorgovski, S. G. 2003, ApJ, 595, L9
- Silva & Viegas (2002) Silva, A. I., & Viegas, S. M. 2002, MNRAS, 329, 135
- Solomon & Vanden Bout (2005) Solomon, P. M., & Vanden Bout, P. A. 2005, ARA&A, 43, 677
- Vladilo et al. (2003) Vladilo, G., Centurión, M., D’Odorico, V., & Péroux, C. 2003, A&A, 402, 487
- van Zee et al. (1998) van Zee, L., Salzer, J. J., Haynes, M. P., O’Donoghue, A. A., & Balonek, T. J. 1998, AJ, 116, 2805
| Species | Transition | Metallicity | |
| lines | relative to Solar a | ||
| H i | 1025,1215 | … | |
| H2 | J=0 lines | … | |
| H2 | J=1 lines | … | |
| H2 | J=2 lines | … | |
| H2 | J=3 lines | … | |
| H2 | J=4 lines | … | |
| C i | 1277,1280 | … | |
| C i⋆ | 1277,1279 | … | |
| C i⋆⋆ | 1277,1280 | … | |
| N i | 953.4,1134.1 | 1.380.10 | |
| Mg ii | 1239,1240 | 0.550.10 | |
| S ii | 1250 | 0.630.10 | |
| Ar i | 1066 | 0.930.10 | |
| Fe ii | 1081 | 1.120.10 |
| Level | |||||
|---|---|---|---|---|---|
| [km s-1] | [K] | ||||
| 4.22371 | J=0 | … | … | ||
| J=1 | ” | 90-107 | 0-1 | ||
| J=2 | ” | 200-259 | 0-2 | ||
| J=3 | ” | 156-302 | 1-3 | ||
| J=4 | a | ” | … | … | |
| 4.22401 | J=0 | … | … | ||
| J=1 | ” | 104-179 | 0-1 | ||
| J=2 | ” | 218-377 | 0-2 | ||
| J=3 | ” | 337-530 | 1-3 | ||
| J=4 | ” | … | … | ||
| 4.22416 | J=0 | … | … | ||
| J=1 | ” | … | … | ||
| J=2 | ” | … | … | ||
| J=3 | ” | … | … | ||
| J=4 | a | ” | … | … |