The SAURON project - VI. Line strength maps of 48 elliptical and lenticular galaxies
Abstract
We present absorption line strength maps of representative elliptical and lenticular galaxies obtained as part of a survey of nearby galaxies using our custom-built integral-field spectrograph, SAURON, operating on the William Herschel Telescope. Using high-quality spectra, spatially binned to a constant signal-to-noise, we measure four key age, metallicity and abundance ratio sensitive indices from the Lick/IDS system over a two-dimensional field extending up to approximately one effective radius. A discussion of calibrations and offsets is given, as well as a description of error estimation and nebular emission correction. We modify the classical Fe5270 index to define a new index, Fe5270S, which maximizes the usable spatial coverage of SAURON. Maps of H, Fe5015, Mg and Fe5270S are presented for each galaxy. We use the maps to compute average line strengths integrated over circular apertures of one-eighth effective radius, and compare the resulting relations of index versus velocity dispersion with previous long-slit work. The metal line strength maps show generally negative gradients with increasing radius roughly consistent with the morphology of the light profiles. Remarkable deviations from this general trend exist, particularly the Mg isoindex contours appear to be flatter than the isophotes of the surface brightness for about 40% of our galaxies without significant dust features. Generally these galaxies exhibit significant rotation. We infer from this that the fast-rotating component features a higher metallicity and/or an increased Mg/Fe ratio as compared to the galaxy as a whole. The H maps are typically flat or show a mild positive outwards radial gradient, while a few galaxies show strong central peaks and/or elevated overall H-strength likely connected to recent star-formation activity. For the most prominent post-starburst galaxies even the metal line strength maps show a reversed gradient.
keywords:
galaxies: bulges – galaxies: elliptical and lenticular, Cb – galaxies: evolution – galaxies: formation – galaxies: kinematics and dynamics – galaxies: structure1 INTRODUCTION
We are carrying out a survey of the dynamics and stellar populations of 72 representative nearby early-type galaxies and spiral bulges based on measurements of the two-dimensional kinematics and line strengths of stars and gas with SAURON, a custom-built panoramic integral-field spectrograph for the William Herschel Telescope, La Palma (Bacon et al., 2001, hereafter Paper I). The goals and objectives of the SAURON survey are described in de Zeeuw et al. (2002, hereafter Paper II), which also presents the definition of the sample. The full maps of the stellar kinematics for the 48 elliptical (E) and lenticular (S0) galaxies are given in Emsellem et al. (2004, hereafter Paper III). The morphology and kinematics of the ionised gas emission are presented in Sarzi et al. (2006, hereafter Paper V). The stellar and gaseous kinematics of the spiral bulges are described in Falcón-Barroso et al. (2006). Here we present maps of the absorption line strength measurements for the 48 E and S0 galaxies in the survey. The analysis of the line strength maps, and a full analysis of the spiral galaxies in the sample will be presented in later papers of this series. The data and maps presented here will be made available via the SAURON WEB page http://www.strw.leidenuniv.nl/sauron/.
The measurement of absorption line strengths in combination with stellar population models has been used for many years to probe the luminosity-weighted age, metallicity and abundance ratios of certain elements in integrated stellar populations (e.g., Faber, 1973; Burstein et al., 1984; Rose, 1985; Brodie & Hanes, 1986; Bica et al., 1990; González, 1993; Davies et al., 1993; Worthey, 1994; Vazdekis, 1999; Thomas et al., 2003). Integral-field spectroscopy allows to obtain spectroscopic information over a contiguous area on the sky and thus to identify two-dimensional structures (see e.g., Emsellem et al., 1996; Peletier et al., 1999; del Burgo et al., 2001). For the first time we can apply this technique to absorption line strength observations in a large representative sample of early-type galaxies.
One of the most widely-used methods for investigating the optical spectra of old ( Gyr) integrated stellar populations in early-type galaxies is to derive line strength indices in the Lick/IDS system (Burstein et al., 1984; Worthey et al., 1994; Trager et al., 1998), and compare them with stellar population models. We adopt this system in order to allow comparison with existing data. For future analysis we envisage the use of higher resolution line strength systems once they become available.
In this paper we present the SAURON line strength measurements for our 48 representative E and S0 galaxies, together with a brief analysis which focuses on the overall characteristics of the maps. A full stellar population analysis of the line strength maps with the help of stellar population models will be presented in a future paper in this series.
This paper is organized as follows. In Section 2 we summarize our observational campaign, while the data reduction steps are outlined in Section 3, along with a discussion on the flux-calibration of the data. In Section 4 we describe the definition and measurement of the line strength indices. The two-dimensional line strength maps are presented in Section 5, while in Section 6 we discuss line strength gradients and aperture corrections. In Section 7 we discuss average line strength measurements extracted from circular apertures of one-eighth effective radius, respectively, and compare them to the literature. The conclusions follow in Section 8. We comment on individual galaxies in Appendix A.
2 Observations
The SAURON survey of 72 galaxies was carried out during eight observing runs over four years (56 observing nights allocated). Details on the observing conditions, instrument set-up and exposure times are given in Paper III. The SAURON sample of 48 elliptical (E) and lenticular (S0) galaxies is representative of nearby bright early-type galaxies ( ; mag). As discussed in Paper II, it contains galaxies in each of the E and S0 subclasses, equally divided between ‘field’ and ‘cluster’ objects (the latter defined as belonging to the Virgo cluster, the Coma I cloud, and the Leo I group), uniformly covering the plane of ellipticity versus absolute blue magnitude . Tables A1 and A2 in Paper II provide basic information on the objects.
The SAURON survey is carried out with the low resolution mode of the instrument, giving a field of view of , contiguously sampled by 1431 square lenses, each of which produces a spectrum. Another 146 lenses sample a small region from the field center, which are used for simultaneous sky subtraction. The spectral resolution of the observed wavelength range 4800–5380 Å is 4.2 Å (FWHM, ) and sampled at 1.1 Å pixel-1. This wavelength range includes a set of potential emission lines (e.g. H, [OIII], [NI]) and stellar absorption lines (e.g., H, Mg, Fe) which can be used to investigate the stellar populations.
Each galaxy field was typically exposed for s, dithered by about 1″. In 30% of the cases, we constructed mosaics of two or three pointings to cover the galaxy out to about one effective radius , or, for the largest objects, out to . The footprints of these pointings are shown overlaid on a Digital Sky Survey image in Figure 1 of Paper III.
In order to allow for inter-run calibration and provide templates for redshift and velocity dispersion measurements we observed during each run a number of stars covering a broad range of spectral types. Specifically, we included stars from the Lick stellar library catalogue (Worthey et al., 1994) in order to calibrate our line strength measurements to the Lick/IDS system and its associated models (e.g., Worthey, 1994, see also Section 4.2.3). Spectrophotometric standard stars were also observed to calibrate the response function of the system (see Table 1).
3 Data reduction
We reduced the SAURON observations with the dedicated XSAURON software developed at CRAL–Observatoire, and described in Paper I. The basic reduction steps include bias and dark subtraction, extraction of the spectra using a fitted mask model, wavelength calibration, low frequency flat-fielding, cosmic-ray removal, homogenization of the spectral resolution, sky subtraction, and flux calibration. The wavelength calibration is accurate to Å ( , rms).
Multiple exposures of the same galaxy were merged and mosaiced together. In this process the wavelength domain was truncated to a common range and the datacubes re-sampled to a spatial scale of with orientation North up and East to the left. In order to allow for a meaningful analysis the final data-cubes were spatially binned to a minimum S/N of 60 per Å using an adaptive scheme developed by Cappellari & Copin (2003). In this approach, the spectra are co-added by starting from the highest S/N lenslet, and accreting additional lenslets closest to the current bin centroid. A new bin is started each time the target S/N is reached. The resulting bin centroids are then used as starting points for a centroidal Voronoi tessellation, ensuring compact non-overlapping bins and a uniform S/N in faint regions. The binning used in this paper is identical to the one used in Paper III and V.
In the following we describe in more detail how the flux calibration was derived, since this is an important issue for the derivation of line strength indices which was not covered in detail in previous papers of this series. We also summarize the removal of emission lines which is another important step before the measurement of absorption line strength.
3.1 Flux calibration
3.1.1 Overall flux calibration
During each observing run a number of spectrophotometric standards were observed, typically close to the center of the field of view (hereafter FoV) of SAURON (see Table 1). As a first step we evaluated the inter-run consistency of the spectral response function of SAURON. For this purpose we investigated the relative changes in the spectral response function in repeat observations of six flux standard stars. In this analysis we are only interested in the relative changes so we eliminated the overall throughput difference by normalizing each set of observations of the same star in a 100 Å region in the middle of the wavelength range. In total, 22 repeat observations111Note, that some flux standard stars were observed multiple times within one run. were used.
The results are presented in Figure 1. The relative run-to-run deviations in spectral response are smaller than 1% ( standard deviation) over the full wavelength range. An analysis of the variations in absolute throughput for 13 standard stars observed in photometric nights during the survey gives a standard deviation of 5%. No significant run-to-run variations could be established. Since the overall stability of the instrument is satisfactory we adopt a common flux calibration curve for all runs which is described in the following.

In order to establish an absolute flux calibration for our spectra a two step procedure was adopted: i) a relative spectral response function was established which maps throughput variations on 100 Å scales introduced by a wavelength selection filter in the instrument (see Paper I); ii) the flux calibration tables compiled by Bohlin et al. (2001, “CALSPEC” directory) were used to establish an absolute calibration of the SAURON system.
The first step in the calibration procedure is necessary since small-scale variations cannot easily be removed by the coarse wavelength steps of classical flux calibration tables. Furthermore, it is not uncommon to find large residuals at the position of absorption features (e.g., H). To overcome these problems we observed in runs 4, 5, & 7 the white dwarf EG 131 (see Paper III). This star shows an exceptionally smooth continuum over the SAURON wavelength range, and in particular does not show any notable H absorption (M. Bessel, private communication). This makes it an ideal calibration star to remove small-scale continuum variations. Unfortunately, there is no absolute flux calibration available for EG 131, but the energy distribution of a black-body with a temperature of 11800 K can be used to define the continuum (M. Bessel, private communication).
Figure 2 shows the result from our analysis of the flux standard stars. We find several “wiggles” with a peak-to-peak amplitude of up to 3%. These wiggles, primarily derived from the observations of EG 131, can be confirmed in an independent way with the standard star G191B2B since Bohlin et al. (2001) provide a model flux calibration curve at a similar resolution as the SAURON observations. This model flux curve is of very high quality and provides accurate flux values even at small wavelength intervals. Both standard stars, EG 131 and G191B2B give consistent results. In order to establish the absolute flux calibration curve for the SAURON survey we used all flux standard stars listed in Table 1 and the corresponding flux tables given in Bohlin et al. (2001).

| Name | Run observed | Calibration |
| (1) | (2) | (3) |
| Feige 34 | 5,6,7 | STIS+Oke |
| Feige 66 | 1,3 | FOS+Oke |
| G191B2B | 1,4,5,6 | Model |
| HZ 44 | 1,3 | STIS |
| BD 4211 | 2,4 | STIS |
| BD 2642 | 7 | FOS+Oke |
| HD 09352 | 5 | STIS |
| EG 131 | 4,5,7 | - |
Notes: Listed are the spectrophotometric standard stars which were used to establish the flux calibration curve for the SAURON system. Column (1) lists the name of the star while column (2) gives the run where the star was observed (see Paper III). Column (3) denotes the type of calibration file which was used for the absolute flux calibration (see Bohlin et al., 2001, for details). The star EG 131 is a special continuum correction star. See text for details.
Before applying the overall flux calibration curve to our data the observed spectrum is corrected for airmass according to the average extinction curve for La Palma (King, 1985). The spectra are not corrected for Galactic extinction since the correction would be negligible over the observed wavelength range.
Although we derive from the photometric standard star observations a very stable behavior of the instrument and a well calibrated flux curve, we cannot directly transfer this conclusion to the full data set. For example, variations as a function of field of view and sky-subtraction errors for low signal-to-noise regions can have a significant effect on the flux calibration accuracy.
3.1.2 Continuum correction for line strength indices
An analysis of our H line strength measurements showed that we find non-physically strong absorption strengths in the outer bins of some galaxies often at the right side (as shown in Figure 3) of the FoV. A closer inspection revealed that the abnormal H absorption strength is mainly caused by a wrong continuum shape across the H region. In the outer bins typically many individual lenslets need to be summed up in order to reach our minimum target S/N of 60. Therefore, any systematic errors, such as imperfect tracing of the spectra on the CCD or sky subtraction, will be present in the final binned spectrum. Unfortunately we were unable to remove these errors in our data reduction and thus decided to correct the continuum in the binned spectrum.
In order to obtain a good template spectrum for each galaxy we derive the optimal template for an average spectrum, within a 10″ radius, of each galaxy. This optimal template is the weighted combination of 19 spectra, spanning a range in age and metallicity, from the library of stellar population models of Vazdekis (1999), and additionally six spectra from the Jones (1997) stellar library from which the Vazdekis models are built to provide spectra with large Mg absorption strengths (for details see Paper III). The optimal template is obtained from an emission line corrected (see Section 3.2) average spectrum, by simultaneously fitting the stellar kinematics together with the templates, and using a low-order polynomial.
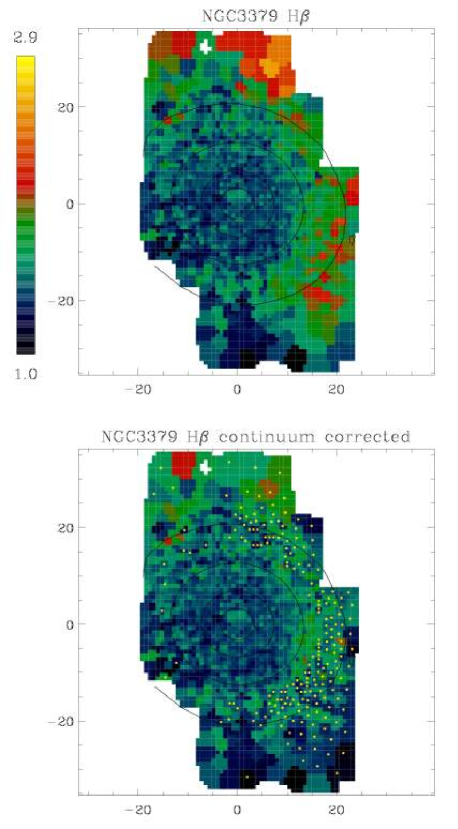
For each individual bin of the galaxy in question we fit this optimal template, with the kinematics fixed to the values of Paper III, together with an 11th order multiplicative polynomial continuum over the full wavelength range of the spectrum. Then in a second step we check if the continuum fit shows significant second and higher order structure over the wavelength range of the H index. Linear continuum variation does not affect the measured line strengths. Only for bins covering more than one lenslet and where we detect a significant222The rms deviations are greater than 0.006 after the removal of a straight line fit. continuum variation we divide by the continuum fit and thus apply the continuum correction before measuring the H index. All bins which have been continuum corrected show a flag in the data-cubes of the public release and furthermore, we added (in quadrature) a constant systematic error of 0.1 Å to the H index of corrected bins. The typical fraction of corrected bins in a data-cube is 4% while the extremes go from 1% to 33%. As an example Figure 3 shows the full H map of NGC 3379 before and after the continuum correction.
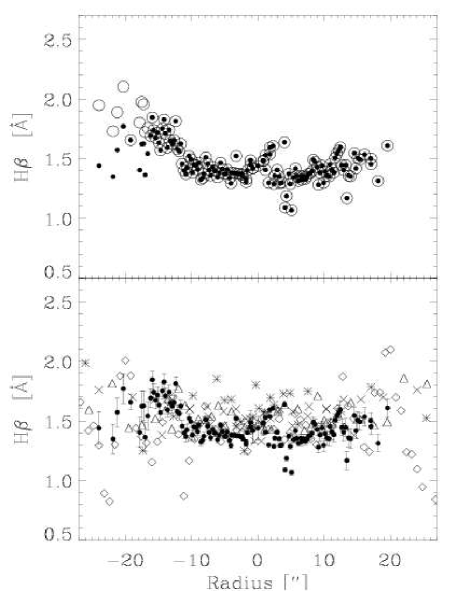
In Figure 4 we show a simulated long-slit observation of the H absorption strength along the major axis of NGC 3379 derived from the SAURON data before and after the continuum correction. The top panel clearly shows the points at large negative radii where the continuum has been corrected. The literature comparison (bottom panel) shows a good agreement.
The success of our continuum correction is critically dependent on the ability of the optimal template to fit the observed spectrum. In general this may be a problem if the galaxy shows non-solar abundance ratios which are not mimicked by the template library. However, in the case of H the index is only weakly dependent on abundance ratio (Trager et al., 2000; Thomas et al., 2003) and thus the method works well. Continuum variations can in principle also affect other indices such as Fe5015 and Mg . Maps of Fe5015 are clearly affected, while Mg maps show evidence of continuum problems for only a handful of galaxies. For metal indices abundance ratios are a critical issue. The continuum variations and unaccounted abundance ratio differences between the galaxy spectrum and the optimal template are largely degenerate (at least for our data and models). Thus we decided not to correct the Fe5015, Mg and Fe5270S indices. For selected galaxies we remove bins which suffer from significant continuum problems (see also Section 5).
3.2 Emission-line corrections
Many early-type galaxies show signs of relatively weak emission from ionized gas and dust in the interstellar medium (e.g., Goudfrooij et al., 1994). Three out of four of the main absorption line features in the SAURON wavelength range are potentially affected by emission lines; namely, H, [OIII], [OIII], and [NI]. Before measuring absorption line indices these emission lines, where present, need to be removed taking into account that the gas kinematics can be decoupled from the stellar kinematics. This is done as part of our efforts to analyze the emission lines themselves. The emission-line measurements and results were described in detail in Paper V. Here we give only a short summary.
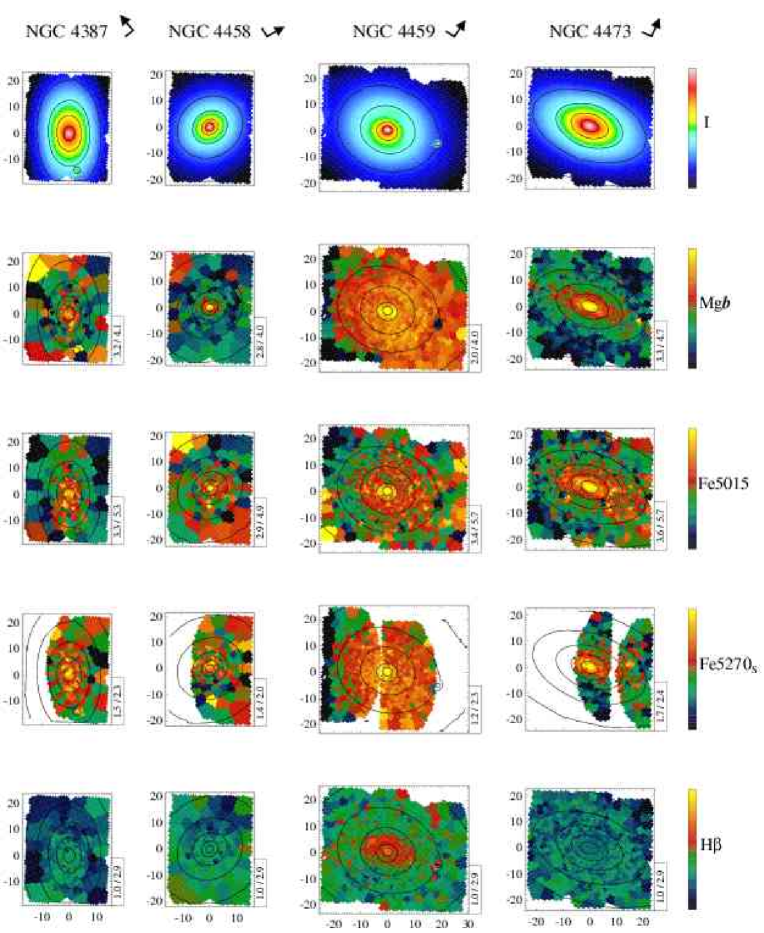
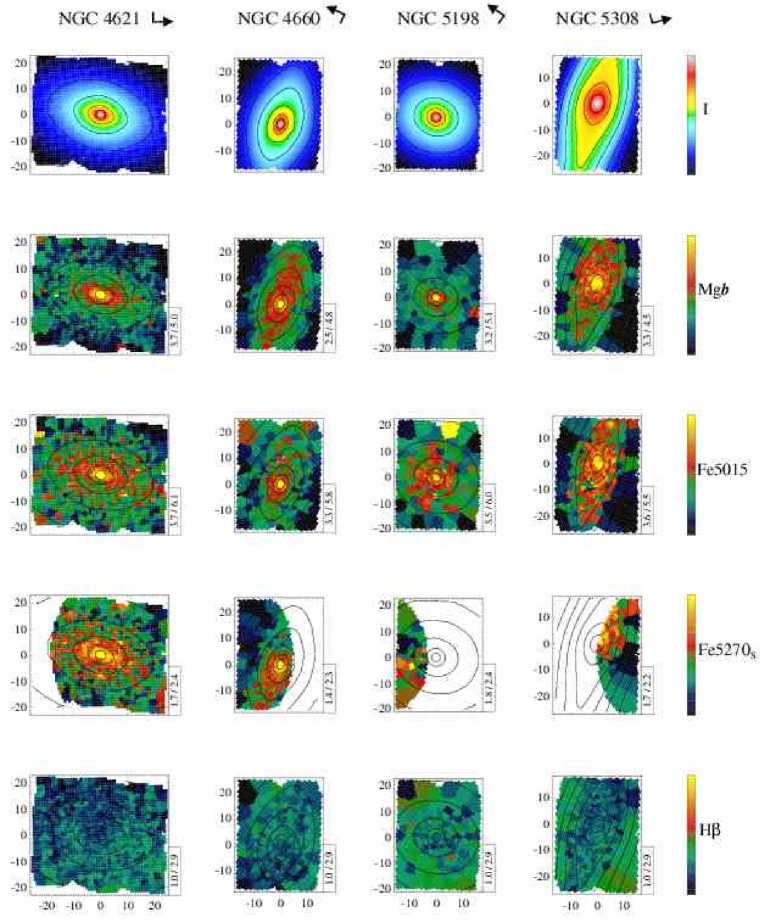
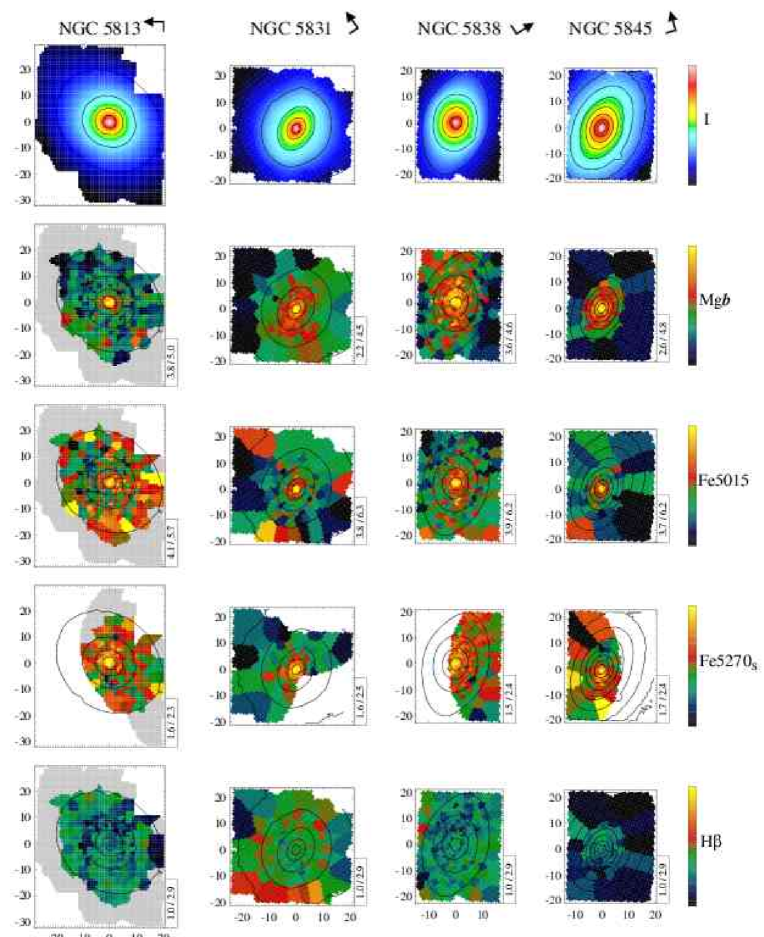
For five galaxies we find no emission above our detection limit (NGC 821, NGC 2695, NGC 4387, NGC 4564, and NGC 5308); for a further seven galaxies we find only weak evidence for emission (NGC 4270, NGC 4382, NGC 4458, NGC 4473, NGC 4621, NGC 4660, and NGC 5845), while all of the remaining galaxies in our survey show clear signs of emission. All emission lines are modeled with a simple Gaussian profile. Using the stellar kinematics derived in Paper III we re-derive the best fitting, optimal stellar template333The composition of the template library was improved with respect to the one used in Paper III. Three stars from the Jones (1997) library were exchanged with more suitable ones which allowed a better match of the spectral characteristics in large early-type galaxies and thus an improved emission correction. The effects on the derivation of the stellar kinematics are negligible. in combination with the best fitting emission template featuring [OIII] only. While the [OIII] strengths and kinematics are free parameters in this first step, the regions of potential H and [NI] emission are masked. If no significant [OIII] emission is found we assume that there is also no H and [NI]. This limits our ability to measure weak emission associated with star-formation regions where H / [OIII] . This is an unavoidable consequence of the fact that weak H emission cannot always reliably be measured without constraining its kinematics. Whether emission is found or not is determined by a measure of the amplitude of the emission lines with respect to the level of both statistical and systematic deviations from the fit to the stellar continuum. As a cutoff we use an amplitude-over-noise (hereafter A/N) ratio of 4. This corresponds to a detection limit of 0.1 Å in the central, high S/N, parts of the line strengths maps and is reduced to approximately 0.2 Å in the outer parts.
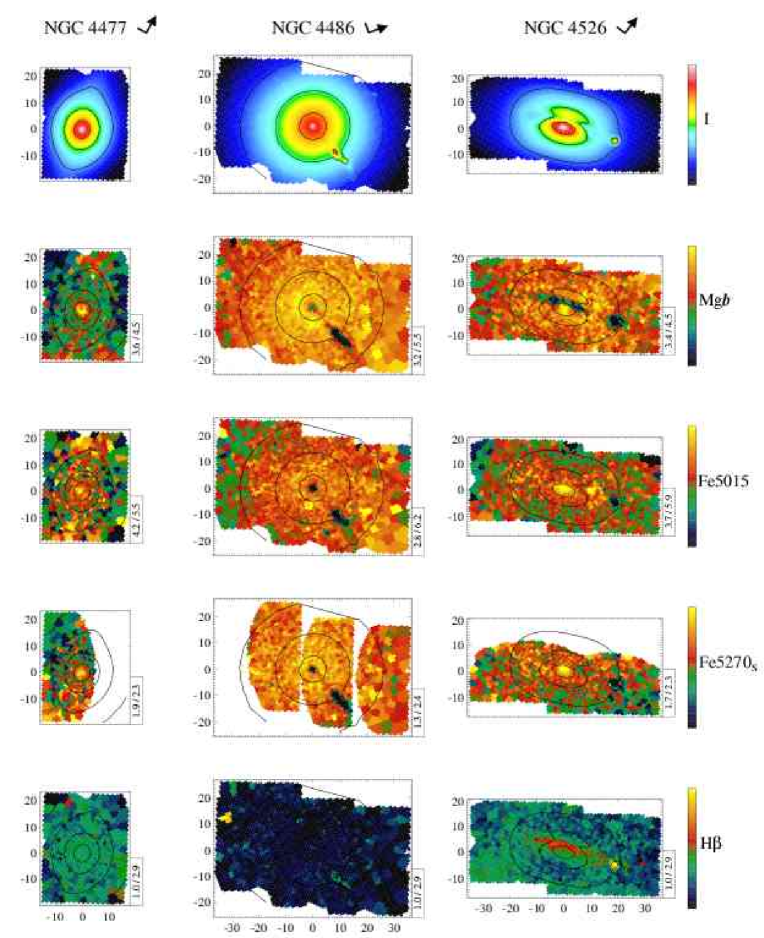
If we find significant [OIII] emission we re-fit the galaxy spectrum allowing for potential H and [NI] emission. For galaxies with weak emission lines we constrain the H and [NI] emission kinematics to be the same as the [OIII] ones. For ten galaxies (NGC 2768, NGC 3032, NGC 3414, NGC 4278, NGC 4374, NGC 4459, NGC 4486, NGC 4526, NGC 5838, and NGC 5846) with relatively strong emission we are able to fit the H emission kinematics independently while the [NI] kinematics are tied to H (see Paper V for details). The A/N detection limits for H is set to 3 and 5 for the constrained and unconstrained kinematics, respectively. The detection limits for H emission are 0.06 Å and 0.2 Å in the inner and outer parts of the galaxies, respectively.
For [NI] the A/N detection limit is always set to 4. We note that especially for the [NI] emission line the dominating source of noise is not shot noise from the spectrum, but template mismatch due to unaccounted for non-solar abundance ratios in the galaxies. We therefore measure the A/N ratio for the [NI] emission line in the Mg region which is a good guide for the degree of template mismatch. Due to the difficulty of quantifying the effects of template mismatch, the detection limits of the [NI] line are not well established. They will be, however, similar to the [OIII] detection limits and somewhat larger for objects with large non-solar abundance ratios.
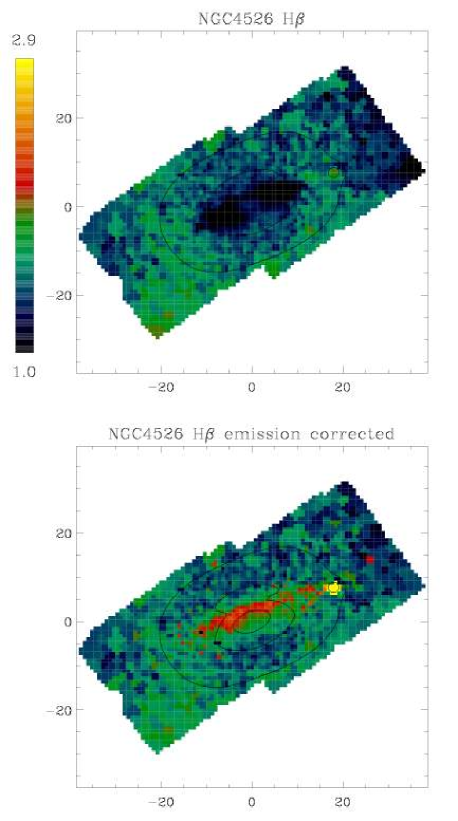
In Figure 5 we show an example map for the emission correction of the H feature. NGC 4526 has an inclined dust disk in the central (see Paper V) showing very regular gas kinematics and a circumnuclear region with particularly strong H emission. After emission correction a relatively thin elongated region of strong H absorption coinciding with the dust disk appears. This example is representative of the strongest emission corrections in our data.
Many previous authors corrected for H emission using an average ratio between the [OIII] and H lines. For instance Trager et al. (2000) concluded that 0.6 times the [OIII] emission is a reasonable estimate for the H emission. However, in their sample of 27 galaxies the correction factor varies from 0.33 to 1.25 and it is therefore doubtful whether this correction is accurate for an individual galaxy (see also Mehlert et al., 2000). We confirm this with our data (see Figure 6) and find a median correction factor of 0.67 with a range from 0.3 to 2.3. There is weak evidence that the average correction factor is a function of emission strength, becoming smaller at large [OIII] strength. More importantly, we point out that emission line ratios generally vary significantly across the galaxies (see error bar in Figure 6 and [OIII]/H maps in Paper V). NGC 3032 shows an exceptionally large ratio of H/ [OIII] , pointing towards ongoing star-formation over a significant area of the galaxy.

4 The line strength measurements
Here we describe which line strengths indices we use for the SAURON survey, the calibration of our measurements to the standard Lick/IDS system and the evaluation of the line strength errors.
4.1 Line strength indices
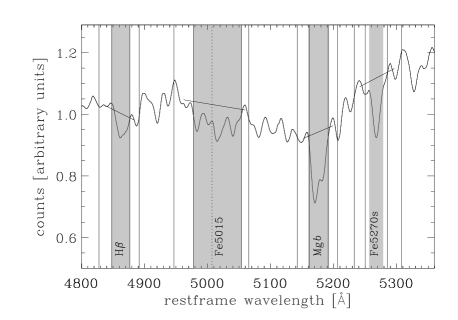
In the Lick/IDS system absorption line strengths are measured by indices, where a central feature bandpass is flanked to the blue and red by pseudo-continuum band-passes (see Figure 7). The mean height in each of the two pseudo-continuum regions is determined on either side of the feature bandpass, and a straight line is drawn through the midpoint of each one. The difference in flux between this line and the observed spectrum within the feature bandpass determines the index (Trager et al., 1998). For most absorption features, the indices are expressed in angstroms of equivalent widths444For broad molecular bands, the index is expressed in magnitudes. No such indices are used in the SAURON system..
The exact wavelength definitions of the indices, the observed wavelength range and the redshift of the object determine which indices can be measured. The full wavelength range of SAURON is 4760–5400 Å. However, the tilting of the wavelength selection filter in order to avoid ghost images, reduces the usable wavelength range common to all lenslets to approximately 4825–5275 Å (see Paper I). For the nearby sample of SAURON galaxies (i.e., ), this wavelength range allows us to measure three Lick/IDS indices: H, Fe5015 and Mg (see Table 2).
The usable wavelength range is a well-determined function of position on the CCD. The red wavelength limit is most affected, and varies from 5275 to 5380 Å over the FoV. For lenslets with a red-extended wavelength coverage we can measure a further Lick/IDS index: Fe5270. It is desirable to measure this index since it is an important ingredient to investigate the Mg-to-Fe abundance ratios in integrated stellar populations (Worthey et al., 1992).
Since the red wavelength cutoff is a monotonic function across the field of view, by making the red bandpass of the Fe5270 index as blue as possible, we effectively increase the usable field of view. For this reason we have designed a new index for the Fe5270 absorption feature with a reduced red wavelength coverage. The bandpass definitions of all indices used for the SAURON survey are summarized in Table 2.
The main aim of the re-definition of the Fe5270 index is to increase the effective field of view. A useful re-definition of the index should also, however, obey the following conditions: (i) small and well-determined line of-sight-velocity-distribution (hereafter LOSVD) corrections (see Section 4.2.2); (ii) good Poisson statistics; (iii) similar sensitivity towards changes in age, metallicity and abundance ratios as the original Lick/IDS Fe5270 index in order to allow easy conversion.
In order to evaluate the optimal new index definition we first created a catalogue of model spectra resembling typical SAURON observations of early-type galaxies. In fact we employed the same model spectra library as used for the optimal template determination (see Paper III) and the LOSVD corrections (see Section 4.2.2). By using this model library we cover reasonably well the range of expected observations for the Fe5270 absorption feature.
All six wavelength values (see Table 2) which define an index were systematically changed in 0.5 Å steps until an optimal definition555The index definition was optimized at the instrumental resolution of SAURON ( ) in order to allow for the new generation of stellar population models which will be able to make predictions at this spectral resolution. was found. The bluest wavelength definition of the red pseudo-continuum which still gives reasonable LOSVD corrections and error statistics for the index turns out to be 5308.0 Å. This is a reduction of Å in the red-most limit of the original Lick/IDS definition, equivalent to an increase in the field of view of 13%.
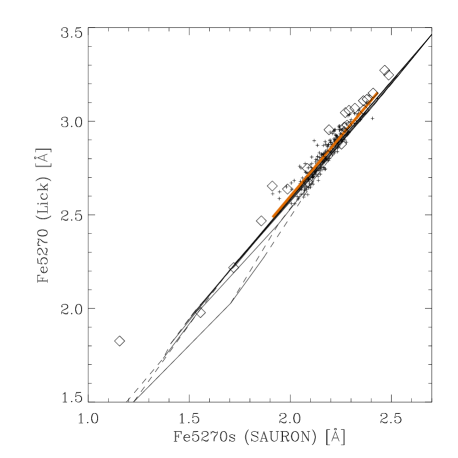
The LOSVD correction for a purely Gaussian LOSVD for the new index is only 5.1% at 200 as compared to 10.3% for the original index. While the index could be improved in terms of its velocity dispersion corrections and Poisson statistics it also shows a good linear relation with the original Lick/IDS index, i.e., it shows a similar dependence on age and metallicity (see Figure 8). Fortunately, the re-definition of this index did not significantly change its overall sensitivity to abundance ratios (Korn et al., 2005). The best fitting linear relation determined from stellar population models of Vazdekis (1999) with ages Gyr is:
| (1) |
The formal errors of the fit are smaller than . In this paper we use the above equation to convert our Fe5270S measurements to the Lick Fe5270 index. We note, an empirically determined conversion formula compares well (Fe5270 = Fe5270S + 0.03; see Figure 8).
In order to maximize the information for the line strength indices we produce for each galaxy two data-cubes: one containing the H, Fe5015 and Mg indices for the full field of view and one presenting the new Fe5270S index for a reduced field of view. Due to the adaptive two-dimensional binning, the final spatial sampling of the two data-cubes is not identical.
| Index | Blue pseudo-continuum | Central bandpass | Red pseudo-continuum | Units | Source |
|---|---|---|---|---|---|
| H | 4827.875 – 4847.875 | 4847.875 – 4876.625 | 4876.625 – 4891.625 | Å | Trager et al. (1998) |
| Fe5015 | 4946.500 – 4977.750 | 4977.750 – 5054.000 | 5054.000 – 5065.250 | Å | Trager et al. (1998) |
| Mg | 5142.625 – 5161.375 | 5160.125 – 5192.625 | 5191.375 – 5206.375 | Å | Trager et al. (1998) |
| Fe5270 | 5233.150 – 5248.150 | 5245.650 – 5285.650 | 5285.650 – 5318.150 | Å | Trager et al. (1998) |
| Fe5270S | 5233.000 – 5250.000 | 5256.500 – 5278.500 | 5285.500 – 5308.000 | Å | This paper |
4.2 Calibration to the Lick/IDS system
In order to allow a meaningful comparison between stellar population model predictions and observed data, the index measurements need to be carefully calibrated to the Lick/IDS system. There are three effects to account for: (a) the difference in the spectral resolution between the Lick/IDS system and the SAURON instrumental set-up; (b) the internal velocity broadening of the observed objects and (c) small systematic offsets caused by continuum shape differences (Worthey & Ottaviani, 1997; Kuntschner, 2000).
In the following paragraphs we describe the individual steps taken to ensure an accurate calibration of the SAURON data to the Lick/IDS system.
4.2.1 Spectral resolution correction
First we need to adjust for the difference in spectral resolution between the Lick/IDS system and the SAURON observations for line strength measurements. The nominal resolution of the Lick/IDS system in the SAURON wavelength range is Å (FWHM) with a mean of 8.4 Å (Worthey & Ottaviani, 1997). We degrade our spectra to approximately the Lick/IDS resolution by broadening to an instrumental resolution of .
4.2.2 Line of-sight-velocity-distribution corrections
The observed spectrum of a galaxy is the convolution of the integrated spectrum of its stellar population(s) by the instrumental broadening and line of-sight velocity distribution (LOSVD) of the stars. These effects broaden the spectral features, in general reducing the observed line strength compared to the intrinsic values. In order to compare the index measurements for galaxies with model predictions we calibrate the indices to zero velocity dispersion and the nominal Lick/IDS resolution.
In the past, most authors have only taken into account the first moments, and , of the LOSVD to correct the line strengths indices. However, with the availability of high quality measurements of the higher order terms and which describe non-Gaussian deviations (see e.g., Paper III) we need to apply more accurate corrections. Typically a non-zero term does not affect the Lick indices significantly, but a non-zero term can have significant effects (Hau, 1998; Kuntschner, 2004).
In order to determine the corrections for each index we use the optimal template determined for each spectrum individually during the derivation of the kinematics (for details see Paper III). Generally, this optimal template is a good representation of the galaxy spectrum. For each spectrum a correction factor, , is determined such that
| (2) |
where is the index measured from the optimal template convolved to the Lick resolution and additionally convolved with the LOSVD given in brackets. A LOSVD corrected index is then .
4.2.3 Lick/IDS offsets
Although we matched the spectral resolution of the Lick system, small systematic offsets of the indices introduced by continuum shape differences are generally present (note that the original Lick/IDS spectra are not flux calibrated). To establish these offsets we compared our measurements for stars in common with the Lick/IDS stellar library (Worthey et al., 1994). In total we observed 73 different Lick/IDS stars with 174 repeat observations666Since the stars have only small relative velocities and were typically observed at the center of the SAURON field of view we were able to measure the original Lick/IDS index Fe5270 for all stars..
Figure 9 shows the difference between Lick/IDS measurements and ours, where repeat observations of the same star were averaged. The mean offsets and associated errors for each index are evaluated by a biweight estimator to minimize the influence of outliers and are summarized in Table 3. The formal error in the offset is taken to be the standard error on the mean / .
As an independent test of this procedure, we compare the Lick/IDS measurements for the 42 galaxies in common with our survey777In the Lick/IDS survey the Mg , Fe5015, and H indices are not available for one, three and two galaxies, respectively.. This is more difficult than the similar comparison for stars since for galaxies, e.g., aperture differences and seeing variations can affect the results. In order to match the Lick/IDS standard aperture of 144″ we extracted the luminosity-weighted mean of a circular aperture with radius from each line strength map. It would in principle be better to extract the exact Lick aperture: this is however not possible since the position angles of the Lick observations are unknown to us. For this comparison the SAURON measurements were not corrected for emission but internal line broadening was taken into account (see Section 4.2.2).
The results are overplotted in Figure 9 as open diamonds and the offsets, evaluated with a biweight estimator, are listed in Table 3. The overall offsets inferred from the galaxies are in good agreement with the offsets derived from the stars. To further test the offsets for Lick indices derived from flux calibrated data we made use of the Jones (1997) library. First the data was broadened to the spectral resolution of the Lick/IDS system with a wavelength dependent Gaussian assuming a constant spectral resolution of FWHM = 1.8 Å for the Jones stars. Then we compared the index measurements for the 128 stars in common between the Jones library and the Lick observations (Worthey et al., 1994). The offsets and associated errors, derived with a biweight estimator, are listed in Table 3, column 4 (see also, Norris et al., 2006) and are in good agreement with the offsets derived from the SAURON observations for the H and Fe5015 indices. The agreement for the Mg and Fe5270 indices is less good, but differences are still small with offsets Å. Furthermore, our determination of Lick offsets derived from Jones stars is in excellent agreement with an earlier investigation carried out by Worthey & Ottaviani (1997, Table 9). Although the offsets are small, they can significantly change the age and metallicity estimates. Particularly, the H index presents a problem, since one can find with the currently available stellar population models age estimates older than the age of the universe if offsets are applied. In the end we decided to apply Lick offsets only for the H and Fe5015 indices (see Table 3, column 5) since all three offset determination methods give consistent results. For the Mg and Fe5270 indices no offsets are applied since the SAURON stellar observations indicate offsets consistent with zero. For all indices we quote conservative offset errors which reflect the information derived from the stars and galaxies.

| Index | Offset (stars) | Offset (galaxies) | Offset (Jones stars) | Applied offsets |
|---|---|---|---|---|
| (1) | (2) | (3) | (4) | (5) |
| H | Å | Å | Å | Å |
| Fe5015 | Å | Å | Å | Å |
| Mg | Å | Å | Å | Å |
| Fe5270 | Å | – | Å | Å |
Notes: Column (1) gives the index name, while column (2) and (3) give the mean offset (Lick - SAURON) to the Lick/IDS system evaluated from the stars and galaxies in common, respectively. Column (4) shows the offsets derived from the comparison of the Jones (1997) library to the Lick/IDS observations for stars in common. Column (5) shows the final offsets we applied to our data and their mean adopted error.
4.3 Estimating errors for line strength indices
Several authors have evaluated the sources of errors for line strength indices (Cardiel et al., 1998, and references therein). They can be divided into random and systematic errors. The treatment of systematic errors is generally very difficult, while the random errors can be determined quite accurately. In the following paragraphs we concentrate on the random errors.
The main ingredient to evaluate the random errors for line strength indices in the SAURON system are the noise spectra which are provided by the data reduction procedure for each individual lenslet (see Paper I). The noise spectrum represents the errors propagated through the full data-reduction until the final, merged and binned data-cube from which velocities, velocity dispersions, line strength indices etc. can be determined.
Before measuring a given index on a spectrum one needs to know: a) the average recession velocity in order to place the index band-passes correctly and b) a measure of the LOSVD in order to correct the index for broadening effects (see Section 4.2.2). Both parameters have associated uncertainties (for details see Paper III) which will contribute to the final index error.
For each galaxy, the random error for each index measurement was estimated via a Monte Carlo approach. For every spatial bin, N realizations of the associated spectrum were produced based on its corresponding noise distribution (assumed to be Gaussian). Likewise, N values of the recession velocity and velocity dispersion were chosen within the uncertainties of their measured values, thus creating a total number of N3 realizations of the measured index, from which the rms uncertainty was determined. A typical number for N in our analysis was 30. For bins where emission in H, [OIII] or [NI] was detected and subtracted we add the associated errors in quadrature (see Section 3.2 and Paper V).
Concerning the systematic errors we consider two main contributions: (i) errors from the continuum correction for the H line strengths and (ii) the error in the calibration to the Lick system. The continuum correction errors (see Section 3.1.2, assumed to be at a constant level of 0.1 Å) are added to the affected bins while the Lick system offsets are quoted in Table 3 and are not added to the individual data points, but shown as global offset errors in figures.
5 Observed Line strength Maps
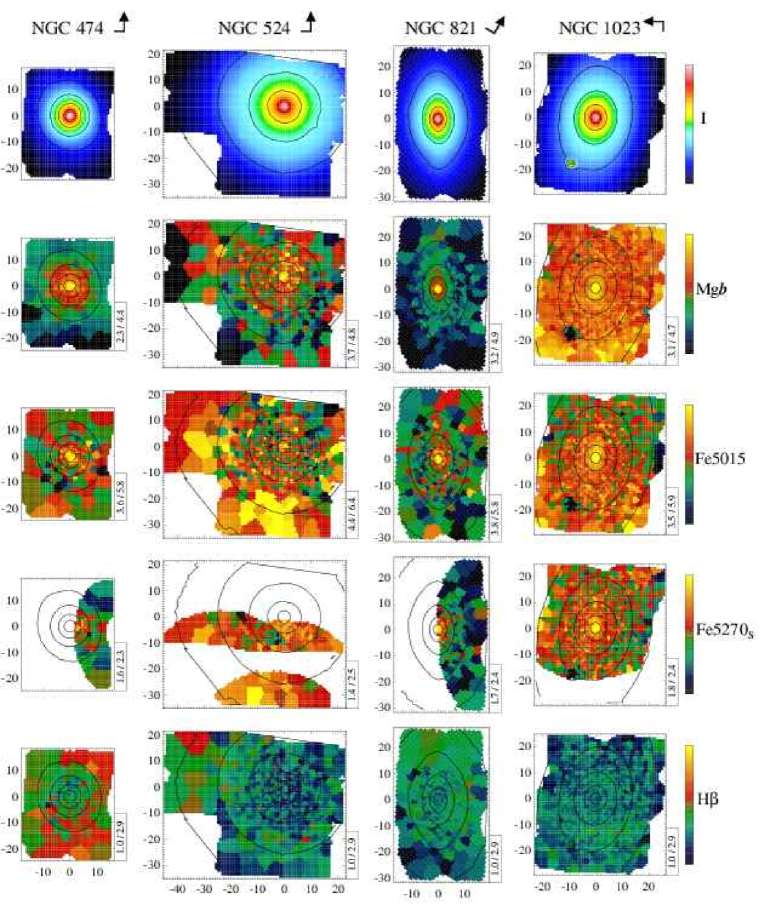
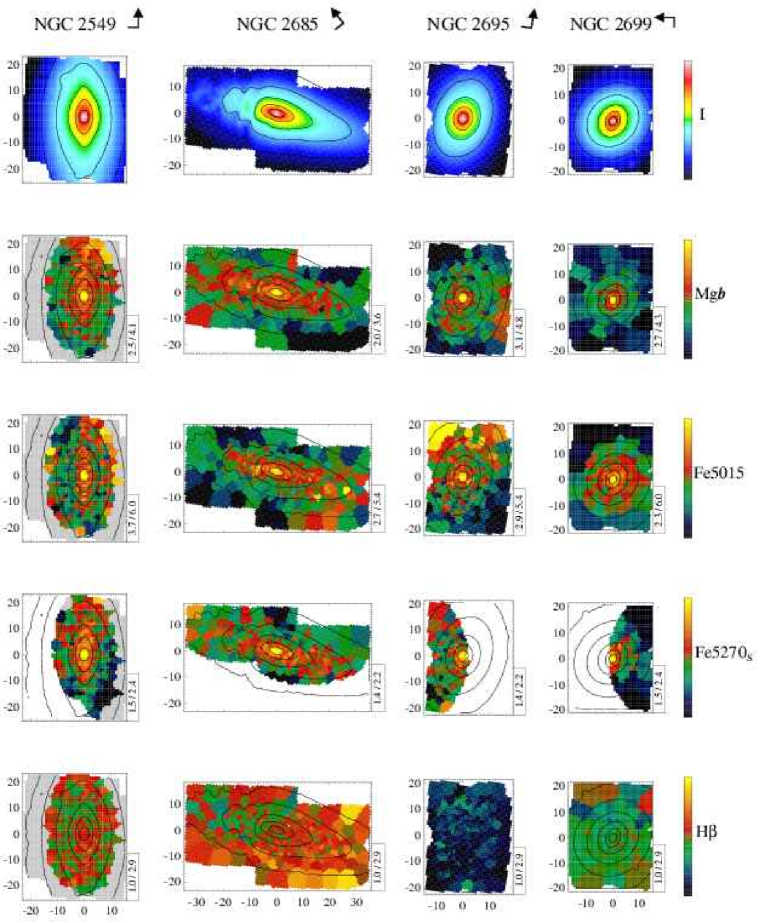
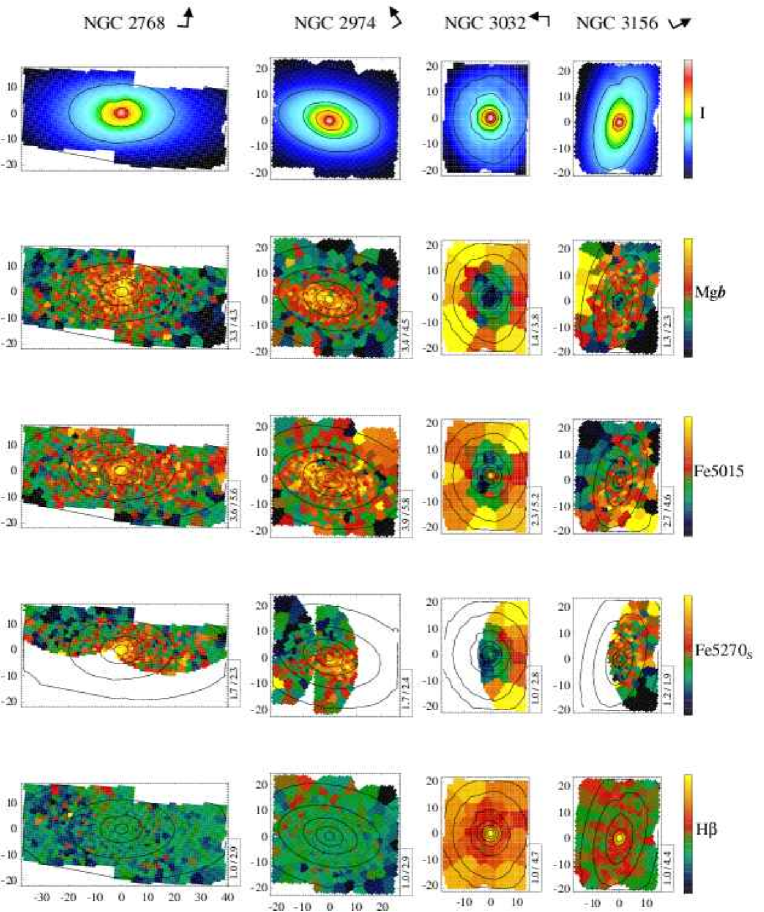
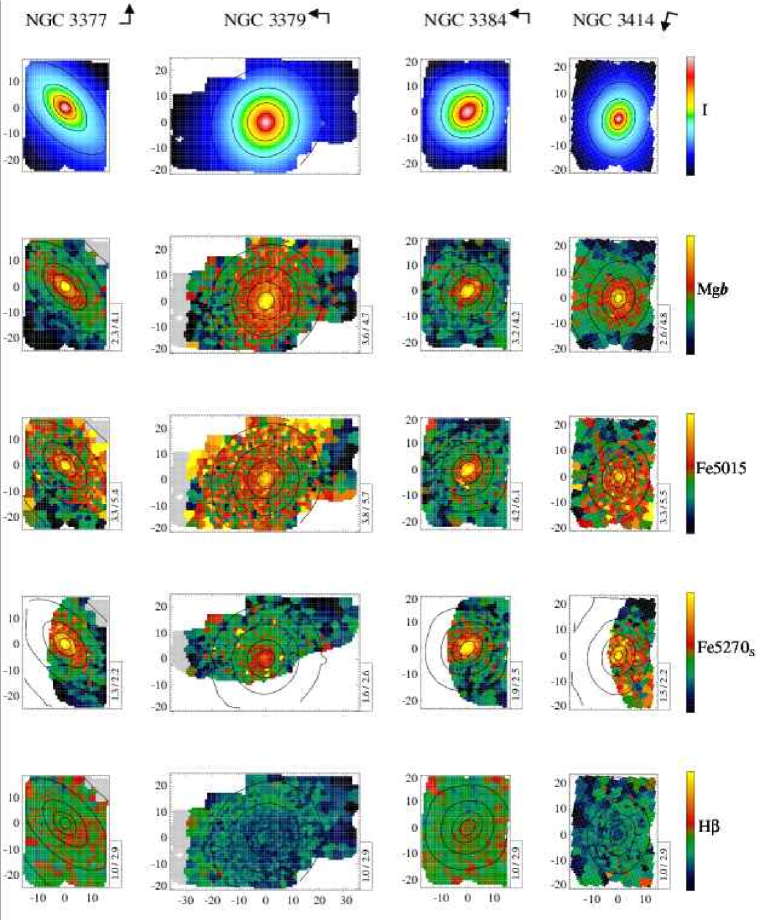
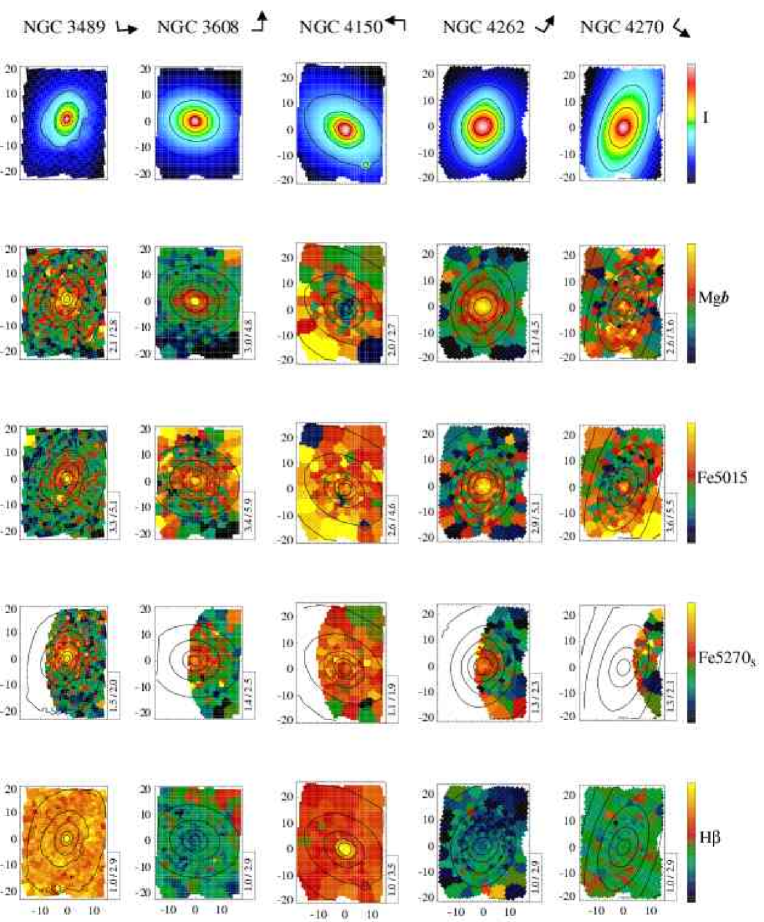
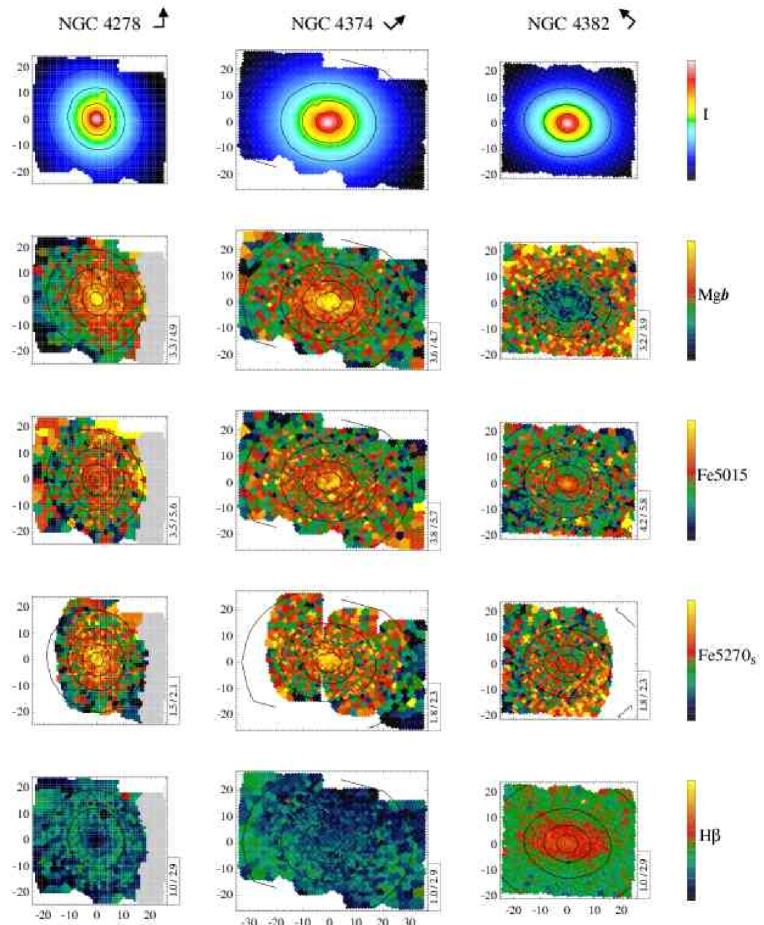
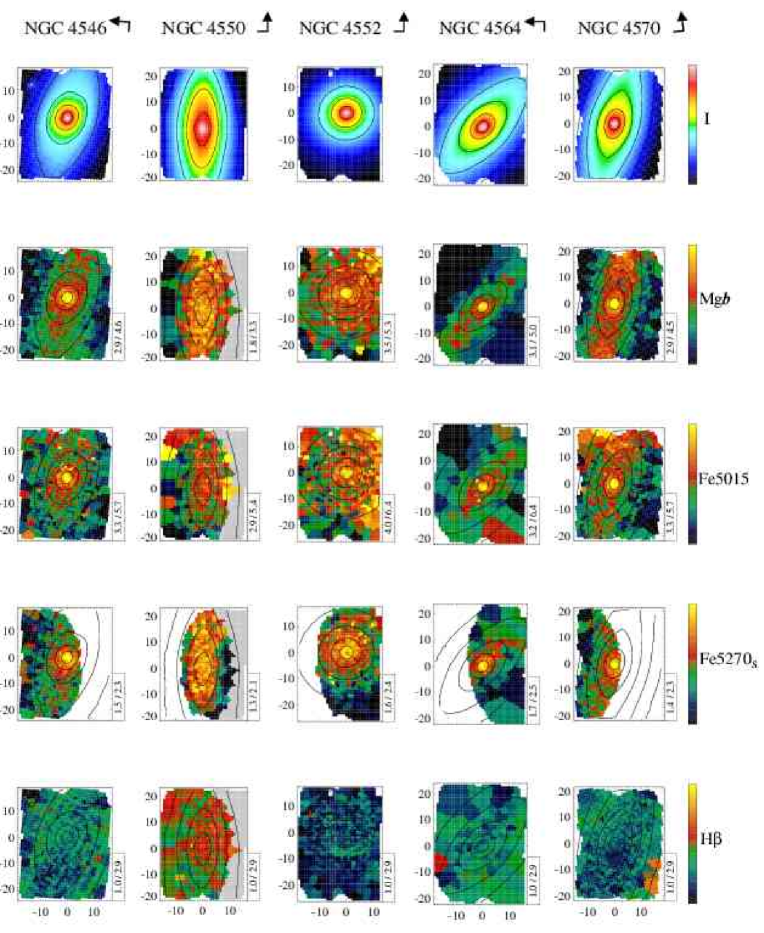
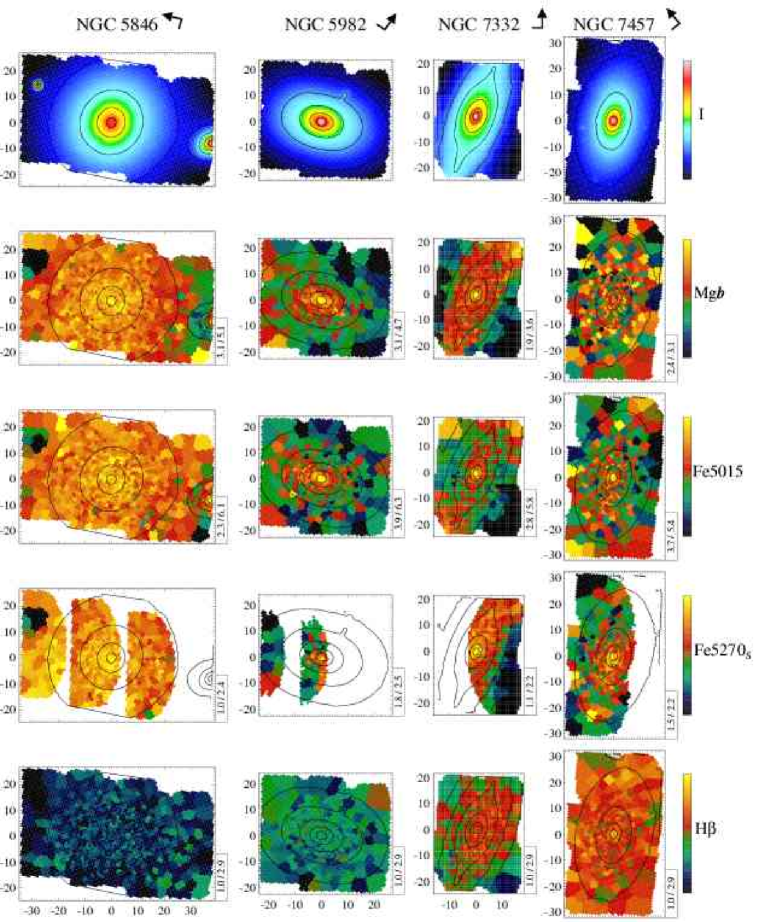
Figures 17a-17l below present maps of the absorption line strengths of the 48 objects, ordered by increasing NGC number. For each galaxy we show the total intensity reconstructed from the full wavelength range of the SAURON spectra (see also Paper III), and the two-dimensional line strength distributions of Mg , Fe5015, Fe5270S and H, overplotted with isophotes of the reconstructed image spaced by single magnitude steps. The maps are all plotted with the same spatial scale, and oriented with respect to the SAURON field for presentation purposes. The relative directions of north and east are indicated by the orientation arrow next to the galaxy title (we note that the orientation and binning of the maps is identical to Papers III and V). The maximum and minimum of the plotting range is given in the tab attached to each parameter map, and the color bar indicates the color table used. In order to allow for an easy comparison between galaxies the plotting range of the H maps is fixed to 1.0 – 2.9 Å (with the exception of NGC 3032, 3156, 4150 which show larger H absorption strengths in the central parts). The colors are adjusted such that blue to green shades correspond to the H strength predicted for old stellar populations (12 Gyr), while stronger H, corresponding to the presence of younger stellar populations, are represented by red and yellow shades (see e.g., Thomas et al., 2003). For the metal line maps we use an independent plotting range for each galaxy in order to better visualize the line strengths gradients across the maps.
For some galaxies we found non-physically large values of the Fe5015 line strength in the outer regions where many individual lenslets are averaged to achieve the target S/N of 60. The same effect can be seen to a much lesser extent in Mg maps. Similar to the continuum variations which cause some of the H measurements to be corrupted in the outskirts, we suspect that the Mg and Fe5015 indices are also affected (see Section 3.1.2). Due to the degeneracy between abundance ratio variations and continuum effects we cannot apply a continuum correction for the metal lines. Therefore, we decided to remove the most affected bins by hand from the final data-cubes. These bins are indicated with grey color in the line strength maps presented in Figures 17a-17l.
5.1 Overview of the line strength maps
The maps in Figures 17a-17l show a wealth of structures and we give comments on individual galaxies in Appendix A. Some general trends are apparent and we discuss these briefly in the following. A full stellar population analysis of the line strength maps with the help of stellar population models will be presented in a future paper in this series.
The metal line strength maps often show negative gradients with increasing radius roughly consistent with the morphology of the light profiles. Remarkable deviations from this trend exist: NGC 3032, 3156, 4150, and 4382 show a central depression in Mg line strength. This structure is always accompanied by a strong peak in the H maps indicating the presence of a recent post-starburst or even low level ongoing star-formation. Interestingly, the Fe maps of post-starburst galaxies do not always show a depression such as the Mg index which can be understood in the reduced sensitivity to stellar population age of Fe indices.
Significant, but low-level, deviations between isoindex contours of the metal indices and the isophotes are discussed separately in Section 5.2. We find that enhanced Mg absorption strength is connected to fast-rotating components (as defined in Cappellari et al., 2006, hereafter Paper IV) in the galaxies. Perhaps the strongest case in our sample is presented in the Mg map of NGC 4570 where the Mg strength along the major axis runs through a dip outside the bulge region and then begins to rise towards larger radii where the galaxy kinematics start to be dominated by an outer disk (see also Fisher et al., 1996, for a long-slit study of S0s).
For galaxies with weak H absorption ( Å) the maps show typically mild positive gradients or are consistent with being flat. A few galaxies (e.g., NGC 3489, NGC 7332 and NGC 7457) show H maps with an overall elevated H line strength indicating a spatially extended, recent star-formation episode. Other galaxies (NGC 4382, NGC 4459 and NGC 4526) exhibit a more centrally concentrated region of relatively strong H absorption pointing towards a more localized star-formation event.
Regions of strong H absorption are often associated with dust features and detected in emission (see emission maps and unsharp-masked images in Paper V). The case of NGC 4526 deserves a special note, since here one can see the direct connection between an almost perfect dusty disc seen close to edge on (apparent in the reconstructed image), and the location of strong H absorption indicating the presence of young (1 Gyr) stars.
5.2 Mg isoindex contours versus isophotes
One of the most interesting aspects of integral-field spectroscopy is the capability to identify two-dimensional structures. For the first time we can use this in connection with line strength indices and compare isoindex contours with the isophotal shape. One might expect the index to follow the light in slowly-rotating giant elliptical galaxies, since the stars are dynamically well mixed. However, one could imagine that dynamical substructures with significantly different stellar populations could leave a signature in line strength maps which are sensitive to e.g., metallicity.
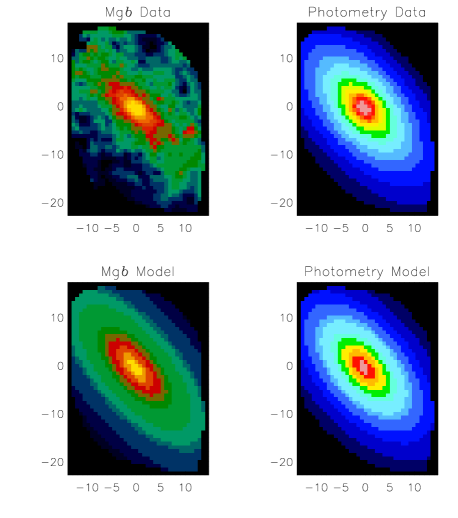
The Mg index is the best determined index in our survey and potential differences between isoindex contours and isophotes should be most apparent. Indeed we find a number of galaxies where the isoindex contours clearly do not follow the isophotes, e.g., NGC 4570 and NGC 4660. Both galaxies show fast-rotating components (see Paper III) along the direction of enhanced Mg strength. In order to further study such a possible connection we determine the best fitting ( sense) simple, elliptical model for each of the reconstructed images and Mg maps in our survey. For this model we impose a constant ellipticity and position angle as function of radius, where the position angle is determined as the average position angle of the reconstructed image. An example of this procedure is shown in Figure 10. We then compare the derived characteristic ellipticities for the isophotes and Mg maps with each other. Clearly such a simple model does not give a good fit to all galaxies, but it provides us with a robust, global shape measurement of the isoindex contours as compared to the isophotes.
In order to avoid confusion by the presence of significant dust absorption we exclude the following galaxies from the analysis: NGC 2685, NGC 3032, NGC 3156, NGC 3489, NGC 4374, and NGC 4526. Furthermore we exclude NGC 4486 because of the presence of the non-thermal emission from the well-known jet. This leaves a sample of 41 galaxies.
The results of the ellipse fitting are shown in Figure 11. Errors are evaluated via 50 Monte Carlo simulations per map where the Mg strength of each bin is varied according to the index errors. Additionally, we allowed for a 5% fraction of the data values to be considered as outliers and varied those data points by 5 times its original error. We required a minimum error of 0.08 Å per bin888In the central, high S/N regions of the Mg maps our internal error estimates are very small and we use a minimum error of 0.08 Å to reflect systematic errors. and also excluded all bins covering more than 20 individual lenses from the analysis.
Applying a error cut we find 16 out of the 41 galaxies to be consistent with no deviation between isophotes and isoindex contours. Seven galaxies appear to have rounder isoindex contours than the isophotal shape (NGC 2695, 2699, 2768, 3384, 3414, 4262, and 5845). However, 18 galaxies appear to have more flattened Mg contours than the isophotes (NGC 821, 2974, 3377, 3608, 4278, 4382, 4473, 4477, 4546, 4550, 4564, 4570, 4621, 4660, 5831, 5838, 5982, and 7332). Most of these galaxies show a high degree of rotational support and significant terms. Thus, the flattened Mg distribution suggests that the fast-rotating components in these galaxies exhibit a stellar population different from the main body. The enhanced Mg strength can be interpreted to first order as higher metallicity and/or increased [Mg/Fe] ratio. Furthermore, it is evident from the line strength maps that the detailed isoindex shapes cannot always be modeled with a simple elliptical structure. For example, in NGC 4570 one can see a central bulge component with a strong radial Mg gradient while at larger radii the onset of a disk component with strong Mg is visible (e.g., van den Bosch & Emsellem, 1998). A detailed analysis of the line strength distribution and its possible connection to the kinematics will be presented in a forthcoming paper.

6 Line strength gradients and aperture corrections
6.1 Line strength gradients
A number of previous studies have investigated line strength gradients with the help of long-slit data (e.g., Gorgas et al., 1990; Carollo et al., 1993; Davies et al., 1993; Fisher et al., 1996; Mehlert et al., 2003). Line strength gradients can be used to study the formation history of early-type galaxies since different formation models predict different gradients. In a nutshell, monolithic collapse models (Carlberg, 1984) predict steep metallicity gradients with metal rich centers whereas hierarchical models, following a merger tree, predict shallower gradients due to the dilution of any line strength gradients existing in the pre-merger units (White, 1980).
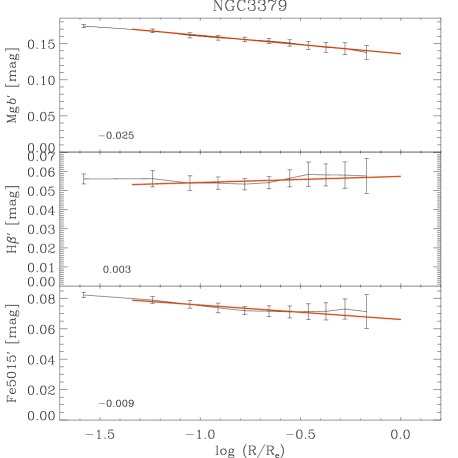
We now derive line strength gradients from the SAURON sample. First, all indices are expressed in magnitudes (as is the well known Mg2 index) which is indicated by a prime sign [′]. The conversion between an index measured in Å and magnitudes is
| (3) |
where is the width of the index bandpass.
In Section 5.2, we have mentioned the fact that overall, the morphology of the line strength maps resembles the corresponding photometry. This motivated our choice to derive robust and simple line strength gradients by averaging the indices along lines of constant surface brightness (isophotes) with equal steps in flux. The average line strength in each radial bin is derived after applying a clipping algorithm. The radius for each bin is calculated as the median major axis radius normalized to the effective radius along the major axis , where is the effective radius and is the average ellipticity of the galaxy within the SAURON field. The effective radii (see Table 5) are derived with a growth curve analysis from our wide-field MDM (1.3m) imaging survey of the E/S0 sample, supplemented by archival HST images. The photometry and analysis thereof will be presented in a forthcoming paper of this series.
For each galaxy we fit an error-weighted straight line to the index values at a given radius such that gradients are defined as
| (4) |
The error of the index value in each surface brightness bin is taken as the scatter of the data-points within this bin after applying a clipping algorithm. We further restrict the fitting range to radii between 2″ and . An example fit to the data of NGC 3379 is shown in Figure 12.
In Figure 13 we present for the full sample the fitted gradients for the H, Fe5015, and Mg indices plotted against the average (luminosity-weighted) index values within a circular aperture of one eights of an effective radius (, see Section 7 for details). For elliptical galaxies the H gradients have a mean value of , i.e., they are consistent with a flat relation (see also Mehlert et al., 2003). The lenticular galaxies show a range in H gradients where stronger (negative) gradients are correlated with increasing central H absorption strengths. This is mostly a consequence of the presence of galaxies in our sample which harbor young stars in the central regions, but have little or no star formation in the outer parts. If these young stars amount only to a small fraction in mass, the gradients will within a few Gyrs become shallower and the central H absorption strength will decrease, moving the galaxies back to the bulk of points in Figure 13.
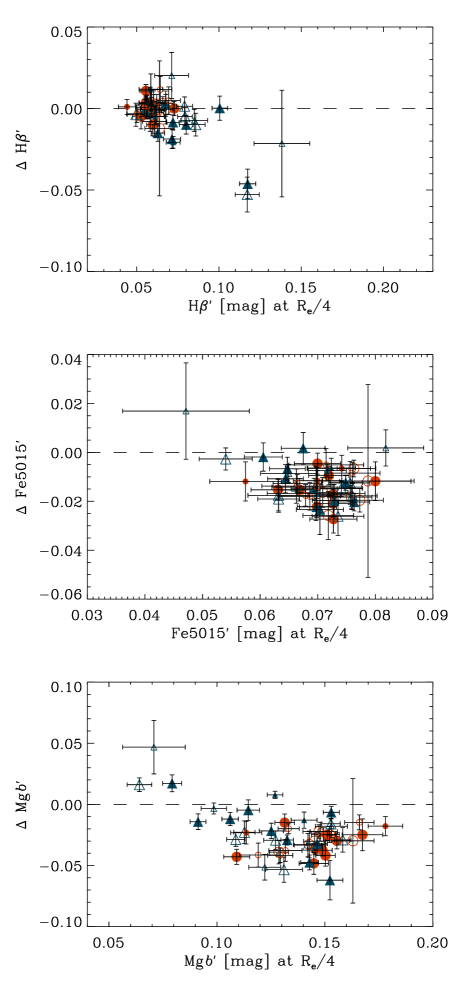
We find mostly negative gradients for the metal line gradients, consistent with the literature (e.g., Davies et al., 1993; Carollo et al., 1993; Kobayashi & Arimoto, 1999). Median gradients for Fe5015′ and Mg are -0.014 and -0.025, respectively. Using the full sample we find significant correlations between the line strength gradients and the average values within for Fe5015 and Mg . The correlation coefficient derived from a (non-parametric) Spearman rank-order test is and , for the Fe5015′ and Mg indices, respectively. The probability that the parameters are not correlated is given in parentheses.
A possible correlation between the Mg gradient (as measured by the Mg2 index) and the central Mg line strength had been suggested by Gonzalez & Gorgas (1995, see also Carollo et al. 1993), but some other investigations failed to detect a significant correlation (e.g., Kobayashi & Arimoto, 1999; Mehlert et al., 2003). New long-slit observations of a sample of 82 early-type galaxies presented by Sánchez-Blázquez (2004) do confirm the trend found by Gonzalez & Gorgas (1995).
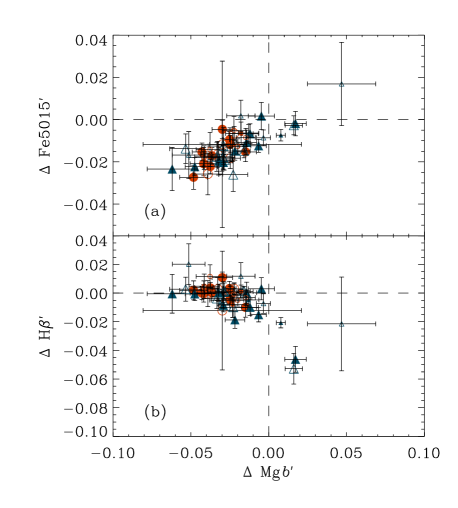
In our sample the correlation for the Mg index is largely driven by the (lenticular) galaxies with Mg . These galaxies are the ones with young stars in the central regions. This can be seen in Figure 14b where we show the relation between H and Mg gradients. There is also a good correlation between the gradients of the Mg and Fe5015′ indices as shown in Figure 14a (see also Fisher et al., 1996). This indicates that both indices are sensitive to similar stellar population parameters (e.g., metallicity).
In summary it appears that in our sample there are significant correlations of the line strength gradients with the central line strength in early-type galaxies. The relations are predominantly driven by the lenticular galaxies and furthermore by the presence of young stellar population in the central regions of galaxies. Environmental differences do not seem to play a major role. It is now interesting to explore if the above correlations also hold if line strength gradients are compared to index strength at larger radii, i.e. more representative regions for the galaxies as a whole.
In Figure 13 (right hand side panels) we plot the fitted gradients for the H, Fe5015, and Mg indices against the index value at 1/4 effective radius along the major axis. The index value at 1/4 effective radius is taken to be the value predicted by the fit. We have chosen this particular reference point, since it is within the range of the observed line strength gradients for all galaxies and is more representative of the galaxy as a whole rather than being biased to the central regions.
In this new diagram we do not find a significant correlation for the Fe5015′ index. For the H index there is still a correlation visible but it is exclusively driven by the three galaxies in the lower right part of the plot. The situation for Mg appears more complex. There is no significant correlation for the full sample while the S0s show a trend similar to the one derived for the 1/8 effective radius values. The elliptical galaxies even appear to follow a positive correlation between line strength gradient and Mg strength at . However, the latter trend is not significant.
We conclude that for early-type galaxies in our sample there is a correlation between line strength gradients of H, Fe5015 & Mg and centrally averaged line strength values . These correlations are driven to a large extent by the presence of young stellar populations in the central regions of (typically lenticular) early-type galaxies and thus are caused by galaxies which have recently experienced secondary star-formation which may account only for a minor fraction of the total galaxy mass.
6.2 Aperture corrections
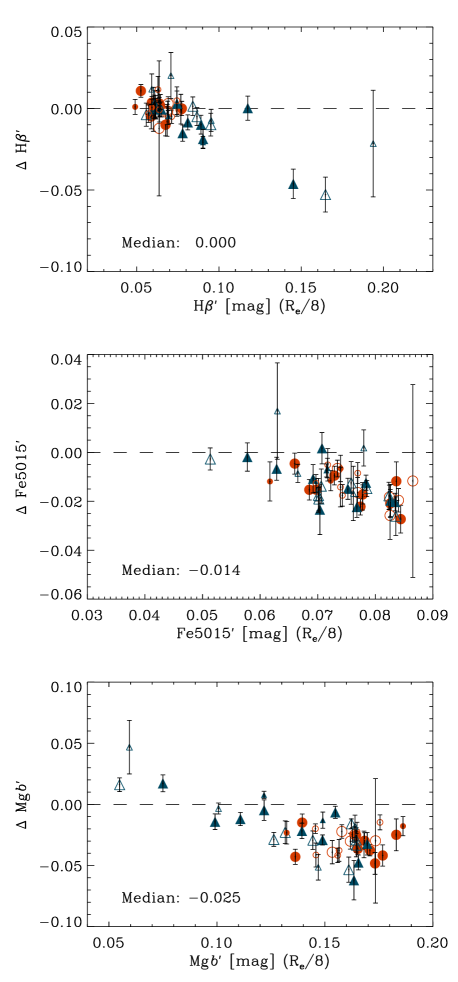
For studies of galaxies over a significant redshift and size range aperture corrections have to be applied in order to allow for a fair comparison of kinematic and stellar population parameters (e.g., Jørgensen et al., 1995). In Paper IV we present an aperture correction for the luminosity weighted second moment of the line of-sight velocity distribution () while here we present aperture corrections for the line strength indices H, Fe5015, and Mg .
For this we show in Figure 15 the luminosity-weighted line strength measurements within an aperture of radius , normalized to their value at half of the effective radius. The profiles were measured by co-adding the SAURON spectra within circular apertures of increasing radius for all 39 early-type galaxies which have data out to at least half of the effective radius. If the SAURON FoV does not cover the complete circular aperture at a given radius, we calculate an equivalent radius of a circular aperture which matches the area of the SAURON FoV.
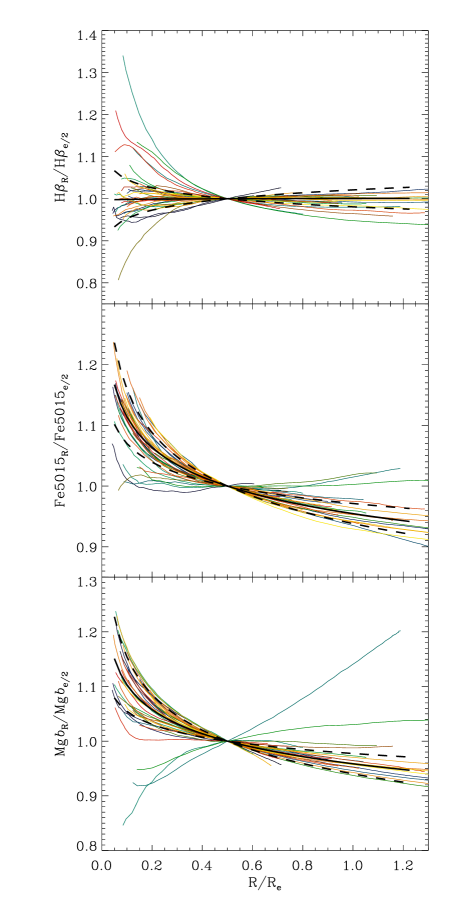
The metal line indices show generally a decreasing profile with increasing , while the H index shows a wide range in aperture corrections. Typical aperture corrections are small where a correction from 1/4 effective radius to one effective radius would amount to approximately 0.5% for the H index and 9% for the metal indices. However, it is clear that substantial galaxy-to-galaxy variations in the profiles exist. Particularly, for galaxies harboring a young stellar population in the center (i.e. positive Mg gradients) the application of an average aperture correction can be severely wrong.
The best fitting power-law relations to the line strength measurements as function of normalized radius were determined for each galaxy individually by fitting all available data outside . Then a median power-law index and a robustly estimated scatter was derived. These median power-law indices for each absorption feature are only provided as a convenient approximation of the true aperture corrections and presented in Table 4. They are in reasonable agreement with previously published aperture corrections (Jørgensen et al., 1995; Mehlert et al., 2003).
7 Integrated index– relations
After the presentation of the complete line strength maps (Section 5) and the average gradients (Section 6) we now present luminosity-weighted line strength indices averaged over a circular aperture. We focus on one key diagnostic: the index– relations.
Our integrated measurements were derived by averaging the (luminosity-weighted) spectra within a circular aperture with a radius of , but imposing a minimum aperture of ( pixel). From this high S/N spectrum we re-measure the kinematics (V, , and ) as described in Paper III (see also Cappellari & Emsellem, 2004) and then determine the line strength as presented in Section 4. Because of limited field coverage we do not quote central averaged Fe5270S measurements for eleven galaxies (NGC 474, 524, 821, 2695, 2768, 3608, 4270, 5198, 5308, 5846, and 5982). In a further eight galaxies the aperture is not fully covered by our maps, however, only a few bins, corresponding to less than 10% coverage, are missing and we judge the average spectrum to be still a good representation of the galaxy.
In order to provide a more global measurement for each galaxy we also derived a central averaged spectrum from all data available within one effective radius. Because of the sometimes severely limited field coverage of the Fe5270S index we do not quote one effective radius averages for it. Furthermore, since our line strength maps of the other indices do not always cover the full area of one effective radius we need to asses the degree of necessary aperture corrections. The galaxies with the smallest coverage (NGC 4486 and NGC5846) feature line strength data out to about 30% of . Even in these extreme cases we estimate corrections to be small (; see Section 6.2). For the 32 galaxies for which the data extends to less than one effective radius, we apply the corrections of the form given in Table 4. The median coverage of the line strength maps is . A subset of one index measurements is used in Paper IV to determine stellar ratios and compare them with high fidelity dynamical estimates of the global inside one .
The final, luminosity-weighted line strength measurements within a circular aperture of , and within , are given in Table 5. The formal line strength errors are smaller than Å for all galaxies. We note, however, that there are systematic errors which we estimate to be of the order of 0.06, 0.15, 0.08, 0.06 Å for the H, Fe5015, Mg , and Fe5270S indices, respectively. For the luminosity weighted averages of the velocity dispersion we adopt an error of 5% (see Paper IV).
| Name | H | Fe5015 | Mg | Fe5270S | H | Fe5015 | Mg | |||
|---|---|---|---|---|---|---|---|---|---|---|
| [″] | [] | [Å] | [Å] | [Å] | [Å] | [Å] | [Å] | [Å] | ||
| (1) | (2) | (3) | (4) | (5) | (6) | (7) | (8) | (9) | (10) | (11) |
| NGC474 | 29 | 0.71 | 163 | 1.68 | 5.45 | 4.11 | – | 1.81 | 4.85 | 3.45 |
| NGC524 | 51 | 0.61 | 249 | 1.39 | 5.57 | 4.55 | – | 1.50 | 5.38 | 4.20 |
| NGC821 | 39 | 0.62 | 202 | 1.53 | 5.32 | 4.35 | – | 1.57 | 4.65 | 3.72 |
| NGC1023 | 48 | 0.56 | 206 | 1.49 | 5.60 | 4.51 | 2.34 | 1.51 | 4.98 | 4.19 |
| NGC2549 | 20 | 0.90 | 142 | 2.07 | 5.85 | 4.05 | 2.40 | 2.02 | 5.10 | 3.54 |
| NGC2685 | 20 | 1.34 | 83 | 2.01 | 5.05 | 3.57 | 2.19 | 2.04 | 4.21 | 3.04 |
| NGC2695 | 21 | 0.95 | 223 | 1.31 | 5.05 | 4.57 | – | 1.27 | 4.34 | 3.94 |
| NGC2699 | 14 | 1.41 | 146 | 1.83 | 5.86 | 4.28 | 2.40 | 1.76 | 4.76 | 3.58 |
| NGC2768 | 71 | 0.39 | 205 | 1.70 | 5.02 | 4.08 | – | 1.64 | 4.43 | 3.64 |
| NGC2974 | 24 | 1.04 | 242 | 1.64 | 5.27 | 4.40 | 2.25 | 1.71 | 5.14 | 4.09 |
| NGC3032 | 17 | 1.19 | 100 | 4.57 | 4.58 | 1.73 | 1.62 | 3.98 | 4.02 | 2.14 |
| NGC3156 | 25 | 0.80 | 61 | 3.92 | 3.80 | 1.60 | 1.60 | 3.00 | 3.66 | 1.79 |
| NGC3377 | 38 | 0.52 | 142 | 1.85 | 4.95 | 3.83 | 2.09 | 1.86 | 4.37 | 3.20 |
| NGC3379 | 42 | 0.64 | 215 | 1.43 | 5.23 | 4.57 | 2.20 | 1.44 | 4.81 | 4.15 |
| NGC3384 | 27 | 0.75 | 158 | 1.94 | 5.92 | 4.16 | 2.47 | 1.84 | 5.12 | 3.70 |
| NGC3414 | 33 | 0.60 | 236 | 1.44 | 5.08 | 4.48 | 2.15 | 1.50 | 4.49 | 3.72 |
| NGC3489 | 19 | 1.05 | 100 | 2.82 | 4.99 | 2.84 | 2.01 | 2.60 | 4.40 | 2.60 |
| NGC3608 | 41 | 0.49 | 189 | 1.49 | 5.30 | 4.36 | – | 1.60 | 4.73 | 3.75 |
| NGC4150 | 15 | 1.39 | 78 | 3.47 | 4.23 | 2.17 | 1.69 | 2.87 | 4.11 | 2.35 |
| NGC4262 | 10 | 2.06 | 199 | 1.42 | 5.07 | 4.54 | 2.09 | 1.49 | 4.46 | 3.90 |
| NGC4270 | 18 | 1.09 | 137 | 1.77 | 5.09 | 3.45 | – | 1.74 | 4.67 | 3.24 |
| NGC4278 | 32 | 0.74 | 248 | 1.23 | 4.78 | 4.67 | 2.04 | 1.41 | 4.59 | 4.21 |
| NGC4374 | 71 | 0.43 | 294 | 1.40 | 5.19 | 4.52 | 2.22 | 1.42 | 4.66 | 4.08 |
| NGC4382 | 67 | 0.38 | 179 | 2.16 | 5.14 | 3.45 | 2.12 | 1.98 | 4.72 | 3.36 |
| NGC4387 | 17 | 1.16 | 96 | 1.60 | 5.03 | 3.92 | 2.18 | 1.51 | 4.42 | 3.67 |
| NGC4458 | 27 | 0.74 | 95 | 1.63 | 4.49 | 3.73 | 1.90 | 1.59 | 3.97 | 3.27 |
| NGC4459 | 38 | 0.71 | 180 | 2.16 | 5.39 | 3.91 | 2.27 | 1.85 | 4.68 | 3.43 |
| NGC4473 | 27 | 0.92 | 198 | 1.49 | 5.55 | 4.59 | 2.33 | 1.50 | 4.88 | 4.03 |
| NGC4477 | 47 | 0.43 | 168 | 1.65 | 5.15 | 4.17 | 2.21 | 1.59 | 4.71 | 3.84 |
| NGC4486 | 105 | 0.29 | 317 | 1.14 | 5.30 | 5.12 | 2.22 | 1.15 | 4.70 | 4.62 |
| NGC4526 | 40 | 0.66 | 240 | 1.86 | 5.59 | 4.32 | 2.29 | 1.62 | 4.93 | 4.16 |
| NGC4546 | 22 | 0.94 | 223 | 1.54 | 5.49 | 4.59 | 2.27 | 1.54 | 4.64 | 3.92 |
| NGC4550 | 14 | 1.28 | 81 | 2.14 | 4.57 | 3.15 | 2.00 | 1.99 | 4.32 | 2.93 |
| NGC4552 | 32 | 0.63 | 277 | 1.39 | 5.93 | 5.04 | 2.31 | 1.37 | 5.33 | 4.55 |
| NGC4564 | 21 | 1.02 | 173 | 1.52 | 5.98 | 4.79 | 2.42 | 1.55 | 4.85 | 4.00 |
| NGC4570 | 14 | 1.43 | 199 | 1.45 | 5.87 | 4.70 | 2.34 | 1.45 | 4.79 | 3.99 |
| NGC4621 | 46 | 0.56 | 229 | 1.40 | 5.53 | 4.73 | 2.28 | 1.43 | 4.75 | 4.14 |
| NGC4660 | 11 | 1.83 | 229 | 1.43 | 5.87 | 4.88 | 2.34 | 1.47 | 4.80 | 4.07 |
| NGC5198 | 25 | 0.80 | 209 | 1.49 | 5.50 | 4.66 | – | 1.56 | 4.70 | 3.93 |
| NGC5308 | 10 | 2.04 | 252 | 1.46 | 5.42 | 4.57 | – | 1.46 | 4.92 | 4.23 |
| NGC5813 | 52 | 0.39 | 231 | 1.51 | 5.16 | 4.58 | 2.15 | 1.52 | 4.74 | 4.12 |
| NGC5831 | 35 | 0.67 | 166 | 1.77 | 5.55 | 4.09 | 2.35 | 1.78 | 4.78 | 3.32 |
| NGC5838 | 23 | 0.87 | 290 | 1.64 | 5.86 | 4.55 | 2.35 | 1.58 | 5.05 | 4.19 |
| NGC5845 | 5 | 4.45 | 285 | 1.51 | 6.12 | 4.80 | 2.38 | 1.52 | 5.38 | 4.41 |
| NGC5846 | 81 | 0.29 | 237 | 1.34 | 5.50 | 4.85 | – | 1.32 | 4.89 | 4.38 |
| NGC5982 | 27 | 0.94 | 269 | 1.63 | 5.96 | 4.50 | – | 1.60 | 5.18 | 3.98 |
| NGC7332 | 11 | 1.91 | 135 | 2.28 | 5.93 | 3.71 | 2.30 | 2.16 | 4.80 | 3.17 |
| NGC7457 | 65 | 0.39 | 62 | 2.28 | 4.81 | 2.88 | 2.02 | 2.25 | 4.33 | 2.68 |
Notes: (1) NGC number. (2) Effective (half-light) radius measured from HST/WFPC2 + MDM images. (3) Ratio between the maximum radius sampled by the SAURON observations and . The maximum radius is calculated as the equivalent circular radius matching the area of the full SAURON field of view. Note, that for five galaxies the values given here are slightly smaller than the ones given in Paper IV since we have removed bad bins for the line-strength indices (see also Section 5). (4) Velocity dispersion of the luminosity weighted spectrum within a circular aperture of . (5) – (8) Fully corrected line strength index measurements of the luminosity weighted spectrum within for the H, Fe5015, Mg and Fe5270S indices. Due to limited field coverage we cannot determine the Fe5270S indices for eleven galaxies. (9) - (11) Fully corrected line strength index measurements of the luminosity weighted spectrum within for the H, Fe5015, and Mg indices. For galaxies with less than one coverage we applied the aperture corrections given in Table 4. Formal errors of the line strength indices are below 0.1 Å. We note, however, that there are systematic errors which we estimate to be of the order of 0.06, 0.15, 0.08, 0.06 Å for the H, Fe5015, Mg , and Fe5270S indices, respectively. For the velocity dispersion we adopt an error of 5%.
Our main result for the extractions is shown in Figure 16. For the index– relations all indices are expressed in magnitudes (see Section 6.1). The Mg index shows a tight correlation with which has been observed by many authors (e.g., Terlevich et al., 1981; Burstein et al., 1988; Bender et al., 1993; Colless et al., 1999; Bernardi et al., 2003; Worthey & Collobert, 2003; Denicoló et al., 2005). The H index shows a relatively tight, negative correlation for galaxies with velocity dispersions . For lower velocity dispersions there is evidence for an increased scatter (see also e.g., Kuntschner, 2000; Caldwell et al., 2003). The deviations from the main relation for galaxies with clearly anti-correlate in the Mg , H– relations.
The two Fe indices show roughly constant index values for velocity dispersions . Similar to the Mg and H– relations we also find an anti-correlation with respect to the fitted relation between Fe and H index strength at a given albeit at lower significance. At lower velocity dispersions we find there is weak evidence for an increasing index strength with increasing velocity dispersion. Similar trends have been noticed by Proctor & Sansom (2002) in an analysis of spiral bulges and E/S0s. The absence of a clear correlation between Fe indices and the central velocity dispersion has been noted by several authors (e.g., Fisher et al., 1996; Jørgensen, 1999) and we can confirm this for our sample. However, for other samples a significant correlation between Fe indices and the central velocity dispersion has been found (e.g., Kuntschner, 2000; Caldwell et al., 2003; Bernardi et al., 2003).
In order to compare our data with the literature we choose two datasets which cover luminous early-type galaxies (González, 1993; Trager et al., 2000, extractions) and fainter ones (Caldwell et al., 2003, global extractions). Our sample of 48 early-type galaxies shows good agreement with the literature for the H, Mg and Fe5270 indices (see Figure 16). For Fe5015, which was only observed by Caldwell et al. (2003), an offset of approximately 0.01 mag at intermediate velocity dispersions is visible, in the sense that our data has the larger values. The best fitting linear index– relations for , using errors in both variables are given in Table 6.
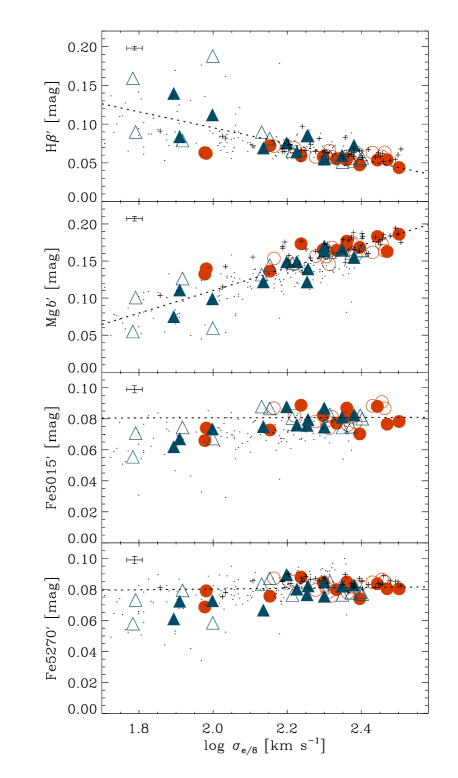
| H′ | |
|---|---|
| Mg ′ | |
| Fe5015′ | |
| Fe5270′ |
Notes: The linear fitting was performed by taking into account errors in both variables. The error in the intercepts and slopes have been derived by scaling the errors in the observables by a constant factor until the probability is .
There is no significant evidence for an environmental influence on the index– relations in our sample. However, it is generally the low velocity dispersion S0s which show the strongest anti-correlation between H and metal line strengths. The reason for the scatter in the index– relations is typically ascribed to a combination of age, metallicity and abundance ratio variations at a given (e.g., Kuntschner et al., 2001; Thomas et al., 2005). We explore this further in a forthcoming paper in this series.
8 Concluding remarks
The maps presented in this paper are the result of a comprehensive survey of the absorption line strength distributions of nearby early-type galaxies with an integral-field spectrograph. This data set demonstrates that many nearby early-type galaxies display a significant and varied structure in their line strength properties. This structure is sometimes very apparent as in the case of the post-starburst affected central regions of galaxies, or it can be of subtle nature as seen in the deviations of Mg isoindex contours compared to the isophotes of galaxies.
The two-dimensional coverage of the line strengths allows us to connect the stellar populations with the kinematical structure of the galaxies and thus improve our knowledge of the star-formation and assembly history of early-type galaxies. For example, we find the Mg isoindex contours to be flatter than the isophotes for 18 galaxies which generally exhibit significant rotation. We infer from this that the rotational supported sub-structure features a higher metallicity and/or an increased Mg/Fe ratio as compared to the galaxy as a whole. Further steps in this direction will be presented in forthcoming papers of this series.
The metal line strength maps show generally negative gradients with increasing radius, while the H maps are typically flat or show a mild positive outwards radial gradient. A few galaxies show strong central peaks and/or elevated overall H-strength likely connected to recent star-formation activity. For the most prominent post-starburst galaxies even the metal line strength maps show a reversed gradient. We use the maps to compute average line strengths integrated over circular apertures of one-eighth effective radius. The resulting index versus velocity dispersion relations compare well with previous long-slit work.
Acknowledgments
The SAURON project is made possible through grants 614.13.003, 781.74.203, 614.000.301 and 614.031.015 from NWO and financial contributions from the Institut National des Sciences de l’Univers, the Université Claude Bernard Lyon I, the Universities of Durham, Leiden, and Oxford, the British Council, PPARC grant ‘Extragalactic Astronomy & Cosmology at Durham 1998–2002’, and the Netherlands Research School for Astronomy NOVA. RLD is grateful for the award of a PPARC Senior Fellowship (PPA/Y/S/1999/00854) and postdoctoral support through PPARC grant PPA/G/S/2000/00729. The PPARC Visitors grant (PPA/V/S/2002/00553) to Oxford also supported this work. We are grateful to the Lorentz center at university of Leiden for generous hospitality. MC acknowledges support from a VENI grant 639.041.203 awarded by the Netherlands Organization for Scientific Research. JFB acknowledges support from the Euro3D Research Training Network, funded by the EC under contract HPRN-CT-2002-00305. This project made use of the HyperLeda and NED databases. Part of this work is based on data obtained from the ESO/ST-ECF Science Archive Facility. The SAURON team wishes to thank Emilie Jourdeuil for contributions in an early stage of this project.
References
- Afanasiev & Sil’chenko (2002) Afanasiev V. L., Sil’chenko O. K., 2002, AJ, 124, 706
- Bacon et al. (2001) Bacon R., Copin Y., Monnet G., Miller B. W., Allington-Smith J. R., Bureau M., Carollo M. C., Davies R. L., Emsellem E., Kuntschner H., Peletier R. F., Verolme E. K., de Zeeuw P. T., 2001, MNRAS, 326, 23 (Paper I)
- Bender et al. (1993) Bender R., Burstein D., Faber S. M., 1993, ApJ, 411, 153
- Bender et al. (1988) Bender R., Doebereiner S., Moellenhoff C., 1988, A&AS, 74, 385
- Bender et al. (1994) Bender R., Saglia R. P., Gerhard O. E., 1994, MNRAS, 269, 785
- Bernardi et al. (2003) Bernardi M., Sheth R. K., Annis J., Burles S., Finkbeiner D. P., Lupton R. H., Schlegel D. J., SubbaRao M., Bahcall N. A., Blakeslee J. P., Brinkmann J., Castander F. J., Connolly A. J., Csabai I., Doi M., Fukugita M., Frieman J., et al. 2003, AJ, 125, 1882
- Bica et al. (1990) Bica E., Alloin D., Schmidt A. A., 1990, A&A, 228, 23
- Bohlin et al. (2001) Bohlin R. C., Dickinson M. E., Calzetti D., 2001, AJ, 122, 2118
- Bower et al. (2000) Bower G. A., Green R. F., Quillen A. C., Danks A., Gull T., Hutchings J., Joseph C., Kaiser M. E., Weistrop D., Woodgate B., Malumuth E. M., Nelson C., 2000, ApJ, 534, 189
- Brodie & Hanes (1986) Brodie J. P., Hanes D. A., 1986, ApJ, 300, 258
- Burbidge & Burbidge (1959) Burbidge E. M., Burbidge G. R., 1959, ApJ, 130, 20
- Bureau & Athanassoula (2005) Bureau M., Athanassoula E., 2005, ApJ, 626, 159
- Burstein et al. (1988) Burstein D., Davies R. L., Dressler A., Faber S. M., Lynden-Bell D., 1988, in ASSL Vol. 141: Towards Understanding Galaxies at Large Redshift Global stellar populations of elliptical galaxies. A - Optical properties. pp 17–21
- Burstein et al. (1984) Burstein D., Faber S. M., Gaskell C. M., Krumm N., 1984, ApJ, 287, 586
- Busarello et al. (1996) Busarello G., Capaccioli M., D’Onofrio M., Longo G., Richter G., Zaggia S., 1996, A&A, 314, 32
- Caldwell et al. (2003) Caldwell N., Rose J. A., Concannon K. D., 2003, AJ, 125, 2891
- Capetti et al. (2000) Capetti A., de Ruiter H. R., Fanti R., Morganti R., Parma P., Ulrich M.-H., 2000, A&A, 362, 871
- Cappellari et al. (2006) Cappellari M., Bacon R., Bureau B., Damen M. C., Davies R. L., de Zeeuw P. T., Emsellem E., Falcón-Barroso J., Krajnović D., Kuntschner H., McDermid R. M., Peletier R. F., van den Bosch R. C. E., van de Ven G., 2006, MNRAS, accepted, astro-ph/0505042 (Paper IV)
- Cappellari & Copin (2003) Cappellari M., Copin Y., 2003, MNRAS, 342, 345
- Cappellari & Emsellem (2004) Cappellari M., Emsellem E., 2004, PASP, 116, 138
- Cardiel et al. (1998) Cardiel N., Gorgas J., Cenarro J., Gonzalez J. J., 1998, A&AS, 127, 597
- Carlberg (1984) Carlberg R. G., 1984, ApJ, 286, 403
- Carollo et al. (1993) Carollo C. M., Danziger I. J., Buson L., 1993, MNRAS, 265, 553
- Colless et al. (1999) Colless M., Burstein D., Davies R. L., McMahan R. K., Saglia R. P., Wegner G., 1999, MNRAS, 303, 813
- Davies et al. (1983) Davies R. L., Efstathiou G., Fall S. M., Illingworth G., Schechter P. L., 1983, ApJ, 266, 41
- Davies et al. (1993) Davies R. L., Sadler E. M., Peletier R. F., 1993, MNRAS, 262, 650
- de Zeeuw et al. (2002) de Zeeuw P. T., Bureau M., Emsellem E., Bacon R., Carollo C. M., Copin Y., Davies R. L., Kuntschner H., Miller B. W., Monnet G., Peletier R. F., Verolme E. K., 2002, MNRAS, 329, 513 (Paper II)
- del Burgo et al. (2001) del Burgo C., Peletier R. F., Vazdekis A., Arribas S., Mediavilla E., 2001, MNRAS, 321, 227
- Denicoló et al. (2005) Denicoló G., Terlevich R., Terlevich E., Forbes D. A., Terlevich A., Carrasco L., 2005, MNRAS, 356, 1440
- Efstathiou et al. (1980) Efstathiou G., Ellis R. S., Carter D., 1980, MNRAS, 193, 931
- Efstathiou et al. (1982) Efstathiou G., Ellis R. S., Carter D., 1982, MNRAS, 201, 975
- Emsellem et al. (1996) Emsellem E., Bacon R., Monnet G., Poulain P., 1996, A&A, 312, 777
- Emsellem et al. (2004) Emsellem E., Cappellari M., Peletier R. F., McDermid R. M., Bacon R., Bureau M., Copin Y., Davies R. L., Krajnović D., Kuntschner H., Miller B. W., de Zeeuw P. T., 2004, MNRAS, 352, 721 (Paper III)
- Faber (1973) Faber S. M., 1973, ApJ, 179, 731
- Falcón-Barroso et al. (2006) Falcón-Barroso J., Bacon R., Bureau M., Cappellari M., Davies R. L., de Zeeuw P. T., Emsellem E., Fathi K., Krajnović D., Kuntschner H., McDermid R. M., Peletier R. F., Sarzi M., 2006, MNRAS, submitted (Paper VII)
- Falcón-Barroso et al. (2004) Falcón-Barroso J., Peletier R. F., Emsellem E., Kuntschner H., Fathi K., Bureau M., Bacon R., Cappellari M., Copin Y., Davies R. L., de Zeeuw P. T., 2004, MNRAS, 350, 35
- Fernandes et al. (2004) Fernandes R. C., Delgado R. M. G., Schmitt H., Storchi-Bergmann T., Martins L. P., Pérez E., Heckman T., Leitherer C., Schaerer D., 2004, ApJ, 605, 105
- Fisher et al. (1996) Fisher D., Franx M., Illingworth G., 1996, ApJ, 459, 110
- González (1993) González J. J., 1993, Ph.D. Thesis
- Gonzalez & Gorgas (1995) Gonzalez J. J., Gorgas J., 1995, in ASP Conf. Ser. 86: Fresh Views of Elliptical Galaxies Spectroscopic Gradients in Elliptical Galaxies. p. 225
- Gorgas et al. (1990) Gorgas J., Efstathiou G., Salamanca A. A., 1990, MNRAS, 245, 217
- Goudfrooij et al. (1994) Goudfrooij P., Hansen L., Jørgensen H. E., Norgaard-Nielsen H. U., 1994, A&AS, 105, 341
- Hau (1998) Hau G. K. T., 1998, PhD thesis, University of Cambridge, UK
- Ho et al. (1997) Ho L. C., Filippenko A. V., Sargent W. L. W., 1997, ApJS, 112, 315
- Jones (1997) Jones L. A., 1997, Ph.D. Thesis
- Jørgensen (1999) Jørgensen I., 1999, MNRAS, 306, 607
- Jørgensen et al. (1995) Jørgensen I., Franx M., Kjaergaard P., 1995, MNRAS, 276, 1341
- King (1985) King D. L., 1985, Technical note 31, Atmospheric Extinction at the Roque de los Muchachos Observatory, La Palma. The Royal Greenwich Observatory (RGO)
- Kobayashi & Arimoto (1999) Kobayashi C., Arimoto N., 1999, ApJ, 527, 573
- Korn et al. (2005) Korn A. J., Maraston C., Thomas D., 2005, A&A, 438, 685
- Kuntschner (2000) Kuntschner H., 2000, MNRAS, 315, 184
- Kuntschner (2004) Kuntschner H., 2004, A&A, 426, 737
- Kuntschner et al. (2001) Kuntschner H., Lucey J. R., Smith R. J., Hudson M. J., Davies R. L., 2001, MNRAS, 323, 615
- McDermid et al. (2004) McDermid R. M., Emsellem E., Cappellari M., Kuntschner H., Bacon R., Bureau M., Copin Y., Davies R. L., Falcón-Barroso J., Ferruit P., Krajnović D., Peletier R. F., Shapiro K., Wernli F., de Zeeuw P. T., 2004, Astronomische Nachrichten, 325, 100
- McDermid et al. (2005) McDermid R. M., Kuntschner H., Davies R. L., Vazdekis A., 2005, MNRAS, submitted
- Mehlert et al. (2000) Mehlert D., Saglia R. P., Bender R., Wegner G., 2000, A&AS, 141, 449
- Mehlert et al. (2003) Mehlert D., Thomas D., Saglia R. P., Bender R., Wegner G., 2003, A&A, 407, 423
- Michard (1999) Michard R., 1999, A&AS, 137, 245
- Michard & Simien (1988) Michard R., Simien F., 1988, A&AS, 74, 25
- Morelli et al. (2004) Morelli L., Halliday C., Corsini E. M., Pizzella A., Thomas D., Saglia R. P., Davies R. L., Bender R., Birkinshaw M., Bertola F., 2004, MNRAS, 354, 753
- Norris et al. (2006) Norris M. A., Sharples R. M., Kuntschner H., 2006, MNRAS, accepted, astro-ph/0601221
- Peletier et al. (1999) Peletier R. F., Balcells M., Davies R. L., Andredakis Y., Vazdekis A., Burkert A., Prada F., 1999, MNRAS, 310, 703
- Peletier & Christodoulou (1993) Peletier R. F., Christodoulou D. M., 1993, AJ, 105, 1378
- Peletier et al. (1990) Peletier R. F., Davies R. L., Illingworth G. D., Davis L. E., Cawson M., 1990, AJ, 100, 1091
- Peletier et al. (1999) Peletier R. F., Vazdekis A., Arribas S., del Burgo C., García-Lorenzo B., Gutiérrez C., Mediavilla E., Prada F., 1999, MNRAS, 310, 863
- Peng et al. (2002) Peng C. Y., Ho L. C., Impey C. D., Rix H., 2002, AJ, 124, 266
- Proctor & Sansom (2002) Proctor R. N., Sansom A. E., 2002, MNRAS, 333, 517
- Quillen et al. (2000) Quillen A. C., Bower G. A., Stritzinger M., 2000, ApJS, 128, 85
- Rampazzo et al. (2005) Rampazzo R., Annibali F., Bressan A., Longhetti M., Padoan F., Zeilinger W. W., 2005, A&A, 433, 497
- Rix et al. (1992) Rix H., Franx M., Fisher D., Illingworth G., 1992, ApJ, 400, L5
- Rose (1985) Rose J. A., 1985, AJ, 90, 1927
- Sánchez-Blázquez (2004) Sánchez-Blázquez P., 2004, Ph.D. Thesis, Universidad Complutense, Madrid
- Sarzi et al. (2006) Sarzi M., Falcón-Barroso J., Davies R. L., Bacon R., Bureau M., Cappellari M., de Zeeuw P. T., Emsellem E., Fathi K., Krajnović D., Kuntschner H., McDermid R. M., Peletier R. F., 2006, MNRAS, accepted, astro-ph/0511307 (Paper V)
- Sarzi et al. (2001) Sarzi M., Rix H., Shields J. C., Rudnick G., Ho L. C., McIntosh D. H., Filippenko A. V., Sargent W. L. W., 2001, ApJ, 550, 65
- Sil’chenko (2005) Sil’chenko O. K., 2005, Astronomy Letters, 31, 227
- Sil’chenko et al. (2002) Sil’chenko O. K., Afanasiev V. L., Chavushyan V. H., Valdes J. R., 2002, ApJ, 577, 668
- Sil’chenko et al. (2003) Sil’chenko O. K., Moiseev A. V., Afanasiev V. L., Chavushyan V. H., Valdes J. R., 2003, ApJ, 591, 185
- Terlevich et al. (1981) Terlevich R., Davies R. L., Faber S. M., Burstein D., 1981, MNRAS, 196, 381
- Thomas et al. (2003) Thomas D., Maraston C., Bender R., 2003, MNRAS, 339, 897
- Thomas et al. (2005) Thomas D., Maraston C., Bender R., de Oliveira C. M., 2005, ApJ, 621, 673
- Trager et al. (2000) Trager S. C., Faber S. M., Worthey G., González J. J. ., 2000, AJ, 119, 1645
- Trager et al. (1998) Trager S. C., Worthey G., Faber S. M., Burstein D., Gonzalez J. J., 1998, ApJS, 116, 1
- Turnbull et al. (1999) Turnbull A. J., Bridges T. J., Carter D., 1999, MNRAS, 307, 967
- van den Bosch & Emsellem (1998) van den Bosch F. C., Emsellem E., 1998, MNRAS, 298, 267
- Vazdekis (1999) Vazdekis A., 1999, ApJ, 513, 224
- Wagner et al. (1988) Wagner S. J., Bender R., Moellenhoff C., 1988, A&A, 195, L5
- Wernli et al. (2002) Wernli F., Emsellem E., Copin Y., 2002, A&A, 396, 73
- White (1980) White S. D. M., 1980, MNRAS, 191, 1P
- Worthey (1994) Worthey G., 1994, ApJS, 95, 107
- Worthey & Collobert (2003) Worthey G., Collobert M., 2003, ApJ, 586, 17
- Worthey et al. (1992) Worthey G., Faber S. M., Gonzalez J. J., 1992, ApJ, 398, 69
- Worthey et al. (1994) Worthey G., Faber S. M., Gonzalez J. J., Burstein D., 1994, ApJS, 94, 687
- Worthey & Ottaviani (1997) Worthey G., Ottaviani D. L., 1997, ApJS, 111, 377
Appendix A Description for individual galaxies
Here we briefly comment on the line strength structures observed in the SAURON maps of the E/S0 sample presented in this paper. Individual comments on the stellar kinematics and the emission line maps are presented in Papers III and V, respectively. A thorough and quantitative assessment of the line strength maps with the help of stellar population models will be carried out in subsequent papers. Independently derived line strength maps for NGC 524, NGC 1023 NGC 3379, NGC 3384, NGC 4550, NGC 7332 and NGC 7457 based on our observations were presented and discussed in Afanasiev & Sil’chenko (2002), Sil’chenko et al. (2002), Sil’chenko et al. (2003) and Sil’chenko (2005).
- NGC 474:
-
This galaxy (Arp 227), famous for its shell structures (e.g. Turnbull et al., 1999), shows normal metal line strength gradients. The H map appears relatively flat in the inner regions while we observe rising H strength towards larger radii.
- NGC 524:
-
This galaxy shows regular Mg gradients and the H map shows a mild positive gradient. The two Fe maps show a noisy structure which may partly be caused by low S/N in the outer bins.
- NGC 821:
-
A close to edge-on galaxy with a rapidly rotating disk like component (see Paper III) shows an enhanced core region in all metal line maps. There is also evidence for the Mg contours to be flatter than the isophotes. The H map appears rather featureless (see also McDermid et al., 2005). The maps are consistent with the results from long-slit spectroscopy of Sánchez-Blázquez (2004).
- NGC 1023:
-
This SB0 galaxy, with a prominent twist in the central velocity field (see Paper III), shows a central concentration in all metal lines. The metal line strength at larger radii appear flat and even tend to rise again at the edges of the field of view. The H map is consistent with a constant value over the full field of view.
- NGC 2549:
-
This galaxy with a thin, rapidly rotating component (see Paper III) shows enhanced Fe5015 and Fe5270S strength along this component. The H line strength is also elevated in the central regions.
- NGC 2685:
-
This famous object, the Helix galaxy (Burbidge & Burbidge, 1959; Peletier & Christodoulou, 1993), shows significant extinction due to polar dust lanes on its North East side. The H map shows enhanced values over large regions of the FoV, while the metal line strength maps are elevated along the rotation direction.
- NGC 2695:
-
The metal line strength maps show normal gradients consistent with the isophotes. The H map is flat, however, at notably low values.
- NGC 2699:
-
This galaxy shows regular metal line strength gradients consistent with the isophotes. The H map is relatively flat at a slightly elevated level compared to the bulk of the objects in our sample.
- NGC 2768:
-
This galaxy with a rather cylindrical velocity field shows regular metal line strength gradients. The H map appears rather flat. Significant dust extinction is present north of the center (Michard, 1999).
- NGC 2974:
-
This rapidly rotating galaxy shows evidence of enhanced metal line strength along the rotation direction. The H map appears relatively flat. The long-slit observations of Rampazzo et al. (2005) show declining H strength with radius while Carollo et al. (1993) data suggest a modest increase with radius. Our emission line maps (Paper V) show significant [OIII] and H emission basically over the full FoV and thus different H emission corrections are likely the cause of the literature disagreement on H absorption strengths.
- NGC 3032:
-
This dusty galaxy shows negative Mg and Fe5270S line strength gradients. The Fe5015 map shows a ring-like structure of weak absorption while the center exhibits strong Fe5015 absorption. The H map reveals a prominent peak in the center and shows evidence of rising values at larger radii. The unusual structure of the line strength maps and the relatively strong emission detected in this galaxy (see Figure 6 and Paper V) suggest that a recent starburst has occurred in this galaxy with weak evidence of ongoing star formation.
- NGC 3156:
-
Another dusty galaxy with negative Mg line strength gradients in the center. The Fe5015 and Fe5270S maps do not show a clear structure. The H map exhibits a strong peak in the center with a gradual decline to the outskirts. The line strength maps suggest a post-starburst scenario for this galaxy (see also Denicoló et al., 2005).
- NGC 3377:
- NGC 3379 (M105):
- NGC 3384:
-
This SB0 galaxy shows a dynamically cold component in the central 5″ (see Paper III), which may correspond to the red major axis disk component found by Busarello et al. (1996). The line strength indices were already presented in Paper II. The metal line strengths show regular gradients consistent with the isophotes. The H absorption map, at moderately elevated values (see also Kuntschner et al., 2001), appears flat in the inner regions with weak evidence for increasing H strength at large radii.
- NGC 3414:
-
This disturbed galaxy (Arp 162) contains a kinematically decoupled component (see Paper III) within the central 10″. The line strength maps appear to have regular gradients.
- NGC 3489:
-
This dusty galaxy shows a fast-rotating central component and a complex morphology of the odd higher-order kinematic moment (see Paper III). The H absorption strength is globally high (see also Kuntschner et al., 2001; Rampazzo et al., 2005), with a sharp central (2″) enhancement, also evident with OASIS (McDermid et al., 2004).
- NGC 3608:
-
This galaxy shows a kinematically decoupled core (Paper III and references therein) extending to around 13″. Our metal line strengths appear more flattened than the isophotes within this region. The H absorption map shows a mild positive gradient with radius. Line strength are consistent with Sánchez-Blázquez (2004).
- NGC 4150:
-
Noticeable obscuration from dust is visible in the central parts of this galaxy (Quillen et al., 2000). A kinematically decoupled component resides in the central few arcseconds of this galaxy (see Paper III), coincident with a strong drop in the Mg absorption strength and a corresponding peak in H absorption strength, which itself is globally enhanced. The iron line maps are relatively featureless by comparison, with no strong central features. The core is therefore dominated by a young stellar population, as found by other authors (e.g., Fernandes et al., 2004).
- NGC 4262:
-
This strongly barred object shows inconspicuous metal line gradients. The H absorption map shows a mild increase with radius.
- NGC 4270:
-
The central peaked metal absorption line strengths in this galaxy show evidence of an increase beyond 10″ along the major axis, giving a small dip around 4-5″ from the center. The H absorption map shows no significant features.
- NGC 4278:
-
This LINER (Ho et al., 1997) and radio source (e.g., Capetti et al., 2000) shows some central dust features (e.g., Peng et al., 2002). There is some evidence that the Mg contours are more flattened than the isophotes. There is a well-defined depression in the H line strength within the central 5″ (see also Davies et al., 1993) which we partly ascribe to imperfect removal of strong H emission.
- NGC 4374 (M84):
-
This well known giant elliptical shows noticeable dust absorption (Quillen et al., 2000) and has a BL Lac nucleus (Bower et al., 2000). The metal lines have a similar morphology to those in NGC 4278, following the isophotes in general. The H absorption map is rather flat, showing a slight increase towards the edge of the field, also present in the data of Davies et al. (1993), Carollo et al. (1993) and Sánchez-Blázquez (2004).
- NGC 4382 (M85):
-
This well known object shows a distinct depression in Mg within the central 10″, consistent with Fisher et al. (1996), which appears slightly more flattened than the isophotes. This is coincident with an enhancement in the H absorption map (see also Kuntschner et al., 2001), as well as corresponding closely to a region of peculiar kinematic behavior (decoupled rotation, low velocity dispersion, and complex higher-order terms - see Paper III). There is also evidence for a flattened feature in the iron absorption maps within this region, most evident in the Fe5015 map.
- NGC 4387:
-
This boxy galaxy (Peletier et al., 1990) shows regular metal line gradients consistent with the isophotes. The H map appears relatively flat in the inner regions while we observe a drop of H strength towards larger radii.
- NGC 4458:
-
This galaxy with a kinematically decoupled component (hereafter, KDC; see Paper III) shows line strength gradients consistent with the isophotes. The region of the KDC is inconspicuous in the H map (see also Morelli et al., 2004).
- NGC 4459:
-
This galaxy shows a central region of stronger H absorption with a ring like structure around it. This is consistent with the central dust ring found in this galaxy; see Paper V and Sarzi et al. (2001). The metal lines show relatively regular gradients.
- NGC 4473:
-
This galaxy exhibits a complex morphology in the velocity dispersion map, with a region of high dispersion along the major-axis which widens at larger radii, which probably corresponds to two counter-rotating stellar disks. The metal line strength maps are more flattened than the isophotes, indicating a higher metallicity in the disk(s) while the H map is rather flat.
- NGC 4477:
-
This galaxy shows a prominent misalignment of the kinematic and photometric major-axis. The metal line strength maps show an inner region with enhanced metallicity and show little structure elsewhere. There is weak evidence at larger radii along the major axis for increased metal line strength. The H map appears flat.
- NGC 4486:
-
The line strength in the central 3″ and some part of the jet region of this famous Virgo galaxy are clearly affected by an imperfect removal of emission lines and non-thermal emission (Davies et al., 1993). Overall, the line strength maps appear flat over large parts of the FoV. The H map exhibits notably low values.
- NGC 4526:
-
This S0 object has a prominent dust disc which is not only visible in the reconstructed SAURON image but also clearly seen in the Mg and H maps. The strong H line strengths in the region of the dust lane indicates the presence of dust enshrouded young stars.
- NGC 4546:
-
This galaxy exhibits ionized gas counter-rotating with respect to the stars (see Paper V). The Mg contours are more elongated in the direction of the rotation than the isophotes. This effect is less prominent in the iron maps. The H map appears relatively flat with a hint of weaker H absorption along the major axis.
- NGC 4550:
-
This S0 galaxy has two counter-rotating stellar disks of similar mass (Rix et al., 1992). There is evidence for the Mg contours being flatter than the isophotes. The H map shows a mildly elevated level in the central region along the major axis.
- NGC 4552:
- NGC 4564:
-
This highly elongated galaxy shows isoindex contours of the Mg and the Fe indices which are more flattened than the isophotes, indicating that the bulge and disk of this galaxy have different stellar populations.
- NGC 4570:
-
This edge-on S0 galaxy features multiple kinematic components such as an outer and a nuclear disk (van den Bosch & Emsellem, 1998). The Mg map and to a lesser extent the Fe maps show a central peak surrounded by a region depressed in line strength. At larger radii the onset of the outer disk, showing strong metal lines, can be seen. The H map is relatively flat.
- NGC 4621:
-
This is another object with a strong indication from the stellar kinematics of a disc component, which is also seen in the metal line strength maps showing more flattened isoindex contours than the isophotes. The inner 60 pc harbor a counter-rotating core (Wernli et al., 2002). The H map appears relatively flat.
- NGC 4660:
-
Similar to NGC 4621, there are strong indications for a disk component in this galaxy, accompanied by pointy disky isophotes. This galaxy is among the best examples of Mg isoindex contours to be flatter than the isophotes for galaxies with strong rotation.
- NGC 5198:
-
This galaxy, with a central KDC, rotating nearly perpendicularly to the outer body, shows regular metal line gradients and a mild positive H gradient.
- NGC 5308:
-
This is a typical case of a close to edge-on disc galaxy showing a rapidly rotating component (Paper III) and a double sign reversal in , indicating a central bar (Bureau & Athanassoula, 2005). The metal line strength gradients are regular and appear to be consistent with the isophotes.
- NGC 5813:
-
A galaxy with a well-known KDC (Efstathiou et al., 1980, 1982; Bender et al., 1994, Paper III). The line strength maps of this galaxy have already been presented in Paper II. Here it is shown that we reproduce the large Mg gradient presented by Gorgas et al. (1990). The KDC is not seen in the absorption line maps.
- NGC 5831:
-
The kinematics of this galaxy reveal the presence of a well-known KDC (Davies et al., 1983; Peletier et al., 1990, Paper III). The KDC is not really seen in the line strength maps, apart from the Mg map which appears to be more elongated in the direction of the KDC than the isophotes. The H map appears relatively flat.
- NGC 5838:
-
This boxy galaxy is a strong rotator and Peletier et al. (1990) show that the bulge of this galaxy contains old stellar populations with small color gradients, except for the inner 2″. This is consistent with our line strength maps which show regular gradients and a mild peak of the H map in the very center. There is evidence for the Mg contours being flatter than the isophotes. Our emission line maps (see Paper V) also show significant detection in the center with evidence for a rotating structure.
- NGC 5845:
-
This galaxy is a compact elliptical, close to NGC 5846. Small gradients in the line strength maps are seen, consistent with Sánchez-Blázquez (2004). The central disk, clearly seen in the stellar kinematics (Paper III), is not apparent in the line strength maps.
- NGC 5846:
-
The SAURON field of view of this bright giant elliptical includes a foreground star and a companion (NGC 5846A) north and south of its nucleus, respectively. The line strength maps are generally regular, with small gradients. The line strengths are consistent with Sánchez-Blázquez (2004) and Rampazzo et al. (2005).
- NGC 5982:
-
For this galaxy we confirm the presence of a KDC first detected by Wagner et al. (1988). The KDC is not clearly seen in the line strengths maps, however, there is evidence for the Mg contours being flatter than the isophotes. The H map appears relatively flat.
- NGC 7332:
-
Another strongly boxy galaxy with a KDC (counter-rotating) in the central 3″ (see Falcón-Barroso et al., 2004). There is evidence for the Mg contours being flatter than the isophotes. The galaxy shows high H values, indicating an age of about 3 Gyr (see Falcón-Barroso et al., 2004). The data are consistent with Sánchez-Blázquez (2004) and Rampazzo et al. (2005).
- NGC 7457:
-
This small S0 galaxy with a KDC shows surprisingly little structure in its line strength maps, consistent with the color profiles of Peletier et al. (1999). The high H values indicate a relatively young age.