A 0535+26 : back in business
Abstract
In May/June 2005, after 10 years of inactivity, the Be/X-ray binary system A 0535+26 underwent a major X-ray outburst. In this paper data are presented from 10 years of optical, IR and X-ray monitoring showing the behaviour of the system during the quiescent epoch and the lead up to the new outburst. The results show the system going through a period when the Be star in the system had a minimal circumstellar disk and then a dramatic disk recovery leading, presumably, to the latest flare up of X-ray emission. The data are interpreted in terms of the state of the disk and its interaction with the neutron star companion.
keywords:
stars:neutron - X-rays:binaries1 Introduction and background
The Be/X-ray systems represent the largest sub-class of massive X-ray binaries. A survey of the literature reveals that of the 115 identified massive X-ray binary pulsar systems (identified here means exhibiting a coherent X-ray pulse period), most of the systems fall within this Be counterpart class of binary. The orbit of the Be star and the compact object, presumably a neutron star, is generally wide and eccentric. X-ray outbursts are normally associated with the passage of the neutron star close to the circumstellar disk (Okazaki & Negueruela 2001). A review of such systems may be found in Coe et al. (2000).
The source that is the subject of this paper, A 0535+26, was discovered by Ariel V during a Type II outburst (see Stella, White & Rosner 1986 for a description of different outburst types) in 1975 (Coe et al. 1975, Rosenberg et al. 1975). The primary is an O9.7IIIe star (Steele et al. 1998) and its optical and infrared (IR) emission has been the subject of many papers in an attempt to decode the behavioural patterns of this system. Extensive pieces of work by Clark et al. (1998) and Haigh et al. (2004) using both photometric and spectroscopic data in the UV-IR range have presented data sets showing assorted levels of variation within the optical star. In contrast, throughout the last decade (1995-2004) there have been no reported detections of the source at X-ray wavelengths. However, in May/June 2005 the source was detected undergoing significant X-ray activity by the SWIFT (Tueller et al. 2005) and RHESSI (Smith et al. 2005) observatories. In this paper we report on the recent developments in the optical and IR fluxes in the context of the re-emergence of A 0535+26 as an active X-ray source.
2 Optical data
H data have been collected over the last 10 years from a series of telescopes. Some of the early data have already been published in Haigh et al. (2004) but are presented here again to provide the context for the changes that have subsequently taken place in the source.
The dates and properties of the H line are presented in Table 1. In this table the following telescopes and configurations have been used:
-
•
JKT - 1.0m telescope, La Palma observatory (Spain), RBS spectrograph, TEK4 detector, R1200Y grating
-
•
INT - 2.5m telescope, La Palma observatory (Spain), IDS instrument, EEV5 detector, R1200R grating
-
•
Ski - 1.3m telescope, Mt. Skinakas Observatory (Crete), spectrograph, SITe detector, 1301 l/mm grating
-
•
SAAO - 1.9m telescope, Sutherland Observatory (South Africa), spectrograph, SITe detector, 1200 l/mm grating
| Obs. date | Telescope | HEW | V/R | Peak |
|---|---|---|---|---|
| (Å) | ratio | Separation | ||
| (km/s) | ||||
| 28 Feb 1996 | JKT | -8.20.2 | 0.76 | 2475 |
| 28 Oct 1997 | JKT | -7.30.1 | 1.09 | 2515 |
| 26 Nov 1998 | INT | -0.90.1 | 1.59 | 4715 |
| 24 Apr 1999 | INT | -0.50.1 | 1.33 | 4295 |
| 15 Aug 2000 | INT | -5.10.1 | 1.06 | 2565 |
| 16 Oct 2000 | Ski | -8.60.2 | - | - |
| 12 Sep 2001 | Ski | -9.20.2 | - | - |
| 08 Oct 2001 | Ski | -10.50.3 | - | - |
| 11 Nov 2001 | SAAO | -9.00.3 | 1.17 | 2105 |
| 11 Sep 2002 | Ski | -13.10.4 | - | - |
| 13 Dec 2002 | SAAO | -11.60.2 | 1.30 | 2145 |
| 06 Oct 2003 | Ski | -11.00.5 | - | - |
| 24 Oct 2004 | Ski | -13.10.4 | - | - |
| 21 Mar 2005 | SAAO | -12.80.2 | 1.34 | 1795 |
| 16 Aug 2005 | Ski | -14.70.3 | - | - |
| 17 Aug 2005 | Ski | -14.90.2 | - | - |
All of the H lines showing resolved structures are presented in Figure 1. They are arranged chronologically in this figure, with the height of the H line linearily related to its equivalent width. A clear evolution of the Balmer line over the 10 year period is seen, progressing from modest emission, through an almost complete disk loss phase, back to strong emission. Comparison with the previous 10 years worth of data presented in Clark et al. (1998) shows the current emission line strength to be comparable with the largest values seen at any time in the last two decades. In addition to the strength of the H equivalent width, the V/R ratio was determined where possible. These values are also included in Table 1.
It is worth noting that the He 6678Å line shows a similar pattern of behaviour to the H line – going through an almost complete loss of emission in 1998, and then slowly reverting to a clear emission feature by 2005.

3 IR data
IR data on A 0535+26 have been collected since 1987 from the 1.5m Telescopio Carlos Sanchez in Tenerife, Spain. The data were reduced following the procedure described by Manfroid (1993). Instrumental values were transformed to the TCS standard system (Alonso, Arribas & Martinez-Roger 1998). The dates and results of the IR observations are presented in Table 2. and shown in Figure 2.

| Date | MJD | J | J error | H | H error | K | K error |
|---|---|---|---|---|---|---|---|
| 02-01-95 | 9720.663 | 7.994 | 0.005 | 7.756 | 0.006 | 7.479 | 0.004 |
| 03-01-95 | 9721.54 | 7.998 | 0.007 | 7.75 | 0.001 | 7.504 | 0.001 |
| 04-01-95 | 9722.625 | 8.035 | 0.005 | 7.786 | 0.005 | 7.522 | 0.003 |
| 05-01-95 | 9723.524 | 8.030 | 0.014 | 7.785 | 0.013 | 7.527 | 0.008 |
| 25-04-95 | 9833.355 | 8.029 | 0.002 | 7.758 | 0.003 | 7.522 | 0.002 |
| 29-04-95 | 9837.363 | 8.078 | 0.005 | 7.828 | 0.001 | 7.554 | 0.009 |
| 11-10-95 | 10002.69 | 8.070 | 0.004 | 7.758 | 0.003 | 7.63 | 0.003 |
| 11-10-95 | 10002.72 | 8.074 | 0.003 | 7.746 | 0.002 | 7.641 | 0.003 |
| 14-10-95 | 10005.73 | 7.917 | 0.002 | 7.702 | 0.004 | 7.475 | 0.004 |
| 13-01-96 | 10096.59 | 7.784 | 0.005 | 7.562 | 0.005 | 7.349 | 0.001 |
| 16-03-96 | 10159.44 | 8.050 | 0.009 | 7.695 | 0.006 | 7.524 | 0.006 |
| 17-03-96 | 10160.45 | 7.869 | 0.004 | 7.603 | 0.003 | 7.349 | 0.003 |
| 27-10-98 | 11114.652 | 8.518 | 0.033 | 8.469 | 0.016 | 8.423 | 0.044 |
| 28-10-98 | 11115.709 | 8.452 | 0.008 | 8.316 | 0.004 | 8.247 | 0.000 |
| 30-7-99 | 11390.734 | 7.944 | 0.014 | 7.710 | 0.016 | 7.494 | 0.019 |
| 31-7-99 | 11391.731 | 8.038 | 0.018 | 7.764 | 0.017 | 7.527 | 0.017 |
| 1-8-99 | 11392.732 | 8.048 | 0.033 | 7.798 | 0.026 | 7.545 | 0.020 |
| 02-10-99 | 11454.616 | 8.055 | 0.015 | 7.794 | 0.015 | 7.538 | 0.015 |
| 03-10-99 | 11455.707 | 8.046 | 0.014 | 7.790 | 0.015 | 7.541 | 0.015 |
| 04-10-99 | 11456.703 | 8.066 | 0.017 | 7.822 | 0.011 | 7.562 | 0.011 |
| 06-10-99 | 11458.747 | 8.048 | 0.016 | 7.804 | 0.010 | 7.559 | 0.011 |
| 17-01-00 | 11561.566 | 7.874 | 0.023 | 7.642 | 0.014 | 7.445 | 0.010 |
| 17-01-00 | 11561.578 | 7.898 | 0.024 | 7.641 | 0.015 | 7.417 | 0.012 |
| 21-01-00 | 11565.592 | 7.863 | 0.015 | 7.601 | 0.016 | 7.381 | 0.019 |
| 22-01-00 | 11566.512 | 7.832 | 0.023 | 7.596 | 0.014 | 7.388 | 0.015 |
| 22-01-00 | 11566.632 | 7.884 | 0.023 | 7.649 | 0.015 | 7.388 | 0.014 |
| 16-10-00 | 11834.772 | 7.609 | 0.023 | 7.378 | 0.032 | 7.128 | 0.037 |
| 17-10-00 | 11835.760 | 7.567 | 0.015 | 7.324 | 0.010 | 7.065 | 0.011 |
| 18-10-00 | 11836.700 | 7.602 | 0.014 | 7.318 | 0.010 | 7.050 | 0.010 |
| 11-01-01 | 11921.479 | 7.512 | 0.032 | 7.273 | 0.014 | 7.017 | 0.015 |
| 14-01-01 | 11924.506 | 7.544 | 0.023 | 7.282 | 0.023 | 7.037 | 0.023 |
| 15-01-01 | 11925.511 | 7.500 | 0.024 | 7.259 | 0.023 | 7.024 | 0.023 |
| 16-01-01 | 11926.506 | 7.513 | 0.010 | 7.278 | 0.010 | 7.033 | 0.015 |
| 17-01-01 | 11927.503 | 7.533 | 0.023 | 7.259 | 0.014 | 7.003 | 0.014 |
| 15-01-02 | 12290.568 | 7.65 | 0.01 | 7.44 | 0.01 | 7.10 | 0.01 |
| 29-12-04 | 13369.651 | 7.54 | 0.04 | 7.28 | 0.03 | 7.05 | 0.03 |
| 30-12-04 | 13370.616 | 7.53 | 0.03 | 7.27 | 0.02 | 7.09 | 0.02 |
4 X-ray data
X-ray monitoring data were collected by the All Sky Monitor (ASM) instrument on the Rossi X-ray Timing Explorer (RXTE) observatory. The data consist of daily flux averages covering the X-ray energy range 1.3 – 12.1 keV. The measurements are interrupted once per year for a few days while the sun passes within a few degrees of A 0535+26. There is no evidence in the daily data averages for any significant detection of the source.
ASM data from just the outburst period are shown in Figure 3. In this figure the vertical flux scale in the top panel has been presented showing a clear exponential rise with a doubling timescale of 7d. Though flux measurements during the peak to decline phase are much fewer, it is still possible to estimate the decline timescale. This was much faster than the rise, with the flux falling by a factor of 2 in no more than 2d. The total duration of the outburst was 70d. In the lower panel the ratio of two separate X-ray bands (called the HR2 ratio: (5 – 12 keV)/(3 – 5 keV)) is presented, showing little evidence for any hardness changes throughout the outburst.

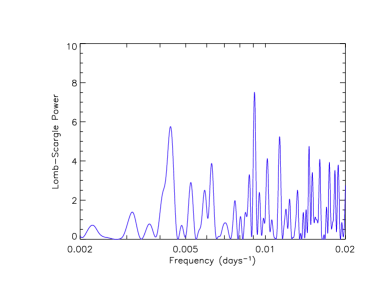
The 10 years worth of data, not including the present outburst, were searched for any very low-level repetitive modulation around the known orbital period of 110d (Finger et al. 1994, 1996). A simple Lomb-Scargle analysis of the raw data for the period MJD = 50087 - 53495 immediately revealed a clear peak at a period around 110d (See Figure 4).
Various checks were carried out to establish confidence in this 110d period:
-
•
Individual daily averages containing less than 5 measurements (“dwells”) were rejected from the data sample. This reduces the number of outlying points in the data. However, this did not significantly affect the position or strength of the peak in the power spectrum.
-
•
The data values were randomised within the exisiting temporal structure to see if the annual gaps were in any way producing a window function with power in the region of interest. After 1000 trials the average power spectrum showed no significant features at, or close to 110d.
-
•
When the effects due to the annual modulation were removed from the lightcurve, the resulting power spectrum (Figure 4) shows a clear peak at 110.0d. The significance of this peak falling within 1d of the previously known 110d period is estimated to be 99.94%. The significance of a given peak is given by = 100 (Scargle 1982), where is the normalised power of the peak and is the number of independent frequencies within the search limits.
In addition to the Lomb-Scargle periodogram we also search for periodicities by performing a discrete Fourier transform. We extracted a 1-day average light curve from the definite 1-dwell ASM light curve. The rebinned light curve contains gaps due to the source being too close to the Sun, rejections of bins with less than 5 data points, detector failure or other instrumental causes. We filled in these gaps by interpolation. However, to prevent the interpolation procedure from affecting the final power spectrum we allowed interpolation only when the gap contained less than 1% of the total number of points in the light curve. The final light curve then contained continuous stretched of data separated by large gaps (typically of several tens of days) cause by the proximity of the source to the Sun. In order to extract the maximum amount of information from the light curves we used the discrete (slow) Fourier transform on each observational segment of data. Since the data segments had different lengths, the resulting power density spectra covered different frequency ranges. Due to the typical duration of the individual segments ( days. i.e. three cycles in the best cases) the detection of the 110-d periodicity is weak. Its first harmonic, however, is more significant. The average of local maxima at around the expected frequency of the first harmonic results in a peak that corresponds to 532 days.
-
•
Finally we note that the orbital precession period of the RXTE spacecraft is in the range 50 – 51d (gradually changing over the 10 years) and hence cannot be responsible for a peak around 110d.
From Figure 4 a clear peak at 110.00.5d is evident. The period error is determined using the method of Horne & Baliunas (1986) in section II.c.
This is consistent with the binary period of 110.30.3d reported by Finger et al. (1996) from analysis of earlier BATSE data. If the data are then folded at this period of 110.0d the resulting modulation is shown in Figure 5, which shows an apparent low amplitude sinusoidal modulation with a semi-amplitude of () counts.
Alternatively see Figure 6. In this version of the figure the folded light curve is obtained from sets of -binned folded light curves. To begin with, the light curve is folded at the desired period and the time values converted into orbital phase values. This “raw” folded light curve is then binned into bins (of size ) in the standard way, with each bin starting at phase (with ); the error on each bin is taken to be the standard deviation of the flux values within it. This step is repeated again, but this time the bins start at phase . In this way we create folded light curves, each consisting of bins, but differing in the starting phase of their bins, the general expression of which is . Now each bin in the folded light curves is sub-divided into bins, all of which have the same flux value. The final folded light curve will have bins, each of which is the average of the bins (at the same phase) from the sets of previous lightcurves. The error for each bin is the standard error of the values averaged for each -bin. This method is explained in Laycock (2002)
This method provides an efficient way of generating folded light curves from poorly sampled data, or data with low S/N. Their shape will not depend on the starting point at which they are folded and, although only every bin will be independent, spurious flux values within bins will be evened out creating a smoother profile. Explanations of the negative effects on pulsar profiles associated with folding at inapropriate starting points can be found in Carstairs (1992), while the effects of varying bin widths (albeit for slightly different purposes) is studied by De Jager et al. (1989).

Figure 5: RXTE/ASM data (not including the outburst) folded at the period of 110.0d 
Figure 6: RXTE/ASM data (not including the outburst) folded at the period of 110.0d. The folding technique used here differs from that in Figure 5 in that the pulse shape of the folded light curve is independent of the point at which one starts the fold - see text for details. If this modulation indicates increased X-ray activity associated with periastron passages of the neutron star, then the ephemeris derived from it is:
d
JD.
5 Discussion
5.1 Comparison with previous outbursts
Be/X-ray binaries may show two types of X-ray outbursts which, in the generally accepted terminology, are known as Type I and Type II (after Stella, White & Rosner 1986). Sometimes they are referred to as ‘normal’ and ‘giant’ (after Motch et al. 1991). Type I outbursts are tightly linked to the orbital phase as they occur at or close to periastron passage. The X-ray luminosity is well below erg s-1. In contrast, Type II outbursts may take place at any orbital phase, are accompanied by strong spin up of the neutron star and the X-ray luminosity may reach Eddington values.
The X-ray outburst discussed here is classifiable as a Type II event. The classification as a giant outburst becomes apparent when a comparison with previous outbursts is drawn. A 0535+26 has shown four other such events in its 30 years of history:
-
1.
1975 April, which led to its discovery by the Ariel V satellite (Rosenberg et al. 1975),
-
2.
1980 October, when the 110-day periodicity was first suggested (Nagase et al. 1982),
-
3.
1989 April, which seems to be the most intense outburst with a peak intensity of 8.9 Crab in the energy range 2–26 keV (Sunyaev et al. 1989) and the first report on a cyclotron line was made (Kendziorra et al. 1994), and
-
4.
1994 February, when a QPO was first reported, indicative of the presence of an accretion disk (Finger et al. 1996).
In all these outbursts the X-ray flux exceeded the flux of the Crab, the duration was 50 days and they occurred at random binary phases.
To determine the absolute flux from A 0535+26 during the May/June 2005 event the RXTE/ASM count rates may be used. 1 ASM count s-1 = erg cm-2 s-1 and the peak detected by ASM was 100 count s-1 (1.3 Crab). Thus, assuming a distance of 2 kpc (Steele et al. 1998) this implies a peak source luminosity of erg s-1. The initial report of this outburst from the SWIFT observatory (Tueller et al. 2005) stated that the source had a brightness that exceeded 3 times the Crab in the BAT instrument energy range (15 – 195 keV), somewhat brighter than the ASM (1.3 – 12.1 keV) data, suggesting a hard spectrum. A hard spectrum has also been reported in other outbursts (Sunyaev et al. 1989, Motch et al. 1991). We can estimate how much larger the hard flux is expected to be with respect to the soft flux in Crab units by using the spectral parameters derived from model fits to observations obtained during bright states. The spectrum of A 0535+26 during a Type II outbursts is well represented by a a power-law component with below 20 keV which decays exponentially above that energy (Ricketts et al. 1975, Finger at al. 1994, Kendziorra et al. 1994). Performing an order of magnitude calculation we consider a power law with , an exponential cut off with keV and assume that the spectrum of the Crab is represented by a single power law with . Simulating the spectra of the Crab and A 0535+26 using XSPEC we find that the flux in the 20 – 100 keV range is expected to be 2 – 4 times larger than the flux in the range 1 – 12 keV (in Crab units), in agreement with the observed flux from SWIFT and ASM.
The May/June 2005 event began on TJD 3496 (6 May 2005 – see Figure 3). This corresponds to a phase of 0.91 using the ephemeris given in Section 4 above and hence is 10 days earlier than the phase for a Type I outburst. Though, of course, the duration of the outburst extends through phase 0.0 to phase 0.56 and so encompasses the expected periastron passage. The duration of the outburst was days, which is longer than typical for Type II events – Type I outbursts last typically less than 15 days. We find that this outburst has characteristics of both Type I and Type II events.
In addition to the 110-day periodicity, another clock seems to be present in A0536+26. As mentioned above, A0536+26 has so far shown five major outbursts. The recurrence time is about 5 years. However, they appear in groups of two with the third one being missing. There were such outbursts in 1975 and 1980 but not 5 years later in 1985; and then two more outbursts in 1989 and 1994 but not in 1999/2000. Maybe the latest 2005 outburst will be repeated 5 years hence (around 2010) but not in 2015.
The profile of the outburst is unusual. Instead of the rapid rise and slower decay typical of these types of outburst, in the May/June 2005 outburst A 0535+26 shows an exponential flux rise and an even more rapid decay in flux. One possibility is that the slower rise is due to the formation of an accretion disk around the neutron star. Conversely, the 1994 Type II outburst was preceeded by a series of smaller outbursts and the resultant rise in X-ray emission was very much more rapid. So the accretion disk in some form may already have been present by the time the giant ourburst began.
5.2 Circumstellar disk
Following on the work in Haigh et al. (2004) it is possible to use the H peak size and separation to estimate the circumstellar disk, or at least the part emitting in the H line. The mass of the companion was assumed to be 20; then supposing a mass function of 1.64 (Finger et al. 1996) an inclination for the orbit of is derived. (Note that we have used different values for the mass of the Be star and the inclination of the orbit to those used by Haigh et al. (2004).)
Assuming a Keplerian velocity distribution of the matter in the circumstellar disk, we can use the peak separation of the doubly-peaked H emission lines to gauge the radius of the H emitting region (Huang, 1972). Then where is the projected velocity at the outer edge of the H emitting region. The true velocity is then where , the inclination of the disk, is assumed to be the same as the inclination of the orbit: . The radius of the outer edge of the H emitting region of the disk is then given by:
| (1) |
It is known that a correlation between peak separation () and the equivalent width of the H emission line exists (Hanuschik 1989, Zamanov et al. 2001). We used a linear relationship between these emission line properties to derive values for the peak separation, and hence the radius, for observations where the data were of a quality to allow a measurement of the H equivalent width but not of the H .
It is important to note that there is strong evidence that the circumstellar disk temperature remains largely unchanged throughout most of the period of time covered by this work. This is evidenced by the (J-K) data presented in the lower panel of Figure 2 which only show a significant deviation from (J-K)-0.5 during the time of the major disk loss.
Figure 7 shows the H emitting radius as a function of time. Plus symbols indicate where direct measurements of were used to determine the radius while diamonds indicate where the method described above was employed to estimate the radius. Values of radius are consistently below those in Haigh et al. (2004) due to the different orbital parameters used in this paper.

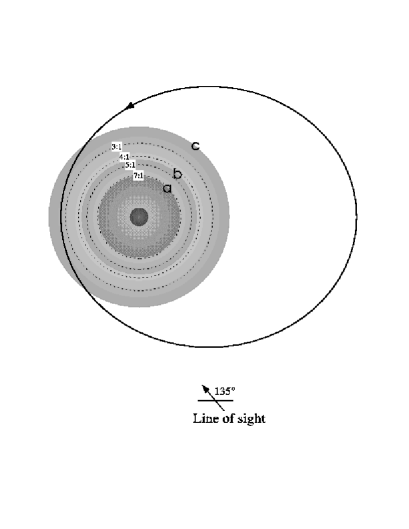
Figure 8 shows the relative sizes of the H emitting regions disk (deduced from H measurements) during three different epochs, the largest (disk ) being the size in August 2005, shortly after the outburst. The middle disk (disk ) is the size in March 2005, shortly before the outburst, while the smaller disk (disk ) is the size during the period of December 2001 to December 2003 (no measurements are available between this last date and March 2005). The orbital shape comes from the solution in Finger et al. (1996).
The H emitting disk size indicated by is at the 7:1 resonance radius of Okazaki and Negueruela’s (2001) model of A 0535+26. The disk remained stable at this radius for at least 2 years (see Figure 7) prior to the May/June 2005 outburst. The truncation radius places a limit on the absolute size of the circumstellar disk, while measuring gives us an indication of the H emitting region. If these two radii are the same, as they seem to be in the case of A 0535+26, it suggests that the entire disk emits H radiation.
For accretion of matter onto the neutron star to occur in sufficient amounts to cause a Type I outburst, the circumstellar disk must reach the 4:1 resonance radius (Okazaki and Negueruela, 2001). Disk , measured 45 days before the outburst, is half way between the 5:1 and 4:1 radii, and probably growing; given that the May/June outburst (using the ephemeris presented in this work from the RXTE/ASM data) started at phase 0.91 (peaking at phase 0.17 and ending at phase 0.56), it seems probable that the disk had grown to at least the 4:1 resonance radius. Furthermore, the fact that the outburst was comparable in brightness to previous Type II outbursts exhibited by this system (1.3 Crab compared to 1.5 - 4.5 Crab), and also longer (72 vs 55 days) suggests that this is a peculiar Type II outbursts, as the disk continued to grow as the outburst progressed. This could explain the continued rise in X-ray luminosity through the first 40 days of the outburst and its subsequent rapid deline when the neutron star exited the circumstellar disk with only residual matter in its own accretion disk to fuel the X-ray emission.
The mechanism for the May/June 2005 outburst appears to be different to that which caused the 1994 outburst (as described by Haigh et al. 2004). In 1994 the disk went from one truncation radius to the next smallest, thus allowing the matter between these two truncation radii to be accreted by the neutron star. There is no evidence for this occuring in the May/June 2005 outburst.
5.3 Orbital modulation during X-ray quiescence
The study of Be/X-ray binaries in quiescence is still an unexplored field. So far only a handful of BeX systems have been observed in quiescence: A0538-66, 4U 0115+63, V0332+53 (Campana et al. 2002), A0535+262 (Negueruela et al. 2000), GRO J2058+42 (Wilson et al. 2005) and SAX J2103.5+4545 (Reig et al. 2005).
According to the standard model for Be/X-ray binaries the circumstellar disk around the Be star’s equator provides the reservoir of matter that ultimately is accreted onto the neutron star and converted into X-rays. Thus, one would expect that during the X-ray quiescent state the disk would be missing or largely debilitated. In either case the propeller effect (Illarionov & Sunyaev 1975) should prevent the matter from being accreted. However, the propeller mechanism does not seem to be at work in A 0535+26, probably due to its relatively long spin period. Previous works by Negueruela et al. (2000) and Orlandini et al. (2004) have demonstrated that it is possible to detect this source during quiescent states. While X-ray pulsations during this low-intensity states have been reported (Motch et al, 1991), this is the first time that the quiescent emission is shown to be modulated with the orbital period of the system.
The theoretical explanation for quiescent X-ray emission has been put forward by Ikhsanov (2001), who shows that the accreting plasma can enter the magnetosphere through magnetic line reconnection. Under this condition the quiescent X-ray luminosity of A 0535+26 can be explained provided the mass capture rate by the neutron star from the wind of the Be companion is M⊙ yr-1. This condition is definitely satisfied at orbital phase 0, i.e., at periastron, while although not impossible it is more difficult to achieve at other orbital phases.
It is interesting to compare our values for the ephemeris of periastron determined from the low-level RXTE X-ray modulation with that determined by Finger et al. (1996). The latter authors used three Type I outbursts detected by BATSE to determine the values for the times of periastron (see their Table 1). Extrapolating their values over 10 years to July/Aug 2005 results in a phase discrepancy between the ephemeris presented here, and their prediction for periastron, of t = 33 13d. Note that the width the peak representing periastron passage in Figure 6 is 0.2 in phase (22d), and hence had we chosen one of the extreme edges of the peak then this discrepancy would only be t = 21 13d.
6 Conclusions
The results presented here show the recovery of strong X-ray emission from the A 0535+26 system after 10 years of quiescence. Although it is known that A 0535+26 exhibits X-ray activity in this state, this is the first time an orbital modulation has been detected in the quiescent X-ray (using data from the RXTE/ASM). The period found at days is in agreement with that calculated by Finger et al. (1996) from a series of Type I outbursts in 1994. The May/June outburst began 10 days before periastron; however, it is classified as a Type II outburst in this work due to its high luminosity ( erg s-1) and long duration (72 days, the longest this system has undergone); its hard spectrum is also consistent with previous Type II outbursts. Optical data taken shortly after outburst show clear evidence that the Be star’s circumstellar disk is still very large, extending beyond the point of periastron passage.
7 Acknowledgements
This paper uses observations made from the South African Astronomical Observatory (SAAO), and quick-look results provided by the ASM/RXTE team. VAM acknowledges support from the South African NRF and the British Council in the form of a SALT/Stobie studentship. Skinakas Observatory is a collaborative project of the University of Crete, the Foundation for Research and Technology-Hellas and the Max-Planck-Institut für Extraterrestrische Physik.
References
- (1) Alonso A., Arribas S. & Martinez-Roger C. 1998 A&AS 131, 209.
- (2) Campana, S., Stella, L., Israel, G. L., et al. 2002, ApJ, 580, 389
- (3) Carstairs, I.R. 1992, PhD Thesis, Uni. of Southampton
- (4) Clark J.S. et al. 1998 MNRAS 294, 165.
- (5) Coe M.J., Carpenter G.F., Engel A.R. & Quenby J.J. 1975 Nature 256, 630.
- (6) Coe M.J. 2000 in “The Be Phenomenon in Early-Type Stars”, IAU Colloquium 175, ASP Conference Proceedings, Vol. 214, ed: M. A. Smith H. F. Henrichs. Astronomical Society of the Pacific, p.656.
- (7) De Jager, O.C., Swanepoel, J.W.H. & Raubenheimer, B.C. 1989, A&A 221, 180
- (8) Finger M.H., Cominsky L.R., Harmon B.A. & Fishman G.J. 1994 in AIP Proc 308 “The evolution of X-ray binaries” ed. S. Holt & C.S. Day (new York, AIP), 459.
- (9) Finger M.H., Wilson R.B. & Harmon B.A. 1996, ApJ 459, 288.
- (10) Haigh, N.J., Coe, M.J., Steele, I.A. & Fabregat, J. 1999, MNRAS, 310, L21
- (11) Haigh N.J., Coe M.J. & Fabregat J. 2004, MNRAS, 350, 1475.
- (12) Hanuschik, R.W. 1989, Ap&SS, 161, 61
- (13) Horne, J.H. & Baliunas, S.L. 1986, ApJ 302, 757
- (14) Huang, S. 1972, ApJ, 171, 549
- (15) Ikhsanov, N.R. 2001, A&A, 367, 549
- (16) Illarionov, A. F., & Sunyaev, R. A. 1975, A&A, 39, 185
- (17) Kendziorra E., Kretschmar P., Pan H.C., et al. 1994, A&A, 291, L31
- (18) Laycock, S.G.T. 2002, PhD Thesis, Uni. of Southampton.
- (19) Manfroid J. 1993, A&A 271, 714.
- (20) Motch C., Stella L., Janot-Pacheco E. & Mouchet M. 1991, ApJ 369, 490.
- (21) Nagase F., Hayakawa S., Kunieda H., et al. 1982, ApJ, 263, 814
- (22) Negueruela I., Reig P., Finger M.H. & Roche P. 2000, A&A 356, 1003.
- (23) Okazaki A.T. & Negueruela I., 2001, A&A 377, 161.
- (24) Orlandini M. et al. 2004, Nuclear Phys B 132, 476.
- (25) Reig, P., Negueruela, I., Papamastorakis, G, Manousakis, A, Kougentakis T., 2005, astro-ph/0505319
- (26) Rosenberg F.D., Eyles C.J., Skinner G.K. & Willmore A.P. 1975, Nature 256, 628.
- (27) Scargle, J.D.: 1982, ApJ 263, 835
- (28) Smith D.M., Hazelton B., Coburn W., Boggs S.E., Fivian M., Hurford G.J., Hudson H.S., Grefenstette B & Gilmore R. 2005, ATEL 557.
- (29) Stella L., White N.E. & Rosner R. 1986, ApJ 308, 669.
- (30) Steele I., Negueruela I., Coe M.J. & Roche P.D. 1998, A&A 297, L5.
- (31) Sunyaev, R., et al. 1989, IAUCirc 4769
- (32) Tueller J., Ajello M., Barthelmy S., Krimm H., Markwardt C., Skinner G. 2005, ATEL 504.
- Wilson et al. (2005) Wilson, C.A., Weisskopf, M.C., Finger, M.H., et al. 2005, ApJ, 622, 1024.
- (34) Zamanov, R.K., Reig, P., Martí, J. et al. 2001, A&A, 367, 884