Water destruction by X-rays in young stellar objects
Abstract
Aims. We study the H2O chemistry in star-forming environments under the influence of a central X-ray source and a central far ultraviolet (FUV) radiation field. The X-ray models are applied to envelopes around low-mass Class and I young stellar objects (YSOs).
Methods. The gas-phase water chemistry is modeled as a function of time, hydrogen density and X-ray flux. To cover a wide range of physical environments, densities between – cm-3 and temperatures between – K are studied.
Results. Three different regimes are found: For K, the water abundance is of order – and can be somewhat enhanced or reduced due to X-rays, depending on time and density. For K K, H2O is reduced from initial following ice evaporation to for ergs s-1 cm-2 ( yrs) and for ergs s-1 cm-2 ( yrs). At higher temperatures ( K) and hydrogen densities, water can persist with even for high X-ray fluxes. Water is destroyed in both Class and I envelopes on relatively short timescales ( yrs) for realistic X-ray fluxes, although the effect is less prominent in Class envelopes due to the higher X-ray absorbing densities there. FUV photons from the central source are not effective in destroying water.
Conclusions. X-rays reduce the water abundances especially in regions where the gas temperature is – K for fluxes – ergs s-1 cm-2. The affected regions can be envelopes, disks or outflow hot spots. The average water abundance in Class I sources for ergs s-1 is predicted to be . Central UV fields have a negligible influence, unless the photons can escape through cavities.
Key Words.:
Stars: formation – ISM: molecules – X-rays: ISM – Molecular processes – Astrochemistry1 Introduction
The importance of water in star-formation is unquestioned. Water is found abundantly on dust grains as well as in the gas-phase of molecular clouds, cores, envelopes and protostellar disks. It is a key molecule in the hot ( K) gas-phase chemistry and is one of the main gas coolants. The evolution over time of molecular cores influences the abundance of H2O (Ceccarelli et al. ch96 (1996)), making it sensitive to the chemical age of a source. Through its masing ability, water has been used to study dynamical properties of star-forming regions.
In cold gas ( K), water is mainly produced by ion-molecule reactions. At temperatures above K, H2O is largely produced in reactions of O and OH with H2. Water is also efficiently generated on dust grains where it forms an icy mantle. Observed abundances of water ice are typically with respect to H2 (Tielens et al. tt91 (1991); Boogert et al. bp04 (2004)). At temperatures K, H2O evaporates into the gas-phase and has a major impact on the chemistry (van Dishoeck & Blake vb98 (1998); Doty et al. dv02 (2002)). Water is also believed to be formed in shocked regions where it may be produced due to the high gas temperature and/or may be released from grains. Towards high-mass star-forming regions, hot ( K) gas-phase water is usually observed with abundances , comparable to the ice abundance – whereas at temperatures below K, it is found to be approximately times less abundant (e.g., Boonman & van Dishoeck bv03 (2003), van der Tak et al. vw05 (2005)). The observed water emission towards low-mass objects has been interpreted with similar jumps at K (Ceccarelli et al. cc00 (2000); Maret et al. mc02 (2002)). Although the solid water abundances are comparable in low and high-mass regions, the hot gas-phase water in low-mass sources seems to be much less abundant than in the massive objects. In addition, a fraction of the emission is believed to arise in outflow regions, as inferred from observations both on and off source with the Long Wavelength Spectrometer (LWS) on board the Infrared Space Observatory (ISO) (Giannini et al. gn01 (2001); Benedettini et al. bv02 (2002)). Nisini et al. (ng02 (2002)) compared the far-infrared spectra of both Class and Class I sources. Water lines were found to be prominent in the spectra of Class objects but they were not detected toward Class I sources corresponding to an upper limit on the abundances of .
Protostars are often found to be sources of strong X-ray fluxes (e.g., Casanova et al. cm95 (1995); Koyama et al. kh96 (1996); Imanishi et al. ik01 (2001)). The observed X-rays are understood to be thermal emission from magnetic stellar activities or from the disk-star system (e.g., Feigelson & Montmerle fm99 (1999)). Typical X-ray luminosities range from – ergs s-1 in the – keV band with plasma temperatures between – keV (e.g., Imanishi et al. ik01 (2001)). Flares can even lead to plasma temperatures temporarily exceeding K with luminosities higher than ergs s-1. Within the Chandra Orion Ultradeep Project (COUP), Preibisch et al. (pk05 (2005)) found a ratio for the X-ray luminosity to the bolometric luminosity of for Class I and older protostars. No X-ray detection has been reported to date toward Class objects (Hamaguchi et al. 2005a ). However, this might be due to the large X-ray absorbing hydrogen and dust column densities found in these sources. The nature of the sources in recent reports of X-ray detections towards very young objects is poorly known and they could be either Class or I objects (Hamaguchi et al. 2005b ; Forbrich et al. fp05 (2005)).
The influence of a central X-ray source on the envelope around young stellar objects has recently been studied by Stäuber et al. (sd05 (2005)). It was found that the ionization rate in the inner region of the surrounding envelope may be dominated by the ionizing X-ray flux rather than by an inner far ultraviolet (FUV) radiation field or the cosmic-ray ionization rate. The ionizing flux enhances H and He+ that trigger a distinct chemistry. It was also found that the H2O abundances in the gas-phase may be reduced due to X-rays. The abundance and behavior of H2O in both the solid and the gas-phase will be studied extensively with the upcoming Herschel Space Observatory. It is therefore timely to investigate the influence of X-rays and inner FUV fields on the abundances of gas-phase water in more detail.
In this paper, we first study the general influence of X-rays on gas-phase water. The time-dependent chemical X-ray models of Stäuber et al. (sd05 (2005)) are used and applied to different density and temperature regimes for different X-ray fluxes (Sect. 2). The densities and temperatures are chosen to cover a wide range of conditions that are applicable to cold molecular clouds, envelopes, protostellar disks and outflow hot spots. Regions with density and temperature gradients are modeled and discussed in Sect. 3. These regions are representative of low-mass Class and I envelopes. In addition to X-rays, central FUV fields are considered. The aim is to find systematic trends between the different type of sources. The results for the different envelopes are discussed in Sect. 4. The conclusions are drawn in Sect. 5.
2 General parameter study
The gas-phase water abundance is modeled as a function of time, hydrogen density () and X-ray flux. The results of this study can be applied to a wide range of different physical environments including protostellar envelopes and disks.
2.1 Chemical model
The X-ray chemistry models are described in detail by Stäuber et al. (sd05 (2005)). The models are an extension of the gas-phase chemical models of Doty et al. (dv02 (2002), ds04 (2004)) to allow the impact of X-rays from the central source on the surrounding molecular envelope. The input parameters for the model are the initial molecular or atomic abundances, the hydrogen density, the gas temperature, the X-ray luminosity, the X-ray emitting plasma temperature, the X-ray absorbing hydrogen column density, the cosmic-ray ionization rate and the enhancement of the inner and outer FUV field with respect to the average interstellar radiation field (ISRF).
The chemical model is based on the UMIST gas-phase chemical reaction network (Millar et al. mf97 (1997)) and calculates the time-dependent number density of each species for a certain temperature and distance from the source. For the initial chemical abundances we follow the models of Doty et al. (dv02 (2002), ds04 (2004)) for the high-mass source AFGL and low-mass source IRAS –. These models successfully reproduced many of the observed molecular lines. The effects of evaporation of a certain species into the gas-phase have been approximated by initially depleting this species below its evaporation temperature . Specifically, all H2O is assumed to evaporate at K. No photodesorption of ice is taken into account. The initial abundances are listed in Table 1. The adopted cosmic-ray ionization rate is discussed in Sect. 3.1.
The gas temperature has been taken to be closely coupled to the dust temperature. Although the X-ray flux and the gas temperature are not fully independent, they have been treated as uncoupled variables in order to study the dependence of H2O on each of them. To cover a wide range of different physical environments, the hydrogen density is varied between – cm-3. At higher densities, the mean free path of X-rays becomes small (a few AU). Typical densities in the inner part of envelopes or protoplanetary disk atmospheres are between – cm-3, whereas those for outflows are – cm-3. The adopted gas temperature is between – K. At higher temperatures ( K), molecular hydrogen and water are dissociated due to H and H2 collisions. The modeled X-ray fluxes are between – ergs s-1 cm-2. The initial X-ray spectrum is reduced preferentially at low energies by the intervening hydrogen column density such that the local X-ray flux roughly scales with
| (1) |
in ergs s-1 cm-2, where is the original X-ray luminosity, the X-ray absorbing column density and is the distance from the source. The X-ray fluxes are accurate within % for K and – cm-2 with , for – cm-2 with and for – cm-2 with . A column density of cm-2 absorbs all photons below keV (Stäuber et al. sd05 (2005)). The X-ray spectrum is assumed to be thermal with a plasma temperature K ( keV). The shape of the X-ray spectrum, however, has only little influence on the chemistry (Maloney et al. mh96 (1996); Stäuber et al. sd05 (2005)). FUV fields are neglected.
All reaction rates that are relevant for the H2O chemistry (Sect. 2.3) are given with a maximum uncertainty of % by the UMIST database111http://www.rate99.co.uk. Self-shielding of CO has been included by using the shielding functions of Lee et al. (lh96 (1996)).
| Species | Initial abundance | Ref. |
|---|---|---|
| Initial abundances K | ||
| CO | 2.0E-04 | a |
| CO2 | 3.0E-05 | b |
| H2O | 1.5E-04 | c |
| H2S | 1.0E-08 | d |
| H2CO | 8.0E-08 | d |
| N2 | 7.0E-05 | e |
| CH4 | 1.0E-07 | e |
| C2H4 | 8.0E-08 | e |
| C2H6 | 1.0E-08 | e |
| CH3OH | 1.5E-07 | d |
| O | 0.0 | e |
| S | 0.0 | e |
| Initial abundances K | ||
| CO | 2.0E-04 | d |
| CO2 | 0.0 | f |
| H2O | 0.0 | f |
| H2S | 0.0 | f |
| N2 | 7.0E-05 | e |
| CH4 | 1.0E-07 | e |
| C2H4 | 8.0E-08 | e |
| C2H6 | 1.0E-08 | e |
| H2CO K | 8.0E-08 | d |
| H2CO K | 0.0 | d |
| CH3OH K | 1.5E-07 | d |
| CH3OH K | 0.0 | d |
| O | 1.0E-04 | d |
| S | 6.0E-09 | g |
| Cosmic-ray ionization rate (s-1) | 0.8E-17 | h |
-
All abundances are relative to molecular hydrogen. a Jørgensen et al. (js02 (2002)), b Boonman et al. (2003a ), c Boonman & van Dishoeck (bv03 (2003)), d Doty et al. (ds04 (2004)), e Charnley (ch97 (1997)), f assumed to be frozen-out or absent in cold gas-phase, g Doty et al. (dv02 (2002)), h see text.
2.2 Results
The model results for different X-ray fluxes and hydrogen densities are shown in Figs. 1 and 2 for yrs and in Figs. 3 and 4 for yrs. It can be seen in Figs. 1 and 3 that X-ray fluxes ergs s-1 cm-2 have no or minor influence on the water abundances for the densities considered. For higher X-ray fluxes, three characteristic regimes can be distinguished: the regime at K, where gas-phase water is mainly formed and destroyed in ion-molecule reactions (–), the regime K K, where water is released from grains, but destroyed by X-rays () and the regime K, where the water abundance is . The three regimes are discussed in some detail in the following paragraphs.
At yrs, X-ray fluxes ergs s-1 cm-2 enhance the water abundance for temperatures K compared to the model without X-rays. The reason for this is the increased H3O+ abundance due to X-rays. H3O+ can recombine quickly to H2O in reactions with electrons. Note that net formation of H2O at these fluxes can occur because H3O+ does not require H2O in its formation. It is produced by ion-molecule reactions starting from CO, CO2, O, O2 and OH, which exist in the gas phase. Higher X-ray fluxes, however, can enhance water only at densities cm-3 for K (Fig. 2). At yrs, water is only enhanced at cm-3 in this temperature regime (Fig. 3). At higher densities, water is less abundant in models with X-rays compared to those without X-rays.
For K K, the initial abundance of water is much higher due to ice evaporation but this high abundance rapidly decreases for ergs s-1 cm-2 at yrs and for ergs s-1 cm-2 at yrs. H2O is mainly destroyed in reactions with H and HCO+ whose abundances are enhanced due to the X-rays. Another destruction mechanism is the dissociation of H2O by FUV photons created locally by excited H2. The rate for the X-ray induced FUV destruction of water is calculated with the method and numbers provided by Maloney et al. (mh96 (1996)). It is an adaption of the treatment of Gredel et al. (gl89 (1989)) for the effects of internally generated FUV photons by cosmic rays.
In the temperature regime K, the reaction OH H2 H2O H can become more efficient than the water destroying reactions and H2O has abundances of the order of . At low densities (– cm-3), high X-ray fluxes lead to the destruction of water even for high temperatures. Although the gas temperature at these high fluxes may be more than K, water does not reach fractional abundances higher than , since H2O is destroyed in collisions with H and H2 at higher temperatures. The water abundance is therefore for ergs s-1 cm-2 and cm-3 and for cm-3, independent of the gas temperature. At higher densities, however, even high X-ray fluxes cannot destroy water in the regime K. At densities cm-3, X-rays even enhance the water abundance () for temperatures – K compared to models without X-rays. This enhancement is again mainly through recombination reactions of H3O+.
At later times ( yrs), water is destroyed in the regime K K for ergs s-1 cm-2. The other temperature regimes in the X-ray models resemble those at yrs. The main differences with the models at yrs, however, are the water abundances of the models without X-rays. H2O is gradually destroyed in reactions with HCO+ for temperatures K. In models without X-rays, HCO+ is mainly formed by cosmic-ray induced reactions. At yrs, water between K and K is destroyed down to abundances of a few . The water abundances for K on the other hand, are slightly higher compared to the models at yrs. This is due to the relatively slow ion-molecule reactions that need time to build up water.


2.3 Chemical reactions relevant for H2O
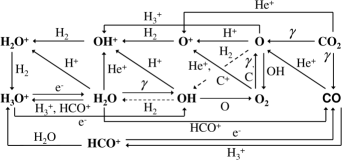
Water is assumed to be initially frozen out on the dust grains for temperatures K and injected into the gas at K with a fractional abundance . In the presence of X-rays, water is then mainly destroyed in reactions with H and HCO+. Another destruction route is the dissociation of water due to X-ray induced FUV photons. To estimate the importance of this reaction on the H2O abundance, models have been run for different X-ray luminosities ignoring this reaction. The resulting H2O abundances vary by less than % in comparison to models where this reaction is included. It emphasizes that the main destruction reactions of H2O are the ion-molecule reactions with H and HCO+, respectively.The bulk of the H2O not evaporated from the grains stems from the reaction of OH with H2, which becomes dominant for temperatures K, and from electron recombination reactions of H3O+. The adopted branching ratios for the dissociative recombination of H3O+ to H2O and OH are and , respectively (e.g., Jensen et al. jb00 (2000)). H3O+ is abundantly produced in the reactions of water with H and HCO+ in the inner region of the envelope. Further away from the source, H3O+ is most efficiently formed in the following way: H reacts with atomic oxygen to produce OH+. This is followed by a series of hydrogen abstract reactions with H2 leading to H3O+. The main source for H is the reaction of molecular hydrogen with H, which is in predominantly produced by electron impact ionization of H2. HCO+ is produced via the reaction of H with CO. OH is largely produced in recombination reactions of H3O+ and destroyed in reactions with atomic oxygen or molecular hydrogen. The chemical network with reactions and species relevant for H2O in the X-ray models is presented in Fig. 5. Photoionizations and dissociations due to inner or outer FUV fields are not shown.
3 Applications to protostellar envelopes
In order to study the influence of X-rays on the gas-phase water abundance in more realistic environments, the models are applied to envelopes of Class I (– yrs) and Class ( a few – yrs) low-mass YSOs. These regions may be characterized by a power-law density distribution and an increasing gas temperature towards the central protostar. Class and I envelopes mainly differ in their total mass. Typical envelope masses of Class objects are M☉ whereas Class I sources have less massive envelopes with M☉ (e.g., Jørgensen et al. js02 (2002), 2005a ). Although spherical D models are an approximation to the real geometry of protostellar cores, they successfully explain many of the observed features of low-mass protostars from few hundred AU out to AU scales (e.g., Schöier et al. sj04 (2004); Jørgensen et al. js02 (2002), 2005c ) and provide a framework for discussing their overall chemical structure (e.g., Doty et al. ds04 (2004); Maret et al. mc04 (2004); Jørgensen et al. jj04 (2004)). Inside a few hundred AU, however, the geometry is likely to be much more complex with cavities and a flattened protostellar disk in addition to the spherical inner envelope. Since no realistic physical models based on observations on those scales are yet available, we adopt the spherical models extrapolated to small radii as a starting point. Possible effects due to cavities and non-spherical symmetry are discussed throughout this section and in Sect. 4.
In the following models, the H2O chemistry is assumed to be irradiated by X-rays and FUV photons from the central source. The FUV models have been described in detail by Stäuber et al. (sd04 (2004)).
3.1 Class I envelope model
The density and temperature profiles adopted for a prototypical Class I source are presented in Fig. 6 and Table LABEL:tmod, based on the observations by Jørgensen et al. (js02 (2002)). In that analysis, it was assumed that the gas temperature equals the dust temperature. X-rays and FUV fields, however, are able to increase the gas temperature due to photoelectric heating. The gas temperature has therefore been explicitly calculated for the different X-ray and FUV fluxes. The X-ray luminosity is varied between – ergs s-1 and the FUV field from the central source () at the inner radius from to with respect to the average ISRF. The heating rate due to X-rays is taken from Maloney et al. (mh96 (1996)), and for the FUV heating we follow Bakes & Tielens (bt94 (1994)). The heating rates are then compared to the cooling rate due to gas-dust collisions provided by Hollenbach & McKee (hm89 (1989)). At lower densities ( cm-3) line cooling due to C+, O and CO also becomes important (see also Doty & Neufeld dn97 (1997)), but these effects are minor for our purpose since the densities in the regions of interest are always cm-3.
It is found that only X-ray luminosities ergs s-1 lead to a noticeable increase in the gas temperature ( K). The results for ergs s-1 and ergs s-1 are plotted in Fig. 6. The temperature of the gas is only affected in the inner AU by the central FUV field (not shown in Fig. 6). High FUV fields () are needed though to increase the gas temperature significantly above the dust temperature.
The effects of the outer FUV field can be neglected. The optical depth in the region of interest ( K) is and all FUV photons should be absorbed by the outer envelope for typical values of the ISRF. The outer FUV field is taken to be according to the average ISRF.
The adopted value of the cosmic-ray ionization rate s-1 is based on the results of Stäuber et al. (sd05 (2005)) who showed that low- lines of HCO+ tend to trace the cosmic-ray ionization rate, whereas high- lines are more sensitive to the ionizing inner X-ray flux. To constrain , the rate is varied in our models in order to fit the HCO+ – observations toward the low-mass star-forming region Taurus (TMC ) of Hogerheijde et al. (hv97 (1997)). It is found that s-1 fits the observations best. This value is at the lower end of the rates found by van der Tak & van Dishoeck (vv00 (2000)) toward high-mass star-forming regions (– s-1).
| 0.66 L☉ | |
|---|---|
| Envelope parameters: | |
| Inner radius ( K) | 3.1 AU |
| Outer radius ( K) | 4.3 AU |
| Density at 1000 AU, | 8.8 cm-3 |
| Density power-law index, | 1.6 |
| Gas mass ( K) | 0.034 M☉ |
| Column density | cm-2 |


3.2 Results for the Class I model
3.2.1 X-ray models
The depth dependent water profiles for yrs to yrs and for X-ray luminosities – ergs s-1 are presented in Fig. 7. The inner FUV field is neglected in these models. It can be seen that an X-ray luminosity of ergs s-1 destroys the gas-phase H2O within less than yrs from initial down to with respect to molecular hydrogen. For an X-ray luminosity of ergs s-1 the timescale to destroy water is yrs. In models with ergs s-1, water has still high abundances () in the innermost part of the envelope. We therefore conclude that X-ray luminosities ergs s-1 destroy all gas-phase water down to fractional abundances of on timescales yrs and ergs s-1 on a timescale of a few yrs.
The water profile for yrs and higher X-ray luminosities is shown in Fig. 8. The fractional abundances increase from to for increasing X-ray luminosities between – ergs s-1, and reaches even in the innermost part of the envelope for ergs s-1. This effect can be explained by the fast electron recombination reaction of H3O+ that forms H2O and by the increasing gas temperature with increasing X-ray flux: The reaction of OH with H2, that drives oxygen into H2O, becomes faster than the destruction of water by X-rays at higher temperatures, hence more water is produced for higher X-ray fluxes. In the region K, decreases with increasing X-ray luminosity for yrs, until ergs s-1. Higher X-ray luminosities lead to higher water abundances. This is again mainly due to the recombination of H3O+, which is more abundant in models with high X-ray fluxes (see also Sect. 2). Fig. 8 shows that increases from – to with increasing X-ray luminosity ( ergs s-1). At early times, the recombination of H3O+ in the models with X-rays leads to even higher H2O abundances in the region K compared with the model without X-rays (Fig. 7).
The OH abundance profiles for different X-ray luminosities at yrs are given in Fig. 9. The OH densities are normalized by (left) and by (right), respectively. In the right part of Fig. 9 it can be seen that an X-ray luminosity ergs s-1 leads to , whereas X-ray luminosities ergs s-1 can produce ratios of – in the innermost part of the envelope. The ratio in the hot ( K) region of the envelope in the models without X-rays is only of the order of . X-rays therefore enhance the OH abundances as well as the OH to H2O abundance ratio.
The high densities ( cm-3) and temperatures ( K) in the model at AU may be appropriate either to an inner envelope or to the inner regions of a circumstellar disk. However, there is also evidence for cavities in the inner few hundred AU (e.g., Jørgensen et al. 2005b ). We have therefore also modeled an envelope where is assumed to be at AU with a temperature K. This corresponds to a source with L☉. The results for yrs are presented in Fig. 10. H2O is destroyed by the X-rays and has abundances . At larger radii ( AU) the dust will not be heated above K, i.e., the temperature where water evaporates into the gas phase, and the water abundances will stay below .


3.2.2 FUV models
The H2O profiles for different inner FUV fields (–) are presented in Fig. 11. The X-ray emission has been neglected in these models. As can be seen, inner FUV fields affect the water abundances only in the inner – AU. This is due to the high hydrogen densities ( cm-3) in this region that absorb the FUV photons very quickly. Although the FUV photons from the central source can destroy H2O in the innermost region, even very high FUV fields () cannot destroy H2O out to AU.
The FUV photons may reach distances in the envelope further away from the source by traveling through the outflow cones until they are scattered back into the envelope by dust grains (Spaans et al. sh95 (1995); Jørgensen jj04 (2004)). However, the influence of the scattered photons is restricted to a small region around the outflow walls, since the FUV photons are absorbed quickly at these high densities and therefore water will not be destroyed on large scales.
Another possibility for the inner FUV field to affect larger distances might be a somewhat clumpy envelope. Models of clumpy photodissociation regions have shown that the FUV photons can travel deeper into the molecular cloud (Meixner & Tielens mt93 (1993)). At large radii with lower densities, the FUV photons primarily heat the gas and not the dust. H2O desorption will therefore not be much affected - but H2O gas may be photodissociated. Spaans & van Dishoeck (sv01 (2001)) have shown that an inhomogeneous density distribution in molecular clouds lowers the column density of H2O by more than an order of magnitude compared with the homogeneous cloud model. The advent of ALMA or space-based far-infrared interferometers might help to investigate the possibility of clumpy envelopes in more detail, since a spatial resolution of ″ is needed to resolve the region of interest.
Models where a central X-ray source and circumstellar FUV fields were combined showed similar results for the influence of the FUV photons. It is thus concluded that X-rays clearly dominate the chemistry of the envelope in comparison to FUV fields.


3.2.3 Other species
Depth dependent fractional abundances of the main species involved in the water reaction network are presented in Fig. 12 for yrs. Atomic oxygen is mainly produced by the X-ray induced FUV dissociation of O2 and the dissociative ionization of CO by He+. Atomic oxygen reaches fractional abundances of in the inner warm ( K) region. The OH+ abundance is dramatically increased by X-rays (see also Stäuber et al. sd05 (2005)). The fractional abundance of OH+ is for ergs s-1, for ergs s-1 and for ergs s-1 in the inner region of the envelope. It is mainly produced in the ion-molecule reactions of O with H, O+ with H2 and OH with H+.
O2 has fractional abundances – in the models, much higher than observed. Molecular oxygen is efficiently produced in the reaction of atomic oxygen with OH. There is an uncertainty in the rate of this reaction for O in the ground fine-structure level (), however, and the rate coefficient may be lower than that cited by UMIST (Sims et al. se06 (2006)). O2 is mainly destroyed in the reaction with H and by X-ray induced FUV photons. O2 has been searched with SWAS (e.g., Melnick mg04 (2004)) and ODIN (e.g., Pagani et al. po03 (2003)) but has not been reported in the literature to date. Derived upper limits on O2 column densities are usually of the order of a few cm-2 or a few . Standard chemical models normally overestimate this value by – orders of magnitude (see Melnick mg04 (2004), Pagani et al. po03 (2003) for a more detailed discussion). Our models are no exception. However, the ″ averaged column density in the Class I models are cm-2, which is well within the upper limits derived by SWAS and ODIN. Oxygen could be frozen out on grains in some form at lower temperatures and therefore not seen with the big beams of ODIN (′) and SWAS (′ ′). Herschel might shed some light on this matter with its relatively small beam widths (–″, depending on frequency).
H is a key molecule in the chemical reaction network of water and its abundance is greatly enhanced in the models including X-rays. Thus, observations of H in absorption at m (e.g., McCall et al. mg99 (1999)) would allow a direct test of the models. The integrated radial column densities of H are therefore presented for the Class I X-ray models in Table LABEL:th3+. The values given in parenthesis are H column densities calculated for the model with AU, i.e. the model with a protostellar hole.
| log() | log() | ||
|---|---|---|---|
| log(ergs s-1) | cm-2 | log(ergs s-1) | cm-2 |
| 0 | 8.0E11 (2.0E09) | 30 | 4.8E14 (4.2E11) |
| 27 | 1.3E12 (2.5E09) | 31 | 4.5E15 (3.9E12) |
| 28 | 5.9E12 (6.5E09) | 32 | 3.6E16 (2.9E13) |
| 29 | 5.0E13 (4.5E10) |
3.3 Class envelope model
Table LABEL:tiras lists the main parameters for a prototypical Class envelope model (Schöier et al. sj02 (2002)). The crucial differences from the modeling point of view between the Class and I envelope are the much higher bolometric luminosity, envelope mass and column density of the younger object, that lead to a different density and temperature distribution. The initial chemical abundances are again taken as given in Table 1. Freeze-out of CO is taken into account for temperatures K. The increased gas temperature due to X-rays has been calculated as described in Sect. 3.1. The X-ray luminosity is varied between – ergs s-1.
The results for H2O are shown in Fig. 13 for yrs and in Fig. 14 for yrs. At yrs, only high X-ray luminosities ( ergs s-1) lead to water abundances . An X-ray luminosity of ergs s-1 destroys water between – AU with higher abundances ( a few ) at AU and AU. Water is not significantly destroyed for X-ray luminosities ergs s-1. Similar conclusions hold for yrs although the region where is less than AU ( K). Compared to the Class I models (after appropriate scaling of the X-ray flux ), water is less destroyed by X-rays in the Class envelope. The reason for this are the high densities ( cm-3) in the innermost region of the Class source that absorb the X-ray flux.
| 27 L☉ | |
|---|---|
| Envelope parameters: | |
| Inner radius | 32 AU |
| Outer radius | 8 AU |
| Density at 1000 AU, | 6.7 cm-3 |
| Density power-law index, | 1.7 |
| Mass | 5.4 M☉ |
| Column density | cm-2 |


4 Discussion
As discussed in Sect. 2, X-rays reduce the water abundance preferably in regions where the gas temperature is – K (). At low densities ( cm-3), the fractional water abundance is less than for X-ray fluxes ergs s-1 cm-2 even for high gas temperatures (Fig. 4). For higher densities and temperatures – K, water has fractional abundances (nearly) independent of the X-ray flux. In the following, we discuss these findings in the context of protostellar envelopes and other models.
4.1 Envelope models
For high-mass YSOs, the observed water abundance can be successfully explained within the hot-core scenario in which the high temperatures in the inner envelope drive most of the oxygen into water and in which most of the water is frozen out onto grains in the outer region (e.g., Doty et al. dv02 (2002); Boonman et al. 2003b ). Recent interferometer studies of HO by van der Tak et al. (vw05 (2005)) towards the high-mass young stellar object (YSO) AFGL confirm the existence of a hot ( K) compact central region with high abundant water () and a region with lower abundances in the colder outer part. Although X-ray models predict the destruction of water also in high-mass objects (Stäuber et al. sd05 (2005)), these envelopes are likely to have regions with temperatures exceeding K (van der Tak et al. ve00 (2000)). In addition, the distance from the central source to the region in the envelope where the gas temperature is K, is much larger in high-mass sources compared to low-mass objects due to their high bolometric luminosities. The X-ray flux decreases rapidly with and may already be too low to destroy H2O. Water can therefore have fractional abundances of the order of in envelopes around high-mass YSOs despite their possible X-ray emission.
Similar jumps in the water abundances are also observed toward low-mass Class sources, although the derived abundances in the inner part are usually much lower compared to the massive objects. Ceccarelli et al. (cc00 (2000)) derived water abundances of for the inner part of the envelope of the Class source IRAS – and for the outer part from detailed models of ISO observations. Maret et al. (mc02 (2002)) found for the Class object NGC–IRAS and . Within the spherical envelope models in Sect. 3.3, such jumps with relatively low inner water abundances occur for high X-ray luminosities – ergs s-1 and yrs (Fig. 14). X-rays are therefore a possible explanation for the low water abundances found in these objects.
Class I envelopes may have no or only a small region where the temperature exceeds K. The inner part of the envelope may already have been dispersed by outflows or accreted onto the star/disk system. Water is therefore easily destroyed by X-rays. According to the models in Sect. 3.2.1, the average water abundance is predicted to be at most in Class I sources with X-ray luminosities ergs s-1. Note that the generic Class I model in Sect. 3.1 is considered as an extreme case where the gas temperature gets K close to the protostar. If the inner envelope has cavities of any kind, the gas temperature of the envelope will be lower at the inner edge of the envelope (), since this will be at a larger distance and since the dust temperature roughly falls with . Water will in that case be destroyed even more readily (Sect. 3.2.1, Fig. 10), unless there is some mechanism (e.g., photodesorption) that returns water ice to the gas phase.
4.2 Disks and Outflows
As discussed in Sect. 3, the inner envelopes of Class and I sources are likely to have a much more complex geometry than the spherical envelopes adopted here. If protostellar cavities or holes (Jørgensen et al. 2005b ) are common, the emission from H2O and other typical ”hot core” species may be dominated by the protostellar accretion disk or outflow hot spots rather than by the envelope. Disks are known to be present (e.g., Brown et al. bc00 (2000); Looney et al. lm00 (2000)) and can dominate over the hot core in terms of column density (Jørgensen et al. 2005c ). From the chemical point of view, the disk and hot core scenario are difficult to distinguish since both have high densities and temperatures in their inner region. According to the results in Sect. 2, the X-ray flux of a protostar with ergs s-1 and an absorbing column density of cm-2 at the outer part of a protostellar disk ( AU) is ergs s-1 cm-2. Water at temperatures below K is therefore destroyed from initial down to –. High column densities and/or temperatures are needed for the water to persist at in protostellar disks. For comparison, the chemistry disk models including X-rays by Aikawa & Herbst (ah01 (2001)) have H2O abundances below at AU from the central source. In the disk atmosphere models of Glassgold et al. (gn04 (2004)), water has fractional abundances at AU from the source for vertical column densities of less than a few cm-2.
Recent results presented by Chandler et al. (cb05 (2005)) for the inner ″ of IRAS – suggest outflow shocks to be the origin for the hot core species. Giannini et al. (gn01 (2001)) and Nisini et al. (ng02 (2002)) pointed out the importance of outflows for the water abundances in Class and I sources on larger scales. The results of Sect. 2 imply that the source of H2O emission with from outflow regions with gas temperatures K K has to be located at a certain distance from the X-ray source in order to survive. Consider, for example, yrs, typical outflow densities (– cm-3) and an X-ray absorbing column density cm-2. It can then be concluded from Figs. 1–4 (Sect. 2), that the H2O emitting source would have to be at AU for ergs s-1, at AU for ergs s-1, at AU for ergs s-1 and at AU for ergs s-1. Larger hydrogen densities and X-ray absorbing column densities, however, decrease these distances. The physical quantities of the observed outflows by Benedettini et al. (bv02 (2002)) range between K K and cm-3 cm-3. It is interesting to see, that the derived water abundances for K by Benedettini et al. are a factor of higher than those at K. This is in good agreement with the results in Sect. 2 where the X-ray models show a jump at these densities but where the models without X-rays show no jump at K. X-rays are therefore also predicted to influence the water abundances in outflow hot spots. It should be noted that FUV fields from the central star may also influence the water abundances if the photons can impact the H2O emission region relatively unhindered, e.g. through outflow cones. High FUV fields tend to destroy water even at high temperatures though (Sect. 3.2.2; Stäuber et al. sd04 (2004)).
5 Conclusion
The gas-phase water abundance is found to be critically dependent on time, gas temperature, hydrogen density and X-ray flux (Sect. 2). Three distinct regimes are identified: In the first regime ( K), the water abundance is – and can be somewhat enhanced or destroyed by X-rays in comparison to models without X-rays. In the second regime ( K K), water is released from grains with but quickly reduced by X-rays to fractional abundances . The third regime ( K) is characterized by high water abundances () due to the efficient reaction of OH with molecular hydrogen. At low densities ( cm-3) water is destroyed even at high temperatures for X-ray fluxes ergs s-1 cm-2. In general, higher gas temperatures and higher hydrogen densities allow higher X-ray fluxes for H2O to survive. Water is mainly destroyed in reactions with the X-ray enhanced species HCO+ and H. It is also destroyed by internally created FUV photons.
The envelopes of both Class I (Sect. 3.1) and Class (Sect. 3.3) objects were modeled under the influence of central X-ray and FUV emission. The results for the Class I envelope show that an initial warm gas-phase water abundance of is reduced to within yrs for X-ray luminosities ergs s-1 and within yrs for X-ray luminosities ergs s-1, consistent with reported upper limits for H2O towards Class I sources. Water is also destroyed by X-rays in the Class object, but higher X-ray fluxes are needed due to the higher densities in the inner region. The influence of a central FUV field is negligible in our models, unless the FUV photons can escape to larger distances (Sect. 3.2.2).
The current protostellar models are limited to spherical symmetry, which is obviously an approximation to the true geometry of the inner few hundred AU where cavities and flattened disks may be present. Nevertheless, the high densities and temperatures in the current models are representative of such regions. In particular, X-rays are predicted to regulate the H2O abundances wherever the gas temperature is – K. This will not only be the case for H2O originating from envelopes or disks in high-mass star-forming regions, but also for H2O produced in outflow hot spots around low-mass objects. The presence of cavities or outflow cones will have the result that X-rays and/or FUV photons penetrate to larger radii in certain directions.
Future instruments such as Herschel Space Observatory will allow detailed studies of the water abundances in both high and low-mass YSOs. With its high resolution instrument HIFI (de Graauw & Helmich dh01 (2001)), it will be possible to distinguish shock heated H2O from H2O in hot cores or disks from their line profiles. Observations of the optically thin isotope HO will help to sample the envelope, whereas optically thick lines may give information about outflow properties. PACS will delineate the water abundances on ″ scale including maps of the outflows. ALMA, on the other hand, will be able to resolve the innermost region (″) of YSO envelopes and/or disks in order to study the chemistry and therefore its physical properties in molecules other than H2O. Limited maps of HO on arcsec scale may be possible though with ALMA under exceptional conditions in the GHz line. High- lines of CO will reveal the gas temperature in these regions whereas the observation of X-ray and FUV tracers (Stäuber et al. sd04 (2004), sd05 (2005)) may help to clarify the high-energy properties of young stellar objects. Together, these new facilities and models will reveal much about the physical and chemical structure of the inner regions of young stellar objects, which are currently poorly understood.
Acknowledgements.
This work was partially supported under grants from The Research Corporation (SDD). The research of JKJ was supported by NASA Origins Grant NAG5-13050. Astrochemistry in Leiden is supported by the Netherlands Research School for Astronomy (NOVA) and by a Spinoza grant from the Netherlands Organization for Scientific Research (NWO).References
- (1) Aikawa, Y., & Herbst, E. 2001, A&A, 371, 1107
- (2) Bakes, E. L. O., & Tielens, A. G. G. M. 1994, ApJ, 427, 822
- (3) Benedettini, M., Viti, S., Giannini, T., Nisini, B., Goldsmith, P. F., & Saraceno, P. 2002, A&A, 395, 657
- (4) Boogert, A. C. A., Pontoppidan, K. M., Lahuis, F., et al. 2004, ApJS, 154, 359
- (5) Boonman, A. M. S., van Dishoeck, E. F., Lahuis, F., & Doty, S. D. 2003a, A&A, 399, 1063
- (6) Boonman, A. M. S., Doty, S. D., van Dishoeck, E. F., Bergin, E. A., Melnick, G. J., Wright, C. M., & Stark, R. 2003b, A&A, 406, 937
- (7) Boonman, A. M. S. & van Dishoeck, E. F. 2003, A&A, 403, 1003
- (8) Brown, D. W., Chandler, C. J., Carlstrom, J. E., Hills, R. E., Lay, O. P., Matthews, B. C., Richer, J. S., & Wilson, C. D. 2000, MNRAS, 319, 154
- (9) Casanova, S., Montmerle, T., Feigelson, E. D., & André, P. 1995, ApJ, 439, 752
- (10) Ceccarelli, C., Hollenbach, D. J., & Tielens, A. G. G. M. 1996, ApJ, 471, 400
- (11) Ceccarelli, C., Castets, A., Caux, E., Hollenbach, D., Loinard, L., Molinari, S., & Tielens, A. G. G. M. 2000, A&A, 355, 1129
- (12) Chandler, C. J., Brogan, C. L., Shirley, Y. L., & Loinard, L. 2005, ApJ, 632, 371
- (13) Charnley, S. B. 1997, ApJ, 481, 396
- (14) de Graauw, T. & Helmich, F. P. 2001, in Proc. ESA Symp., The Promise of the Herschel Space Observatory, ESA SP-460, 45
- (15) Doty, S. D., & Neufeld, D. A. 1997, ApJ, 489, 122
- (16) Doty, S. D., van Dishoeck, E. F., van der Tak, F. F. S., & Boonman, A. M. S. 2002, A&A, 389, 446
- (17) Doty, S. D., Schöier, F. L., & van Dishoeck, E. F. 2004, A&A, 418, 1021
- (18) Feigelson, E. D., & Montmerle, T. 1999, ARA&A, 37, 363
- (19) Forbrich, J., Preibisch, T., & Menten, K. 2005, Star Formation in the Era of Three Great Observatories
- (20) Giannini, T., Nisini, B., & Lorenzetti, D. 2001, ApJ, 555, 40
- (21) Glassgold, A. E., Najita, J., & Igea, J. 2004, ApJ, 615, 972
- (22) Gredel, R., Lepp, S., Dalgarno, A., & Herbst, E. 1989, ApJ, 347, 289
- (23) Hamaguchi, K., Corcoran, M. F., Petre, R., White, N. E., Stelzer, B., Nedachi, K., Kobayashi, N., & Tokunaga, A. T. 2005a, ApJ, 623, 291
- (24) Hamaguchi, K., Corcoran, M. F., Petre, R., White, N. E., Stelzer, B., Nedachi, K., Kobayashi, N., & Tokunaga, A. T. 2005b, Star Formation in the Era of Three Great Observatories
- (25) Hogerheijde, M. R., van Dishoeck, E. F., Blake, G. A., & van Langevelde, H. J. 1997, ApJ, 489, 293
- (26) Hollenbach, D. & McKee, C. F. 1989, ApJ, 342, 306
- (27) Imanishi, K., Koyama, K., & Tsuboi, Y. 2001, ApJ, 557, 747
- (28) Jensen, M. J., Bilodeau, R. C., Safvan, C. P., Seiersen, K., Andersen, L. H., Pedersen, H. B., & Heber, O. 2000, ApJ, 543, 764
- (29) Jørgensen, J. K., Schöier, F. L., & van Dishoeck, E. F. 2002, A&A, 389, 908
- (30) Jørgensen, J. K. 2004, A&A, 424, 589
- (31) Jørgensen, J. K., Schöier, F. L., & van Dishoeck, E. F. 2005a, A&A, 437, 501
- (32) Jørgensen, J. K., Lahuis, F., Schöier, F. L., et al. 2005b, ApJ, 631, L77
- (33) Jørgensen, J. K., Bourke, T. L., Myers, P. C., Schöier, F. L., van Dishoeck, E. F., & Wilner, D. J. 2005c, ApJ, 632, 973
- (34) Koyama, K., Hamaguchi, K., Ueno, S., Kobayashi, N., & Feigelson, E. D. 1996, PASJ, 48, L87
- (35) Lee, H.-H., Herbst, E., Pineau des Forets, G., Roueff, E., & Le Bourlot, J. 1996, A&A, 311, 690
- (36) Looney, L. W., Mundy, L. G., & Welch, W. J. 2000, ApJ, 529, 477
- (37) Maloney, P. R., Hollenbach, D. J., & Tielens, A. G. G. M. 1996, ApJ, 466, 561
- (38) Maret, S., Ceccarelli, C., Caux, E., Tielens, A. G. G. M., & Castets, A. 2002, A&A, 395, 573
- (39) Maret, S., Ceccarelli, C., Caux, E.,et al. 2004, A&A, 416, 577
- (40) McCall, B. J., Geballe, T. R., Hinkle, K. H., & Oka, T. 1999, ApJ, 522, 338
- (41) Meixner, M., & Tielens, A. G. G. M. 1993, ApJ, 405, 216
- (42) Melnick, G. J. 2004, Advances in Space Research, 34, 511
- (43) Millar, T. J., Farquhar, P. R. A., & Willacy, K. 1997, A&AS, 121, 139
- (44) Nisini, B., Giannini, T., & Lorenzetti, D. 2002, ApJ, 574, 246
- (45) Pagani, L., Olofsson, A. O. H., Bergman, P., et al. 2003, A&A, 402, L77
- (46) Preibisch, T., Kim, Y. C., Favata, F., et al. 2005, ApJS, 160, 401
- (47) Schöier, F. L., Jørgensen, J. K., van Dishoeck, E. F., & Blake, G. A. 2002, A&A, 390, 1001
- (48) Schöier, F. L., Jørgensen, J. K., van Dishoeck, E. F., & Blake, G. A. 2004, A&A, 418, 185
- (49) Sims, I. et al. 2006, in ”Astrochemistry across the Universe”, IAU Symposium 231, ed. D. C. List, E. Herbst, G. A. Blake, (Cambridge Univ. Press), in press
- (50) Spaans, M., Hogerheijde, M. R., Mundy, L. G., & van Dishoeck, E. F. 1995, ApJ, 455, L167
- (51) Spaans, M., & van Dishoeck, E. F. 2001, ApJ, 548, L217
- (52) Stäuber, P., Doty, S. D., van Dishoeck, E. F., Jørgensen, J. K., & Benz, A. O. 2004, A&A, 425, 577
- (53) Stäuber, P., Doty, S. D., van Dishoeck, E. F., & Benz, A. O. 2005, A&A, 440, 949
- (54) Tielens, A. G. G. M., Tokunaga, A. T., Geballe, T. R., & Baas, F. 1991, ApJ, 381, 181
- (55) van der Tak, F. F. S., & van Dishoeck, E. F. 2000, A&A, 358, L79
- (56) van der Tak, F. F. S., van Dishoeck, E. F., Evans, N. J., & Blake, G. A. 2000, ApJ, 537, 283
- (57) van der Tak, F., Walmsley, M., Herpin, F., & Ceccarelli, C. 2005, A&Ain press. see also: ArXiv Astrophysics e-prints, arXiv:astro-ph/0510640
- (58) van Dishoeck, E. F., & Blake, G. A. 1998, ARA&A, 36, 317