FUV and X-ray Observations of the Reverse Shock
in the SMC SNR 1E 0102.2–7219
Abstract
We present Far Ultraviolet Spectroscopic Explorer (FUSE) and X-ray Multi-mirror Mission (XMM-Newton) data for the reverse shock of the O-rich supernova remnant (SNR) 1E 0102.2–7219 in the Small Magellanic Cloud (SMC). The FUSE observations cover three regions with significantly different optical [O iii] intensities, all associated with the relatively bright part of the X-ray ring. Emission lines of O vi 1032, 1038 are clearly detected in the FUSE spectra. By combining this O vi doublet emission with the O vii triplet and O viii Ly fluxes from the XMM-Newton spectra and assuming a non-equilibrium ionization (NEI) model with a single ionization timescale for the spectra, we are able to find a narrow range of temperatures and ionization timescales that are consistent with the respective line ratios. The increase of the ionization timescale from North ( s cm-3) to South-East ( s cm-3) is indicative of increasing density in the X-ray bright ring, in good agreement with the optical [O iii] emission which is strongest in the South-East. However, if we assume a plane-parallel shock model with a distribution of ionization timescales, the O vi emission appears to be inconsistent with O vii and O viii in X-rays.
We also analyze the total XMM-Newton EPIC-MOS 1/2 spectra for the three regions. The X-ray spectra are dominated by strong emission lines of O, Ne, and Mg, however, we detect an emission component that accounts for 14 – 25% of the flux and can be attributed to shocked ISM. We find that there is no consistent set of values for the temperature and ionization timescale which can explain the observed line ratios for O, Ne, and Mg. This would be consistent with a structured distribution of the ejecta as the O, Ne, Mg would have interacted with the reverse shock at different times.
1 Introduction
The supernova remnant (SNR) 1E 0102.2–7219 (hereafter E0102) is the brightest X-ray SNR in the Small Magellanic Cloud (SMC) and was discovered with Einstein (Seward & Mitchell, 1981). In X-rays, it has a ring-like appearance and its emission is dominated by H-like and He-like ions of O and Ne (e.g., Gaetz et al., 2000; Hughes et al., 2000; Rasmussen et al., 2001; Sasaki et al., 2001; Flanagan et al., 2004). It consists of a bright X-ray ring and a much fainter plateau with a sharp outer edge that surrounds the ring (Fig. 1). This bright X-ray ring is caused by the reverse shock of the SNR, while the outer boundary of the faint plateau marks the location of the blast wave. The diameter of the bright ring is 28″, and the diameter of the outer rim is 44″. The radio emission in the 6 cm wavelength band (Amy & Ball, 1993) is located outside the bright X-ray emission but within the outer faint X-ray rim (Gaetz et al., 2000).
In the optical band, there is diffuse H emission surrounding the remnant, but a distinctive H ‘hole’ at the location of the SNR. A filamentary shell of optical [O iii] emission with a diameter of 30″ is seen (Dopita et al., 1981), which is presumably emission from the ejecta. Further outwards, the remnant is surrounded by a faint, diffuse, partial shell of [O iii] with a diameter of 60″ that is thought to be the result of photoionization by the precursor. Emission lines of O, Ne, C, and Mg have been detected in the UV and optical spectra (Dopita et al., 1981; Morse et al., 1998; Blair et al., 2000), but H, He, and Fe are notably absent. Tuohy & Dopita (1983) estimated an age of 1000 yrs for the remnant based on the optical diameter and the line of sight velocity range. Based on abundance estimates from optical and UV data, Blair et al. (2000) suggested that the progenitor was possibly a massive O star that, after becoming a Wolf-Rayet star, exploded as a Type Ib supernova. More recently, Chevalier (2005) argued that E0102 is the remnant of a Type IIL/b supernova with a progenitor that lost most of the H envelope before the explosion.
We present new observations with the Far Ultraviolet Spectroscopic Explorer (FUSE) to study the O vi emission in regions in the X-ray bright ring with differing distributions of [O iii] and X-rays. In addition, we analyze X-ray observations with XMM-Newton and Chandra and compare the O emission in the Far-UV (FUV) to the X-ray emission.
2 Observations and Reductions
2.1 FUSE Data
The FUSE satellite was launched in June 1999; details of its operation and on-orbit performance are provided in the papers by Moos et al. (2000) and Sahnow et al. (2000). The FUSE instruments cover the 905 – 1187 Å band with a nominal point source spectral resolution of . The FUSE telescope has four optical channels, each with its own mirror and grating. Two mirrors and gratings are coated with silicon carbide (SiC channels), and the other two mirrors and gratings are coated with Al and a lithium fluoride overcoat (LiF channels). One SiC/LiF channel pair is sensed by one microchannel plate intensified detector, and the other channel pair is sensed by a second detector. The SiC channels provide wavelength coverage from 905 Å to 1100 Å, whereas the LiF channels cover the wavelength range of 1000 Å to 1187 Å. Each of the two detectors is divided into two segments (1A and 1B, 2A and 2B), so that 8 spectra are obtained for each pointing (LiF1A/B, SiC1A/B, LiF2A/B, SiC2A/B).
At the focal plane of each channel is an assembly holding three spectrograph apertures, dubbed LWRS, MDRS, and HIRS. In time-tag data mode, spectra through all three apertures are recorded simultaneously, but only one aperture is designated as primary. The primary science apertures for our program are the 4″ 20″ MDRS apertures.
After launch, small thermally-induced distortions were discovered that cause misalignments of these apertures. While periodic alignment activities are performed to keep the channels approximately aligned, motions of 3 – 8″ occur on an orbital timescale (100 minutes), preventing detailed co-alignment during a given integration. The LiF1 channel was used for guiding in the data presented here, so that the location of the source is fixed for this channel. Due to the drift, not all the counts from the source fall on the detector. As this is not taken into account when the flux of the calibrated spectrum is computed, the flux of the SiC and LiF2 channels become lower than the real flux which is measured in the LiF1 channel. The spectra of the SiC and LiF2 channels can be corrected by scaling the continuum flux to the correct continuum flux as determined in the LiF1 spectrum.
We observed three positions around the bright X-ray ring of E0102. The positions were selected to have differing distributions of [O iii] in the optical and O vii, O viii in the X-ray (Table 1). The observations were scheduled at times where the aperture position angles could be tailored to the positions being observed. Figure 1 shows the projected positions on a Chandra image and on an HST WFPC2 [O iii] image. The net FUSE integration times are 12.4 ksec for the north pointing (N), 15.6 ksec for the northeast pointing (NE), and 8.2 + 5.2 ksec for the southeast pointing (SE, two visits). We also performed a dedicated off-source position with MDRS for estimating the background. However, the spectra from the background pointing show more significant contamination by background starlight than the on-source positions. Therefore, the background observation has not been subtracted from the source spectra.
The data have been processed by the CalFUSE 3.0 pipeline, and the resulting spectra are shown in Figure 2. The only emission lines detected from the SNR are the broadened O vi doublet lines. We have modeled these spectra using functions available in IDL and routines from an IDL library including the fitting function MPFIT111http://astrog.physics.wisc.edu/craigm/idl/idl.html that performs least-squares curve fitting. Line fluxes and derived surface brightnesses in O vi are provided in Table 2 (see Sect. 3.1 for more details).
2.2 X-ray Data
There are numerous public archival X-ray data sets for E0102 obtained with Chandra (Weisskopf et al., 1996) and XMM-Newton (Jansen et al., 2001). We first considered using the Advanced CCD Imaging Spectrometer (ACIS) data from the Chandra archive. Chandra data have far superior spatial resolution in comparison with XMM-Newton. However, we have determined that the brightest portions of E0102 as observed with the ACIS-S array in full frame mode are affected by pile-up, while the ACIS-S sub-array data and ACIS-I array data with the remnant on-axis have poor photon statistics. Pile-up causes two or more photons to be detected as a single event. As the observed energy is the sum of the energies of two or more photons, the energy spectrum is thus distorted. Compared to Chandra observations, XMM-Newton observations are less affected by pile-up due to shorter frame-times and lower spatial resolution (thus smearing emission from bright sources over a larger region of the detector). XMM-Newton is equipped with three European Photon Imaging Cameras (EPIC); one is a pn-type CCD (EPIC-PN) and two are MOS-type CCDs (EPIC-MOS1/2). Both the ACIS and the EPICs are sensitive in the energy band of 0.3 – 10.0 keV. For SNRs, we are in general interested in soft X-rays ( keV). Because the sensitivity of XMM-Newton in the energy range of 0.5 – 2.0 keV is higher and the spectral resolution of EPIC-MOS detectors is better than that of ACIS, we decided to use XMM-Newton data primarily, except for the examination of the faint outer rim. The outer rim is much fainter than the bright ring and has much less pile-up. Chandra’s spatial resolution helps to isolate the rim emission from the bright ring emission.
We selected archival data of three XMM-Newton observations which were taken early in the mission (April 2000 and April 2001): ObsIDs 0123110201, 0123110301, and 0135720601. Because we want to study the emission lines, we use EPIC-MOS1 and MOS2 data which have better spectral resolution than EPIC-PN. The net exposure times after removing times with soft proton flares are 16 ks, 13 ks, and 20 ks for the observations 0123110201, 0123110301, 0135720601, respectively. The data were obtained in small window mode resulting in a short frame time (0.3 s; for comparison, frame time of the Chandra ACIS full frame mode is 3.2 s) and negligible pile-up. The data are processed with XMMSAS 6.1.0. We extracted spectra of the reverse shock at the positions of the FUSE apertures (Fig. 3). The brightest lines in the X-ray spectra at these positions are the O vii triplet lines and the O viii Ly line.
3 Analysis
3.1 O vi Doublet
Although the diffuse O vi emission lines are broad and faint, these line features are well detected in the FUSE LiF1A and LiF2B spectra. The SiC1A and SiC2B spectra also cover the spectral range around the O vi lines, however, the statistics of those data are poor due to the lower effective areas. Also, the SiC channels are more affected by the misalignment of the channels than the LiF2B channel and the emission from the brighter parts of the remnant may have largely moved out of the aperture. We see significant O vi emission in both LiF1A and LiF2B data. The rescaling of the LiF2B spectra by effective area and continuum flux shows that the LiF2B seems to have mainly covered the same O vi emission as the guiding LiF1A channel. Therefore, we combine the LiF1A and LiF2B spectra for each pointing and analyze the co-added spectra around the O vi lines (1020 to 1050Å). The strongest emission lines in the spectra of the E0102 pointings are terrestrial airglow lines. In the wavelength band around the O vi doublet 1032, 1038 (1031.926Å, 1037.617Å, respectively), there is a strong H i airglow line at 1025.7Å, while the O vi emission is relatively faint, in part because of the broadening of the lines. We use this H i airglow line to calibrate the wavelength and to confirm that the spectral resolution is consistent with the aperture size. The O vi doublet fluxes are derived by modeling the emission features between 1030Å and 1040Å.
Interstellar absorption is significant in the Far-UV and needs be taken into account when determining the line fluxes. We include absorption lines of and C ii and correct the flux for reddening through extinction. The absorption has been derived using H2ools developed by McCandliss (2003). For the column density of we use the Milky Way (MW) and SMC values from Tumlinson et al. (2002), i.e., median values from 13 stars in the northern part of the SMC. There is an evident absorption feature at 1036Å which is a C ii 1036.3367, 1037.0182 doublet. We model this feature as a line at 1036 Å with free width. We also model absorption by O vi along the line of sight, including both the MW and the SMC components.
We combine night and day data (instead of using only night data to reduce the airglow emission) because of the poor photon statistics. Nevertheless, the sensitivity of FUSE allows the broad O vi emission lines from this faint diffuse source to be well detected (see Fig. 2). The spectra are binned with 0.3 Å bins (corresponding to 87 km s-1). Using the fitting routine MPFIT, we fit the O vi 1032, 1038 lines with two broad Gaussians, and the continuum is modeled as a constant. The widths of O vi 1032, 1038 Gaussian lines are tied together, and the relative positions of the lines are fixed to the wavelength separation: i.e. we fit the O vi 1032 line (free wavelength) and tie the O vi 1038 line to the O vi 1032 wavelength + 5.691Å. We also considered fitting each line with many zero-width Gaussians which fill the observed width of the broad lines, to see if we can find different velocity components in the lines. The zero-width Gaussians form pairs with fixed separation between the O vi 1032 and the O vi 1038 components. However, the fits did not improve significantly. The normalization of each line is a free parameter except for the N pointing data, which have much poorer statistics. In the case of the N data, the normalization of the 1038 line is fixed at half of the 1032 line normalization (corresponding to the optically thin limit). From the line energy and width, we derive a velocity shift and FWHM. The flux is corrected for extinction, using the Galactic extinction curve of Fitzpatrick & Massa (1990) and Fitzpatrick (1999) as well as extinction curves of the Magellanic Clouds from Gordon et al. (2003). To obtain the de-reddened flux, we use = 0.08, assuming that the extinction is caused half by the SMC and half by the MW, as suggested by Blair et al. (1989, 2000). We compute the 90% confidence errors for the line energy, width, and flux. The FWHM, shifts, and fluxes are listed in Table 2. Figure 2 shows the spectra around 1036 with the fits overplotted and fit residuals.
The O vi emission is faintest in the N pointing and brightest in the SE pointing. In both the NE and SE pointings, the fits show that the gas has a velocity dispersion of about 900 km s-1, while the faint O vi line feature in the N pointing spectrum has a FWHM of km s-1. This is most likely not thermal line broadening, but instead indicates a velocity structure in the remnant (see Sect. 4.1). The rest SMC velocity is 165 km s-1 (Danforth et al., 2002), so the broad O vi emission lines are blue-shifted by 100 km s-1 in the NE pointing and by 330 km s-1 in the SE pointing. However, in the N pointing, the broad O vi emission line feature is red-shifted by 220 km s-1. This might indicate a non-symmetric expansion of the remnant.
3.2 X-ray Emission Lines
To combine the X-ray data with the FUV data, we perform an X-ray emission line analysis using the H-like and He-like lines of O, Ne, and Mg. The X-ray spectra have been binned with a minimum of 20 counts per bin to allow the use of statistics. We fit the EPIC-MOS1/2 spectra using the X-ray spectral fitting package XSPEC. The model consists of Gaussian lines at the known line energies of O, Ne, Mg, and Si (i.e. O vii triplet at 0.57 keV, O viii Ly at 0.654 keV, Ne ix triplet at 0.91 keV, Ne x Ly at 1.022 keV, Mg xi triplet at 1.34 keV, Mg xii Ly at 1.473 keV, Si xiii triplet at 1.84 keV, Si xiv Ly at 2.006 keV), a continuum-only model using the Astrophysical Plasma Emission Code (APEC, Smith et al., 2001), and line-of-sight absorption. The foreground absorption model consists of a component for the foreground MW absorption with a fixed of cm-2 (Dickey & Lockman, 1990) and a component with SMC abundances (Russell & Dopita, 1992) to be fit. All the Ly lines are well fit with zero-width Gaussians. The CCD resolution does not allow the components of the triplet lines (O vii, Ne ix, and Mg xi) to be resolved, but at least two zero-width Gaussians are necessary to reproduce the line features. Therefore, we fit the triplet emission with two Gaussians at the energies of the forbidden and the resonance lines which are the two stronger lines and span the energy range of the triplet. The forbidden and the resonance lines are fit separately, i.e., their flux ratio is free in the fits, and the flux of the intercombination line is included in the fluxes of the fitted lines. We use the sum of the fluxes as the flux of the triplet.
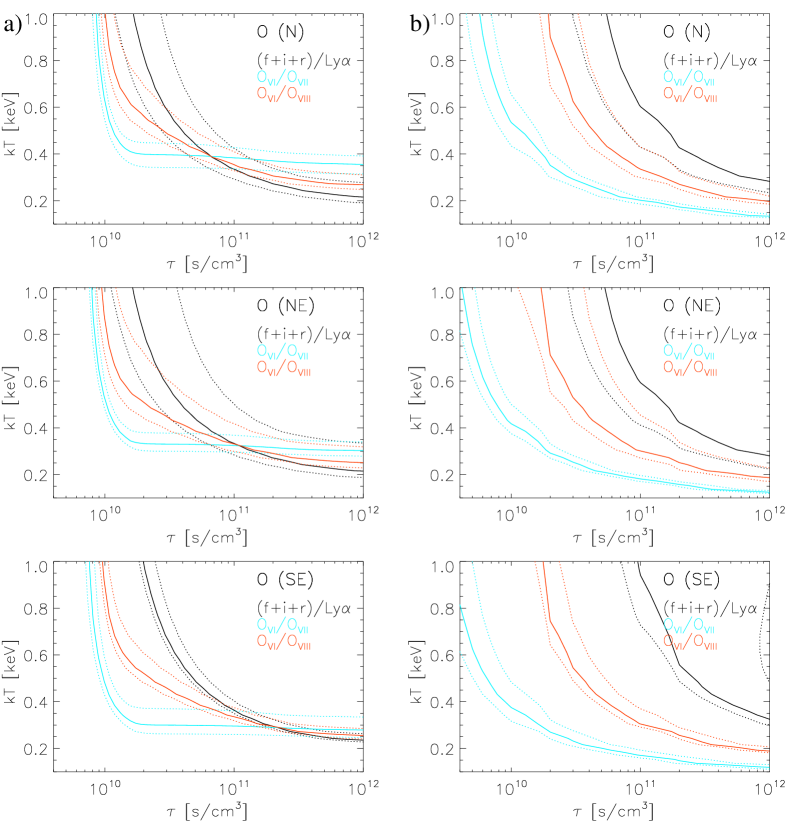
Oxygen lines are the strongest lines in both the FUSE and the XMM-Newton spectra of E0102. We compare line fluxes obtained from FUSE (O vi doublet) and EPIC-MOS (O vii triplet and O viii Ly) to line fluxes predicted by models. The observed line ratios are listed in Table 3. For the comparison with the observed lines, we use line fluxes computed with neiline222http://cxc.harvard.edu/cont-soft/software/NEIline.1.00.html, which evaluates line emissivities for an ionizing or recombining plasma. Line fluxes are calculated by evolving the plasma at a given initial temperature for a given ionization timescale. As this calculation assumes a single ionization timescale for the plasma, we also model line fluxes using a plane-parallel shock model with a single temperature and a distribution of ionization timescales appropriate for a plane-parallel shock (VPSHOCK model in XSPEC; see Borkowski et al., 2001). We assume SMC abundances for all elements except for O, Ne, and Mg for both models. For the elements O, Ne, and Mg with enhanced abundances we use the numbers obtained from the global fits of the X-ray spectrum (see Sect. 3.3).
The diagrams in Figure 4 show the line ratios O vii triplet/O viii Ly, O vi doublet/O vii triplet, and O vi doublet/O viii Ly derived from FUSE and XMM-Newton spectra and the error estimates based on the 90% confidence intervals for the line fluxes as a function of the ionization timescale and temperature for the two models. In the VPSHOCK model, the parameter is the upper limit of the ionization timescale that has a distribution characteristic for a plasma shocked by a steady plane-parallel shock. For the three line ratios for O, we evaluate confidence regions for the ratios as a function of and . The lines in black show the ratio between O vii and O viii observed in X-rays (O vii triplet/O viii Ly). The cyan and orange lines compare O vi in Far-UV with O vii and O viii ( O vi doublet/O vii triplet and O vi doublet/O viii Ly). The results show that in the case of the neiline model, the confidence regions for the ratios O vii triplet/O viii Ly, O vi doublet/O vii triplet, and O vi doublet/O viii Ly intersect, yielding a well-defined vs. region for each aperture: for N, keV and s cm-3, for NE, keV and s cm-3, and for SE, keV and s cm-3. While the - regions for NE and SE overlap, the result for N indicates higher and lower . However, the diagrams for the plane-parallel shock model show no overlap between the confidence regions of the line ratios.
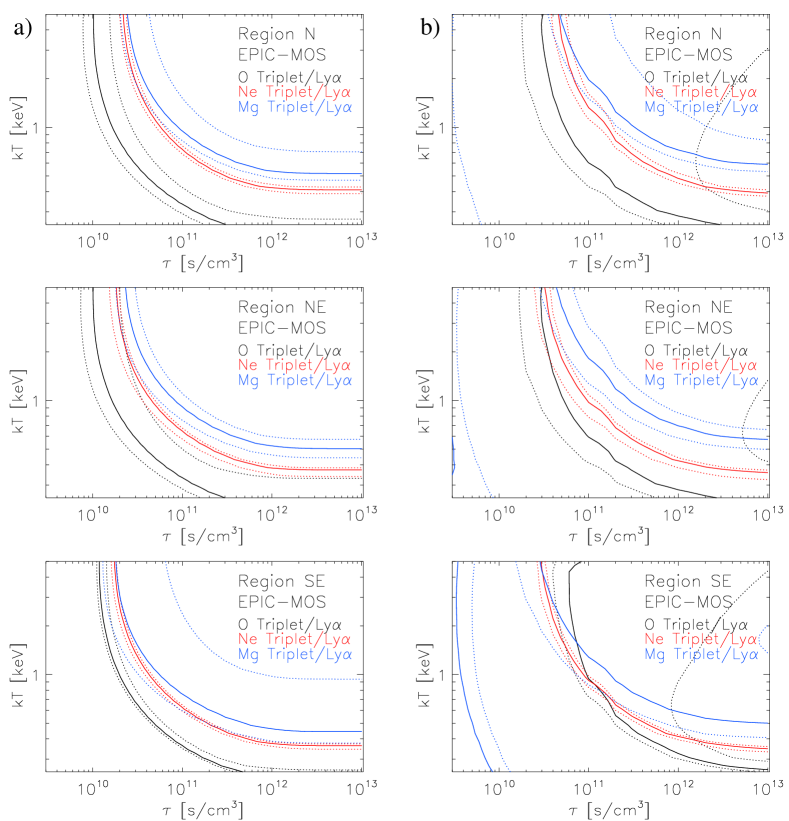
We also computed and compared the line ratios of O vii triplet/O viii Ly, Ne ix triplet/Ne x Ly, and Mg xi triplet/Mg xii Ly to check whether different elements might indicate different plasma conditions. The results are shown in Figure 5. As the diagrams show, for neiline, the confidence regions for O, Ne, and Mg have little overlap and there are no conditions where all three intersect. There seems to be no single set of temperatures and ionization timescales that simultaneously describes the O, Ne, and Mg ratios. This is consistent with previous results. In analyzing ASCA data for E0102, Hayashi et al. (1994) have found it necessary to introduce separate plasma components for each element. Analysis of Chandra High Energy Transmission Grating Spectrometer (HETGS) data has shown that the dispersed line emission images have different radii for lines of different elements, suggesting progressive ionization by the reverse shock propagating through the ejecta (Flanagan et al., 2004). Another explanation for the lack of overlap between the ions is that the X-ray emission arises from a distribution of shocks with different velocities as suggested for SNR 1987A by Zhekov et al. (2005). In the case of a plane-parallel shock model (VPSHOCK) the three confidence regions overlap for keV and s cm-3. However, when the O vi line results from FUSE are included, there is no region of common temperatures and ionization timescales which satisfies the O line ratios. This might be indicating that the bulk of the O vi emission arises from a different location with different plasma conditions than the location from which the bulk of the O vii and O viii emission arises.
3.3 Global Fitting of the X-ray Spectrum
To analyze the global X-ray spectra of the three regions, we first fit the spectra in XSPEC using the VNEI model with NEI version 2.0 for a plasma in non-equilibrium ionization (NEI) with variable abundances. This model assumes a single ionization timescale for the emitting plasma and is a simplification compared to the plane-parallel shock model (see Borkowski et al., 2001). The NEI version 2.0 models use a newer atomic database (Astrophysical Plasma Emission Database, APED, Smith et al., 2001b) than the versions 1.0 and 1.1 and reproduces more accurate line emissivities. However, they do not contain inner-shell processes. For the absorption we include two components: one component represents the foreground MW absorption with a fixed of cm-2 and the other represents the SMC absorption. For each region, the EPIC-MOS1 and MOS2 spectra for the three observations are fit simultaneously with a single model.
Although we fit the spectra with various sets of initial parameters, models with a single VNEI component fail to fit the spectra adequately. In all cases, the model predicts a lower flux than the observed spectrum next to the Mg xi triplet line feature, exactly where the Mg xii Ly line would be expected. Because the fits for the X-ray bright ring are dominated by the strong O vii, O viii, Ne ix, and Ne x lines, we conclude that the elements O, Ne, and Mg might not be ionized to the same extent, with Mg being more highly excited than the other elements.
We therefore try a model with additional VNEI components to represent different plasma components. First, we include a component for the ISM shocked by the blast wave: To estimate this component, we use Chandra ACIS-S3 data (ObsIDs 5123 (catalog ADS/Sa.CXO#obs/05123) and 5130 (catalog ADS/Sa.CXO#obs/05130)) and extract a spectrum in the X-ray plateau covering the outer blast wave, i.e. a ring centered on RA = 01h 04m 02.0s , Dec = –72° 01′ 53.2″ with inner radius of 19″ and outer radius of 23″ . This emission is very faint and not affected by pile-up. In the XMM-Newton EPIC-MOS1/2 data it is not possible to separate clearly the emission from the blast wave and the ejecta because of the poor spatial resolution of XMM-Newton. Fitting the blast wave spectrum extracted from Chandra data with one VNEI component (absorption component as above), we obtain: keV, s cm-3. Therefore, we fit the XMM-Newton spectra of parts of the bright X-ray ring with a model including a VNEI component for the ISM with and fixed, and all the abundances set to the SMC ISM abundances (Russell & Dopita, 1992). For the ejecta emission, we include two VNEI components: a component for the emission dominated by O, fixing the parameters for and to the results from the line diagnostics (see Fig. 4) with all other element abundances set to zero, and a component accounting for the rest of the ejecta emission, consisting of Ne and Mg (with abundances for the other elements set to zero), with free and . The same set of absorbing columns (Galactic and SMC as described above) is used for both components. The fits are better than with a single VNEI model, and the fit parameters are listed in Table 4. The spectra of the ObsID 0123110201 data and the best fit model, obtained by a simultaneous fit of all spectra of the three ObsIDs, are shown in Figure 3.
4 Discussion
4.1 Results from the Spectral Analysis
If the line broadening in the FUSE spectra were due to thermal motion, the FWHM of about 900 km s-1 would correspond to an unreasonably high temperature of 3 K. The analysis of the EPIC-MOS data shows that the plasma temperature is about 107 K. There are at least three scenarios that can explain this discrepancy. First, it is possible that the collisionless heating of the electrons behind the reverse shock front is negligible. Hughes et al. (2000) argue that this is the case at the outer blast wave and that significant particle acceleration is required there. In such a case, the oxygen ions, and thus also O vi, have a much high temperature than the electrons which are responsible for the X-ray emission. Second, the electron temperature might have been underestimated by applying a single ionization timescale model (VNEI). Third, the broadening might be caused by turbulence or by bulk motions rather than by thermal motions. Flanagan et al. (2004) derive expansion velocities of about 1000 km s-1 from Chandra HETGS data for the bright X-ray ring. The velocities measured from the HETGS data could be explained by geometric effects, if E0102 has, e.g., a tilted, expanding ring geometry or a distorted shell with density variations. Flanagan et al. (2004) suggest that the difference in velocity shifts in different parts of the remnant might indicate that the southeastern part of the remnant shell is approaching and the northwestern part is receding. This is consistent with the velocity shifts obtained for the broad O vi emission lines which show blue-shifts in the NE and SE pointings, whereas the lines in the N pointing indicate a red-shift (Sect. 3.1).
The X-ray emission of the bright X-ray ring is mainly ejecta emission. Because the spectra in all three regions are not well fit by a single component NEI model, we have fit the spectra with two NEI model components with variable abundances of O (first component) and Ne and Mg (second component) for the emission from the ejecta shocked by the reverse shock, and an additional NEI model to account for the emission from the ISM shocked by the blast wave. We calculate the unabsorbed flux (0.3 – 10.0 keV) of the ejecta and shocked ISM for each region and compare the flux fraction: The ratio between the surface brightness of the total ejecta emission and the ISM emission, , is 6, 3, and 3 for regions N, NE, and SE, respectively. The surface brightness of the ISM component is erg cm-2 s-1 arcsec-2 in all three regions. For comparison, the surface brightness of the emission of the shocked ISM in the outer rim is erg cm-2 s-1 arcsec-2, in good agreement with the estimated ISM component for the emission of the X-ray bright ring at the positions of the FUSE pointings. The differences between the total flux of the three regions in the X-ray bright ring seem to be caused by differences in the emission from the ejecta shocked by the reverse shock as well as by variations in absorption as obtained from the spectral fits.
The line ratio diagrams in Figure 4a show that the O vi seen in FUV and the O vii and O vii X-ray emission are compatible with the assumption of an ionizing plasma with a single ionization timescale , as calculated by neiline. In this case, the line diagnostics of the O emission obtained with FUSE and XMM-Newton show that the ionization timescale of the O gas differs in the three regions, increasing from N to SE: s cm-3 in the N region, s cm-3 in the NE region, and s cm-3 in the SE region. The temperatures in the three regions are comparable: = 0.3 – 0.5 keV. This result may indicate that the density in the ejecta is higher in the southeastern part of the X-ray bright ring, consistent with the optical data which show that the [O iii] emission is strongest in the SE. If we instead assume a plane-parallel shock with a distribution of ionization timescales using the VPSHOCK model, we do not obtain a consistent set of and the upper limit of for the O vi, O vii, and O viii lines. However, the diagrams in Figure 5b indicate that the flux ratios of emission lines of O, Ne, and Mg in X-ray, and thus also O vii and O viii, are consistent with a common temperature and ionization timescale assuming the plane-parallel shock model. As the diagrams in Figure 4b compare O vi in FUV with the oxygen emission in X-ray, the fact that O vi, O vii, and O viii show no overlap might suggest that the oxygen line emission in the FUV and the oxygen line emission in X-rays together are not consistent with the assumed model. As copious [O iii] emission is observed in the optical, there must also be denser shocked material and the O vi emission might be related to it as well. Therefore, multiple shocked plasmas or a range of velocities are possibly involved in the FUV and X-ray emission of E0102.
These results show that we find a few possible scenarios for the emission from this SNR. However, as we are limited by the size of the aperture of FUSE and the spatial resolution of XMM-Newton we are not able to constrain whether the emission arises from a single shock or multiple shocks. Moreover, the shock can be ionizing or recombining and thus radiative. Although we have optical [O iii] images and X-ray images with O vii and O viii emission of high spatial resolution, we lack spatial information on O vi. If it were possible to obtain O vi imaging data we would be able to compare the distribution of O in the remant and thus to determine if the shock is ionizing or recombining. Furthermore, hydrodynamical models for reverse shocks are necessary to understand the distribution of elements as well as physical parameters like or in relatively young SNRs like E0102.
4.2 Mass Estimates
To derive the ejecta mass, we numerically estimate the volume of the SNR included in the slit, assuming that the SNR emission is from a thick shell. The outer radius of the shell is assumed to coincide with the outer edge of the bright X-ray ring: = 16010 = 4.70.3 pc (for kpc, van den Bergh, 1999); the inner radius of the bright X-ray ring is taken to be = 12010 = 3.50.3 pc. The resulting volume, , of the observed emitting gas is the intersection between this thick shell and a projected rectangle with the slit size ( 4″20″ = 6.77 pc cm2). The results are listed in Table 5. We assume an error of 20% for the estimated volumes, as there are systematic uncertainties including the actual shape of the shell.
The Chandra HETGS spectra show that the plasma mainly consists of O, Ne, and Mg (Flanagan et al., 2004). The EPIC-MOS fits also show that the ejecta emission results from O, Ne, and Mg. Therefore, we assume a metal-rich plasma consisting of O, Ne, and Mg excited to H-like, He-like, or fully ionized states.
The XSPEC VNEI emissivity normalization (Table 4) is , where is the distance to the source [cm], is the hydrogen number density [cm-3], and is the electron number density [cm-3]. In the case of a plasma with high overabundance of elements other than hydrogen, needs to be replaced by a reference density, , that is a sum over the number densities of the included elements, thereby taking the abundances into account. The electron density is , where is the density of element i. The factor depends on the assumed mean charge state for each element; we assume , for O, Ne, and Mg, respectively. Assuming kpc cm and uniform density in the thick shell, we estimate , , and for the two components for each region (see Table 5). Using these number densities, we obtain the O, Ne, and Mg mass for the entire remnant. We include a filling factor to account for the unknown volume fraction of the X-ray emitting plasma. The densities are proportional to . Assuming a thick shell with an outer radius of = 4.70.6 pc and an inner radius of = 3.50.6 pc, we obtain , , . If we assume a thick ring with cm-3 as estimated by Flanagan et al. (2004), we derive: , , . We estimate a few in O, indicating a massive progenitor.
If we assume a volume fraction of unity, the oxygen mass is consistent with the result from Chandra HETGS by Flanagan et al. (2004) who also assumed . By comparing their estimate with the models of Nomoto et al. (1997), Flanagan et al. (2004) suggest that the mass of the progenitor of E0102 was 32 . Blair et al. (2000) compare abundance ratios based on optical and UV lines to values derived by Nomoto et al. (1997) and conclude that the E0102 progenitor is best described by a 25 model. Our mass estimates for O and Mg as well as the mass ratios agree well with the 25 – 30 model (Nomoto et al., 1997), while the Ne mass estimate is slightly higher than the model prediction. Even for a filling factor as low as , the mass estimates are consistent with a massive progenitor (Nomoto et al., 1997).
In these calculations, there are still some uncertainties that we have to be aware of. As the reverse shock has not yet reached the center of the remnant, there is still unshocked material interior to the reverse shock. If the unshocked material has the same abundance distribution as the shocked material (i.e., well-mixed ejecta) the ratios will not be much altered, but the estimated masses would be lower limits. Furthermore, the ionization potential increases with the atomic number; the shock might be strong enough to ionize O all the way up to the He-like and H-like stages, but not as efficient in ionizing Mg. Therefore, a part of Mg could be in lower ionization stages and not emitting in X-rays. Finally, assuming a too high volume filling factor can result in overestimating the total masses. Numerical calculations have shown that the ejecta shocked by the reverse shock form thin layers that can be deformed by Rayleigh-Taylor instabilities, decreasing the fraction of the observed ejecta in the apertures (Chevalier et al., 1992; Blondin & Ellison, 2001).
5 Summary
We have observed three regions in the bright X-ray ring of the O-rich SNR 1E 0102.2–7219 in the SMC using the FUSE MDRS (4″20″) aperture. These three regions cover parts of the remnant ring with varying distributions of [O iii] in the optical, and O vii and O viii in the X-ray. The ring is caused by the reverse shock propagating into the ejecta. In the northern region (N), the FUSE spectrum shows very faint but velocity broadened O vi emission. In the northeastern (NE) and the southeastern (SE) parts of the SNR ring, there is significant O vi emission with broad O vi 1032, 1038 lines, indicating a velocity dispersion of about 900 km s-1. The emission from the SE pointing appears to be blue-shifted by 200 km s-1 relative to the emission from the NE pointing.
We have also analyzed the XMM-Newton EPIC-MOS1/2 spectra of E0102 in the same regions as in the FUSE observations. For the combined analysis of the FUV and X-ray data, we consider two cases: 1. shocked plasma described by a single temperature and single ionization timescale (using the models neiline and VNEI) and 2. plane-parallel shock with a distribution of ionization timescales (using the VPSHOCK model). In the first case, combining O vi doublet emission from FUSE data with O vii triplet and O viii Ly in EPIC-MOS1/2 spectra yields keV and s cm-3 for the N region, keV and s cm-3 for the NE region, and keV and s cm-3 for the SE region. The ionization timescales of the O gas seem to increase towards the south (), suggesting a higher density in the south. The total EPIC-MOS1/2 spectra are well fit with a three component non-equilibrium ionization model; two VNEI components are necessary to describe the ejecta emission (one for the O plasma, one for Ne + Mg plasma) and an additional VNEI component is used to model the emission from the shocked ISM. The temperature of the Ne + Mg component is higher ( keV) than the O component. For the plane-parallel shock model, however, the observed ratios of O vi/O vii and O vi/O viii are not consistent with the O vii/O viii ratio, in that there is not a common region of allowed temperatures and ionization timescales. When the triplet and Ly ratios are considered for O, Ne, and Mg in the X-ray bandpass alone, the observed ratios do have significant overlap in temperature ( 1.0 keV) and ionization timescale ( s cm-3). These results might indicate that the FUSE and XMM-Newton data are sampling multiple shocks with different conditions. To better understand these results in the future, we still require information on the spatial distribution of O vi in FUV as well as hydrodynamic models describing the structure of the reverse shock.
From the X-ray emission, we estimate the mass of O, Ne, and Mg in the entire remnant. Making the assumption that the remnant is a thick shell, we obtain , , . A comparison with previous measurements and progenitor models shows that our results are consistent with a massive progenitor.
References
- Amy & Ball (1993) Amy, S. W. & Ball, L. 1993, ApJ, 411, 761
- Anders & Grevesse (1989) Anders, E. & Grevesse, N. 1989, Geochim. Cosmochim. Acta, 53, 197
- Blair et al. (2000) Blair, W. P., et al. 2000, ApJ, 537, 667
- Blair et al. (1989) Blair, W. P., Raymond, J. C., Danziger, J., & Matteucci, F. 1989, ApJ, 338, 812
- Blondin & Ellison (2001) Blondin, J. M. & Ellison, D. C. 2001, ApJ, 560, 244
- Borkowski et al. (2001) Borkowski, K. J., Lyerly, W. J., & Reynolds, S. P. 2001, ApJ, 548, 820
- Chevalier (2005) Chevalier, R. A. 2005, ApJ, 619, 839
- Chevalier et al. (1992) Chevalier, R. A., Blondin, J. M., & Emmering, R. T. 1992, ApJ, 392, 118
- Danforth et al. (2002) Danforth, C. W., Howk, J. C., Fullerton, A. W., Blair, W. P., & Sembach, K. R. 2002, ApJS, 139, 81
- Dickey & Lockman (1990) Dickey, J. M. & Lockman, F. J. 1990, ARA&A, 28, 215
- Dopita et al. (1981) Dopita, M. A., Tuohy, I. R., & Mathewson, D. S. 1981, ApJ, 248, L105
- Fitzpatrick (1999) Fitzpatrick, E. L. 1999, PASP, 111, 63
- Fitzpatrick & Massa (1990) Fitzpatrick, E. L. & Massa, D. 1990, ApJS, 72, 163
- Flanagan et al. (2004) Flanagan, K. A., Canizares, C. R., Dewey, D., Houck, J. C., Fredericks, A. C., Schattenburg, M. L., Markert, T. H., & Davis, D. S. 2004, ApJ, 605, 230
- Gaetz et al. (2000) Gaetz, T. J., Butt, Y. M., Edgar, R. J., Eriksen, K. A., Plucinsky, P. P., Schlegel, E. M., & Smith, R. K. 2000, ApJ, 534, L47
- Gordon et al. (2003) Gordon, K. D., Clayton, G. C., Misselt, K. A., Landolt, A. U., & Wolff, M. J. 2003, ApJ, 594, 279
- Hayashi et al. (1994) Hayashi, I., Koyama, K., Ozaki, M., Miyata, E., Tsumeni, H., Hughes, J. P., & Petre, R. 1994, PASJ, 46, L121
- Hughes et al. (2000) Hughes, J. P., Rakowski, C. E., & Decourchelle, A. 2000, ApJ, 543, L61
- Jansen et al. (2001) Jansen, F., et al. 2001, A&A, 365, L1
- McCandliss (2003) McCandliss, S. R. 2003, PASP, 115, 651
- Moos et al. (2000) Moos, H. W., et al. 2000, ApJ, 538, L1
- Morse et al. (1998) Morse, J. A., Blair, W. P., & Raymond, J. C. 1998, in Revista Mexicana de Astronomia y Astrofisica Conference Series, 21
- Nomoto et al. (1997) Nomoto, K., Hashimoto, M., Tsujimoto, T., Thielemann, F.-K., Kishimoto, N., Kubo, Y., & Nakasato, N. 1997, Nuclear Physics A, 616, 79
- Rasmussen et al. (2001) Rasmussen, A. P., Behar, E., Kahn, S. M., den Herder, J. W., & van der Heyden, K. 2001, A&A, 365, L231
- Russell & Dopita (1992) Russell, S. C. & Dopita, M. A. 1992, ApJ, 384, 508
- Sahnow et al. (2000) Sahnow, D. J., et al. 2000, ApJ, 538, L7
- Sasaki et al. (2001) Sasaki, M., Stadlbauer, T. F. X., Haberl, F., Filipović, M. D., & Bennie, P. J. 2001, A&A, 365, L237
- Seward & Mitchell (1981) Seward, F. D. & Mitchell, M. 1981, ApJ, 243, 736
- Smith et al. (2001) Smith, R. K., Brickhouse, N. S., Liedahl, D. A., & Raymond, J. C. 2001, ApJ, 556, L91
- Smith et al. (2001b) Smith, R. K., Brickhouse, N. S., Liedahl, D. A., & Raymond, J. C. 2001b, in ASP Conf. Ser. 247: Spectroscopic Challenges of Photoionized Plasmas, 161
- Tumlinson et al. (2002) Tumlinson, J., et al. 2002, ApJ, 566, 857
- Tuohy & Dopita (1983) Tuohy, I. R. & Dopita, M. A. 1983, ApJ, 268, L11
- van den Bergh (1999) van den Bergh, S. 1999, in IAU Symp. 190: New Views of the Magellanic Clouds, Vol. 190, 569
- Weisskopf et al. (1996) Weisskopf, M. C., O’dell, S. L., & van Speybroeck, L. P. 1996, in Proc. SPIE Vol. 2805, p. 2-7, Multilayer and Grazing Incidence X-Ray/EUV Optics III, Richard B. Hoover; Arthur B. Walker; Eds., 2
- Zhekov et al. (2005) Zhekov, S. A., McCray, R., Borkowski, K. J., Burrows, D. N., & Park, S. 2005, ApJ, 628, L127


| Obs. IDaaThroughout the paper, the FUSE observations are called N, NE, and SE, as indicated in the table. | Pointing direction | Aperture/ | Start time (UT) | Exposure | |
|---|---|---|---|---|---|
| RA | Dec | Instrument | night+daybbFor FUSE data. | ||
| (J2000.0) | [ksec] | ||||
| FUSE | |||||
| C0830101 (N) | 01:04:01.74 | –72:01:39.1 | MDRS | 2003-09-19 11:35:05 | 12 |
| C0830201 (NE) | 01:04:04.24 | –72:01:45.1 | MDRS | 2002-06-06 23:51:41 | 16 |
| C0830301 (SE1) | 01:04:04.04 | –72:02:01.9 | MDRS | 2003-08-29 07:54:23 | 8 |
| C0830302 (SE2) | 01:04:04.04 | –72:02:01.9 | MDRS | 2004-08-21 14:52:32 | 5 |
| XMM-Newton | |||||
| 0123110201 | 01:03:47.25 | –72:01:58.3 | EM1/2, SWccEPIC-MOS1/2 data in small window mode. | 2000-04-16 20:09:26 | 16 |
| 0123110301 | 01:03:47.19 | –72:01:58.3 | EM1/2, SWccEPIC-MOS1/2 data in small window mode. | 2000-04-17 04:43:36 | 13 |
| 0135720601 | 01:03:45.79 | –72:00:51.1 | EM1/2, SWccEPIC-MOS1/2 data in small window mode. | 2001-04-14 20:47:25 | 20 |
| Chandra | |||||
| 5123 | 01:03:56.41 | –72:01:18.7 | ACIS-S | 2003-12-15 04:27:06 | 20 |
| 5130 | 01:04:12.31 | –72:01:51.2 | ACIS-S | 2004-04-09 13:08:57 | 19 |
| Data | Bin | FWHM | Line Shift | Surface Brightness | Reduced | |
|---|---|---|---|---|---|---|
| [Å] | [km s-1] | [km s-1] | [erg cm-2 s-1 arcsec-2] | [erg cm-2 s-1 arcsec-2] | ||
| Naa1038 line flux fixed to half of the 1032 flux. | 0.3 | 1540350 | 380180 | (1.2 | (0.6 | 1.59 |
| NE | 0.3 | 970120 | 6060 | (1.7 | (1.3 | 1.65 |
| SE | 0.3 | 830310 | –16030 | (2.3 | (2.0 | 1.72 |
Note. — The flux is de-reddened. The errors are 90% confidence ranges.
| Region | O vii triplet/ | O vi doublet/ | O vi doublet/ | Ne ix triplet/ | Mg xi triplet/ |
|---|---|---|---|---|---|
| O viii Ly | O vii triplet | O viii Ly | Ne x Ly | Mg xii Ly | |
| N | |||||
| NE | |||||
| SE |
Note. — Emission line fluxes are obtained from the FUSE spectra (O vi doublet) and from the XMM-Newton spectrum (He-like triplets and H-like Ly line of O, Ne, and Mg) by fitting Gaussians.
| N | NE | SE | |
|---|---|---|---|
| (SMC) [ cm-2] | 1.6 (1.3 – 2.0) | 0.1 (0.0 – 0.4) | 0.4 (0.2 – 0.7) |
| 1. VNEI component (O ejecta) | |||
| [keV] | 0.40aa Result from the line diagnostics (Fig. 4). | 0.38aa Result from the line diagnostics (Fig. 4). | 0.30aa Result from the line diagnostics (Fig. 4). |
| O (solarbb Abundances from Anders & Grevesse (1989). ) | 93 (83 – 104) | 86 (80 – 94) | 99 (92 – 107) |
| [ s cm-3] | 6.0aa Result from the line diagnostics (Fig. 4). | 10.aa Result from the line diagnostics (Fig. 4). | 20.aa Result from the line diagnostics (Fig. 4). |
| cc Normalization , where is the distance to the source (cm), is the electron density (cm-3), and is the hydrogen density (cm-3). [] | 2.4 (2.2 – 2.6) | 2.3 (1.5 – 3.2) | 3.7 (3.5 – 3.9) |
| 2. VNEI component (Ne and Mg ejecta) | |||
| [keV] | 3.5 (2.7 – 3.7) | 1.5 (1.0 – 3.2) | 1.1 (0.8 – 1.6) |
| Ne (solarbb Abundances from Anders & Grevesse (1989). ) | 82 (75 – 89) | 86 (66 – 116) | 82 (77 – 94) |
| Mg (solarbb Abundances from Anders & Grevesse (1989). ) | 24 (20 – 28) | 33 (23 – 49) | 30 (22 – 40) |
| [ s cm-3] | 1.8 (1.7 – 1.9) | 2.3 (1.5 – 3.7) | 3.0 (2.1 – 4.4) |
| cc Normalization , where is the distance to the source (cm), is the electron density (cm-3), and is the hydrogen density (cm-3). [] | = | = | = |
| 3. VNEI component (ISM) | |||
| cc Normalization , where is the distance to the source (cm), is the electron density (cm-3), and is the hydrogen density (cm-3). [] | 3.0 (2.8 – 3.3) | 2.0 (1.8 – 2.3) | 2.3 (2.1 – 2.5) |
| Fit information | |||
| 559.7 | 608.8 | 618.8 | |
| d.o.f | 374 | 368 | 403 |
| Reduced | 1.50 | 1.65 | 1.54 |
Note. — The 90% confidence range is given in parentheses. The model consists of three VNEI components: one for the blast wave emission, two for the ejecta emission. The absorption for SMC is modeled with SMC abundances. Additional Galactic absorption is modeled with fixed column density of cm-2.
| N | NE | SE | |
|---|---|---|---|
| [pc3] | 19.84.0 | 24.34.9 | 26.05.2 |
| [ cm3] | 5.81.2 | 7.11.4 | 7.61.5 |
| Number densities | |||
| cc is the volume filling factor. [cm-3] | 0.0450.009 | 0.0380.008 | 0.0500.009 |
| [cm-3] | 0.0130.005 | 0.0120.004 | 0.0140.004 |
| [cm-3] | 0.00120.0004 | 0.00140.0005 | 0.00160.0005 |
| Massaa O, Ne, and Mg masses in the entire remnant assuming the density in the regions N, NE, or SE. assuming a thick shell | |||
| [] | 4.31.6 | 3.71.4 | 4.81.7 |
| [] | 1.60.8 | 1.40.7 | 1.70.7 |
| [] | 0.180.08 | 0.210.09 | 0.240.10 |
| Massaa O, Ne, and Mg masses in the entire remnant assuming the density in the regions N, NE, or SE. assuming a thick ringbb Assuming a thick ring suggested by Flanagan et al. (2004). | |||
| [] | 4.00.8 | 3.40.7 | 4.40.8 |
| [] | 1.50.5 | 1.30.4 | 1.60.5 |
| [] | 0.160.06 | 0.190.06 | 0.220.06 |