GRB 050814 at and the Redshift Distribution of Swift GRBs
Abstract
We report optical, near-infrared and X-ray observations of the afterglow of GRB 050814, which was seen to exhibit very red optical colours. By modelling its spectral energy distribution we find that . We next present a carefully selected sample of 19 Swift GRBs, intended to estimate in an unbiased way the GRB redshift distribution, including the mean redshift () as well as constraints on the fraction of high-redshift bursts. We find that and that at least 5% of the GRBs originate at . The redshift distribution of the sample is qualitatively consistent with models where the GRB rate is proportional to the star formation rate in the Universe. The high mean redshift of this GRB sample and the wide redshift range clearly demonstrates the suitability of GRBs as efficient probes of galaxies and the intergalactic medium over a significant fraction of the history of the Universe.
Keywords:
dust, extinction – early Universe – galaxies: high redshift – gamma rays: bursts:
95.85.Kr – 95.85.Nv – 98.70.Rz1 Introduction
The immense luminosities of the gamma-ray bursts (GRBs), coupled with their origin in the core collapse of massive stars jens ; stanek and their -ray penetration through dust, open up a variety of intriguing cosmological applications. Much effort has been directed into the use of GRBs for studying star formation (e.g. lise ), as backlights for exploring high-redshift galaxies and the intergalactic medium (e.g. paul ; palli04 ), and even as probes of cosmological parameters (e.g. ghirlanda ; mortsell ). Although the GRB population observed until the end of 2004 had enabled much progress in the field, it was widely expected that the launch of Swift, and the subsequent order of magnitude increase in the number of GRBs open to detailed study, would allow further insight into the high-redshift Universe gehrels . Indeed, the ability of Swift to locate and follow-up a fainter burst population than was previously possible edo05 has allowed the study of more distant bursts. The mean redshift of pre-Swift bursts was , while we show here that bursts discovered by Swift now have , including the first burst to have been discovered with , GRB 050904 at (e.g. kawai ).
2 Spectral energy distribution of the afterglow
Our multiband observations of the GRB 050814 afterglow are presented in palliz . They allowed the construction of its spectral energy distribution (SED), displayed in Fig. 1, where we have corrected the observed data points for foreground (Galactic) extinction. The SED has a strong break blueward of the -band, exhibiting colours of mag and mag, corresponding to spectral slopes of and , respectively (). The latter value is unreasonable for GRB afterglows, implying an electron energy power-law index more than ten times higher than normally observed. Even in the case of high local extinction (), such steep slopes cannot be obtained (see also reichart ).
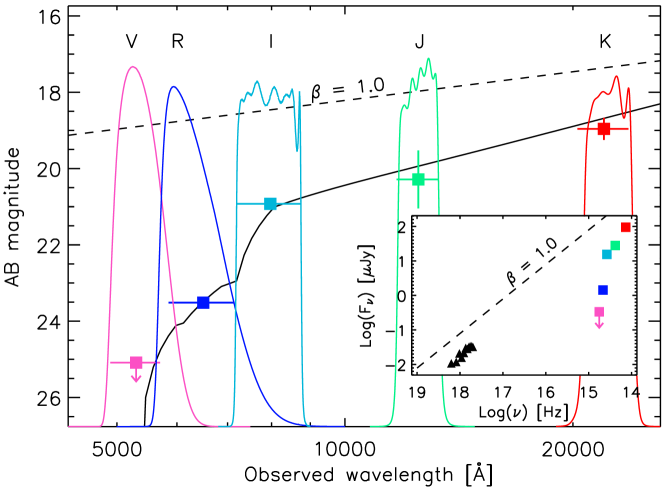
The most likely explanation for the steep break observed is due to the presence of the Ly break at a redshift of . To provide a more robust estimate of the GRB 050814 redshift we fit the available photometry at different redshifts, allowing for a range in and modelled using the parametrization of calzetti . The models of madau provide the average hydrogen opacity as a function of redshift. The minimum is obtained for . However, we are only able to obtain weak constraints on and . Fixing , a typical value for GRB afterglows, results in a best fit of a restframe mag and an unchanged redshift. This is marginally higher than has been inferred from the SEDs of pre-Swift bursts kann with bright optical afterglows (OAs), but is a necessary consequence of the red colour. The extrapolated line, normalized for mag, slightly overestimates the predicted X-ray flux (inset of Fig. 1), indicating that is a bit steeper; would make the X-ray data fall on the line. Since the best fit X-ray spectral index is consistent with the assumed optical/NIR one, a cooling break between the optical and X-rays can be ruled out.
3 The Redshift Distribution of Swift bursts
| GRB | Ref. | |||||
|---|---|---|---|---|---|---|
| [mag] | [deg] | [deg] | [%] | |||
| 051001 | 0.05 | 142 | 156 | 4 | ||
| 051006 | 0.22 | 83 | 121 | 12 | ||
| 051016A | 0.29 | 76 | 116 | 98 | ||
| 051016B | 0.94 | 0.11 | 73 | 117 | 99 | soderberg |
| 051117B | 0.18 | 130 | 48 | 97 | ||
| 060108 | 0.05 | 146 | 96 | 69 | monfardini | |
| 060111A | 0.09 | 61 | 111 | 90 | blustin | |
| 060115 | 3.53 | 0.44 | 121 | 72 | 99 | piranomonte |
| 060124 | 2.30 | 0.44 | 121 | 132 | 30 | mirabal |
In order to study the redshift distribution of GRBs, it is important to carefully select a sample containing bursts which have “observing conditions” favorable for redshift determination. In palliz we introduced four criteria with the aim of constructing such a sample. Here we recap those criteria and add a fifth one: (1) Small error circles, hence the bursts have to be localised with the XRT. (2) The Galactic extinction in the direction to the burst has to be sufficiently small or mag. (3) The XRT error circle should be distributed quickly (within 12 hours) for a relatively rapid follow-up. Although the automatic slewing of Swift was enabled in the middle of January 2005, part of the following month was dedicated to calibration which could not be interrupted. Therefore, we have only included bursts occurring after 1 March 2005. (4) Rejection of bursts with a declination unsuitable (above or below ) for follow-up observations. (5) The Sun-to-field distance has to be large enough, with .
The first 28 bursts in the sample were listed in table 2 in palliz . Nine additional bursts are presented in Table 1. For each burst we have also listed the Moon-to-field distance () and the Moon illumination at the time of the burst. This is done to examine if these parameters affect the redshift determination significantly, e.g. a full Moon close to a burst location. This is of course difficult to quantify as the OA brightness also plays a role. For example, GRB 050820A (table 2 in palliz ) has a measured redshift even if it occurred during a full Moon and . Therefore, we decided not to limit the sample further. This relatively “clean” sample of 37 bursts has a redshift recovery rate of roughly 50% (19/37).
Figure 2 shows the redshift distribution of the 19 bursts with a reported redshift in our Swift sample. Both the mean and the median is , more than twice as large as the corresponding numbers for pre-Swift bursts. A natural explanation for this increase is the lower trigger threshold of Swift compared to previous missions, giving rise to fainter (Swift events are on average 1.7 mag fainter in the -band at a similar epoch: edo05 ) and higher redshift bursts. This is complemented by the accurate positions provided by Swift and the rapid response of a variety of telescopes aimed at redshift determinations.
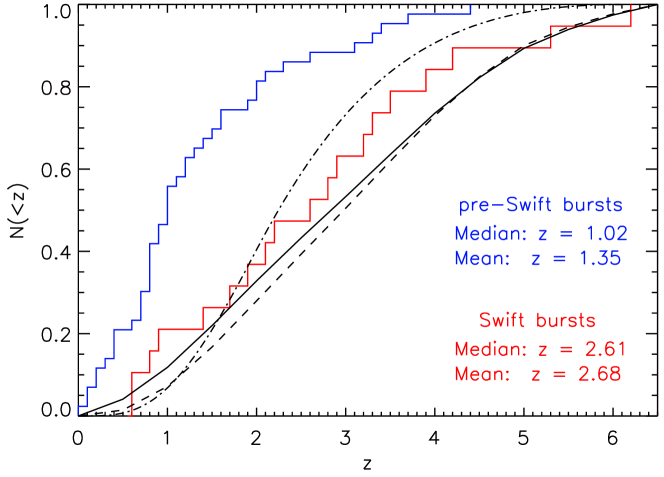
This Swift sample is the most uniform to date and it is of interest to compare its redshift distribution to models predicting the fraction of GRBs expected to occur at a given redshift. priya have modelled the expected redshift distribution for GRBs, utilising several models including those which follow the globally averaged star formation rate (model II), and those which scale according to the average metallicity of the Universe at a given redshift (model IV, see e.g. johan ; fryer ). javier have also carried out a similar exercise, where the GRB rate is assumed to be proportional to the star formation rate. These models are plotted in Fig. 2.
It is remarkable how similar the observed Swift redshift distribution is to the model predictions; we can now reason that GRBs indeed trace star formation (see also dai ; palli05 ). However, with the available sample and the limited flux sensitivity of the Swift/BAT for bursts, it is currently not possible to determine if GRBs are unbiased tracers of star formation. For example, models II and IV from priya are nearly indistinguishable when comparing to the relatively small sample of 19 bursts. Note that although model II from priya and the javier model both presuppose that the GRB rate is proportional to the star formation rate, they use different assumptions regarding the poorly determined GRB luminosity function and the intrinsic spectral shape, explaining their difference in Fig. 2.
By including all the bursts in Table 1 and table 2 in palliz , we are able to constrain the number of bursts above a specific redshift. For example, 5%–40% of the bursts are located at . The priya and javier predictions are 10% and 2%, respectively, suggesting that the GRB luminosity function parameters and/or the GRB spectral index assumed in priya might be more appropriate. bromm also predict that 10% of the Swift GRBs should originate at .
4 Discussion & Conclusions
The mean redshift of our relatively unbiased Swift sample () is larger than the median redshift of sub-mm galaxies (: chapman ) and is similar to that of Type 2 AGNs (: padovani ). With two GRBs discovered within a space of a month, and primarily due to the spectroscopic redshift of for GRB 050904 kawai , we are finally accessing the GRB high-redshift regime. Are we starting to probe the era of Pop III stars? If the transition between the dark ages and the era of reionization occurred around –7 (see e.g. miralda for a review), the answer might be positive. However, abel have calculated that at most one massive metal-free star forms per pre-galactic halo, and since the GRB progenitor may need to be a member of a close binary system in the collapsar scenario (e.g. fryer99 ; MacF ; zhang ), it seems unlikely that Pop III stars could end their lives as GRBs. woosley have proposed a non-binary possibility in the collapsar scenario, introducing unusually rapidly rotating massive stars. It is therefore possible that Pop III stars are GRB progenitors, although the number of unknowns is currently too large to arrive at a concrete conclusion.
The sample contains GRB 050814, whose OA was particularly faint in the -band; the observed optical to X-ray spectral slope is flatter () than expected for the fireball model. Hence, GRB 050814 is classified as a dark burst as defined by palliDARK . We have argued that this is most likely due to the high-redshift nature () of this burst; the colour is extremely red which is impossible to explain by strong extinction given the observed colour. Indeed, a similar conclusion was proposed for GRB 980329 andyZ .
It is clear that GRBs have now opened up a window to the very high-redshift Universe. The emerging GRB redshift histogram (Fig. 2) strongly indicates that GRBs can be used to trace the star formation in the Universe over a wide redshift range (). Future instrumentation, such as the X-shooter xshooter , will hopefully shed light on the end of the dark ages and the possible GRB/Pop III connection.
References
- (1) J. Hjorth, J. Sollerman, P. Møller, et al., Nature, 423, 847–850 (2003).
- (2) K. Z. Stanek, T. Matheson, P. M. Garnavich, et al., ApJ, 591, L17–L20 (2003).
- (3) L. Christensen, J. Hjorth, and J. Gorosabel, A&A, 425, 913–926 (2004).
- (4) P. M. Vreeswijk, S. L. Ellison, C. Ledoux, et al., A&A, 419, 927–940 (2004).
- (5) P. Jakobsson, J. Hjorth, J. P. U. Fynbo, et al., A&A, 427, 785–794 (2004).
- (6) G. Ghirlanda, G. Ghisellini, D. Lazzati, and C. Firmani, ApJ, 613, L13–L16 (2004).
- (7) E. Mörtsell, and J. Sollerman, JCAP, 6, 9–18 (2005).
- (8) N. Gehrels, G. Chincarini, P. Giommi, et al., ApJ, 611, 1005–1020 (2004).
- (9) E. Berger, S. R. Kulkarni, D. B. Fox, et al., ApJ, 634, 501–508 (2005).
- (10) N. Kawai, G. Kosugi, K. Aoki, et al., Nature, in press (astro-ph/0512052) (2006).
- (11) P. Jakobsson, A. Levan, J. P. U. Fynbo, et al., A&A, in press (astro-ph/0509888) (2006).
- (12) D. E. Reichart, ApJ, 553, 235–253 (2001).
- (13) D. Calzetti, L. Armus, R. C. Bohlin, et al., ApJ, 533, 682–695 (2000).
- (14) P. Madau, ApJ, 441, 18–27 (1995).
- (15) D. A. Kann, S. Klose, and A. Zeh, ApJ, in press (astro-ph/0512575) (2006).
- (16) A. M. Soderberg, E. Berger, and E. Ofek, GCN Circulars 4186 (2005).
- (17) A. Monfardini, C. G. Mundell, C. Guidorzi, et al., GCN Circulars 4502 (2006).
- (18) A. J. Blustin, S. Zane, and S. R. Rosen, GCN Circulars 4482 (2006).
- (19) S. Piranomonte, V. D’Elia, F. Fiore, et al., GCN Circulars 4520 (2006).
- (20) N. Mirabal, and J. P. Halpern, GCN Circulars 4591 (2006).
- (21) P. Natarajan, B. Albanna, J. Hjorth, et al., MNRAS, 364, L8–L12 (2005).
- (22) J. P. U. Fynbo, P. Jakobsson, P. Møller, et al., A&A, 406, L63–L66 (2003).
- (23) C. L. Fryer, and A. Heger, ApJ, 623, 302–313 (2005).
- (24) J. Gorosabel, N. Lund, S. Brandt, et al., A&A, 427, 87–93 (2004).
- (25) X. Dai, and B. Zhang, ApJ, 621, 875–883 (2005).
- (26) P. Jakobsson, G. Björnsson, J. P. U. Fynbo, et al., MNRAS, 362, 245–251 (2005).
- (27) V. Bromm, and A. Loeb, ApJ, in press (astro-ph/0509303) (2006).
- (28) S. C. Chapman, A. W. Blain, I. Smail, and R. J. Ivison, ApJ, 622, 772–796 (2005).
- (29) P. Padovani, M. G. Allen, P. Rosati, and N. A. Walton, A&A, 424, 545–559 (2004).
- (30) J. Miralda-Escudé, Science, 300, 1904–1909 (2003).
- (31) T. Abel, G. L. Bryan, and M. L. Norman, Science, 295, 93–98 (2002).
- (32) C. L. Fryer, S. E. Woosley, and D. H. Hartmann, ApJ, 526, 152–177 (1999).
- (33) A. I. MacFadyen, and S. E. Woosley, ApJ, 524, 262–289 (1999).
- (34) W. Zhang, S. E. Woosley, and A. Heger, ApJ, 608, 365–377 (2004).
- (35) S. E. Woosley, and A. Heger, ApJ, submitted (astro-ph/0508175) (2006).
- (36) P. Jakobsson, J. Hjorth, J. P. U. Fynbo, et al., ApJ, 617, L21–L24 (2004).
- (37) A. S. Fruchter, ApJ, 512, L1–L4 (1999).
- (38) S. D’Odorico, M. I. Andersen, P. Conconi, et al., SPIE, 5492, 220–229 (2004).