New Metallicities of RR Lyrae Stars in Centauri: Evidence for a Non He-Enhanced Metal-Intermediate Population††thanks: Based on FLAMES/GIRAFFE observations collected with the Very Large Telescope at the European Southern Observatory, Cerro Paranal, Chile, within the observing programs 74.B-0170(A).
Abstract
We present new spectroscopic metal abundances for 74 RR Lyrae stars in Cen obtained with FLAMES. The well-known metallicity spread is visible among the RR Lyrae variables. The metal-intermediate (MInt) RR Lyrae stars () are fainter than the bulk of the dominant metal-poor population (), in good agreement with the corresponding zero-age horizontal branch models with cosmological helium abundance . This result conflicts with the hypothesis that the progenitors of the MInt RR Lyrae stars correspond to the anomalous blue main-sequence stars, which share a similar metallicity but whose properties are currently explained by assuming for them a large helium enhancement. Therefore, in this scenario, the coexistence within the cluster of two different populations with similar metallicities () and different helium abundances has to be considered.
Subject headings:
techniques: spectroscopic — stars: abundances — stars: Population II — stars: variables: RR Lyrae — globular clusters: Cen (catalog )1. Introduction
The stellar system Centauri (NGC 5139) is the most massive and luminous globular cluster of the Milky Way, and is the only one showing a clear metallicity spread. Extensive spectroscopic surveys performed on large samples of giant stars (Norris et al. 1996; Suntzeff & Kraft 1996) have found a multimodal distribution of heavy elements. Recent photometric surveys have revealed the presence of multiple sequences in the color-magnitude diagram (CMD) of Cen. In particular, a discrete structure of the red giant branch (RGB) and subgiant branch (SGB) has been evinced (Lee et al. 1999; Pancino et al. 2000; Rey et al. 2004; Ferraro et al. 2004; Sollima et al. 2005a), indicating a complex formation history. In addition to the dominant metal-poor population (MP, ), three metal-intermediate (MInt) components (spanning a range of metallicity ) and an extreme metal-rich population () have been identified (Norris & Da Costa 1995; Smith et al. 2000; Pancino et al. 2002; Vanture et al. 2002). In the faint part of the CMD, Anderson (2002) and Bedin et al. (2004) discovered an additional blue main sequence (bMS, comprising 30% of all MS stars) running parallel to the dominant one. According to stellar models with canonical chemical abundances, the location of the observed bMS would suggest a lower metallicity. However, Piotto et al. (2005), from a spectroscopic analysis of 34 stars belonging to both MS components, found that the bMS stars are dex more metal-rich than the dominant cluster population, and therefore might be associated with one of the MInt components identified from the RGBs. The explanation currently proposed to account for the anomalous position of the bMS in the CMD is a significant helium enhancement (by ) for this stellar population (Norris 2004).
RR Lyrae stars (RRL), being representatives of the oldest populations, are important tracers of the formation history of Cen. The first sign of peculiarities in the RRL variables of Cen was found by Freeman & Rodgers (1975), who observed a wide spread in metallicity in a sample of 25 RRL. This result was later confirmed by Butler, Dickens, & Epps (1978) and Gratton, Tornambè, & Ortolani (1986). More recently, Rey et al. (2000) derived metallicities for 131 RRL stars from the index of the Ca photometric system.
We present here new metallicities for 74 RRL stars of Cen, and discuss the implications of helium enhancement on the location in the CMD and the pulsational properties of the MInt group of RRL stars. This can be useful in constraining the extent to which a spread in helium may or not be present in the cluster.
2. Data Analysis
Observations of 74 RRL variables (38 RRab and 36 RRc) were collected on February and March 2005 at the VLT/UT2 at ESO (Cerro Paranal, Chile) with the multi-fiber spectrograph FLAMES/MEDUSA. We used the high-resolution grating HR13 with a spectral coverage of 285 Å (6120-6405 Å) and a resolving power . For each star we obtained three exposures (3000 s + 3600 s + 3600 s) secured in good seeing conditions (), reaching an average per pixel. The one-dimensional spectra were extracted using the GIRAFFE pipeline. Thirty fibers were dedicated to sky observations in each exposure. An average sky spectrum was obtained and subtracted from the object spectra, by taking into account the different fiber transmission. The spectra were then continuum normalized with IRAF.
A set of 26 metal lines was selected from the database of Kurucz & Bell (1995) in the spectral range covered by our spectra. These lines were identified, whenever possible, on each spectrum, and were fit with Gaussian functions, whose centers provided the observed wavelength. The integral of the difference between the continuum and the line profile provided the equivalent width (EW) of each line. The abundance analysis was performed using the latest version of Kurucz (1979) model atmospheres111The effect of a helium overabundance of on the model atmosphere is to decrease the continuum opacity, thus enhancing the line strength by (corresponding to dex; Böhm-Vitense 1979). Given the small impact of such an effect, we adopted model atmospheres with a standard helium abundance. and the MOOG line analysis code (Sneden 1973) to compute LTE abundances from individual EWs. The abundance was derived from the model that best reproduced the observed EWs, for assumed values of temperature, gravity and microturbulence velocity. The errors on the abundances were calculated as the standard deviation of the abundance relative to all the measured lines.
Temperatures were derived from colors during the phase interval between the beginning and the end of each observation, using the light curves provided by Kaluzny et al. (2004). The mean magnitude of each star was derived from the infrared catalog by Sollima et al. (2004) and corrected for the phase effect using the template light curves by Jones et al. (1996).222Dereddened colors were computed adopting the reddening and extinction coefficients (Lub 2002), and (Savage & Mathis 1979). Temperatures were then derived using the color-temperature conversions by Montegriffo et al. (1998). As an independent check, we derived the temperature of each star directly from its spectrum by minimizing the trend in the deduced abundances with the excitation potential for the observed Fe i and Fe ii lines. The two measurements agree with each other to within K for most of the RRL in our sample.
The gravity parameter was then calculated from the universal gravitation law.333The gravity was calculated using the distance modulus (Bellazzini et al. 2004), the reddening and extinction coefficients listed above and the bolometric corrections by Montegriffo et al. (1998). The mass of the RRL stars was calculated from the stellar pulsation theory using the relations of Marconi et al. (2003, their eq. 2). The microturbulence velocity was initially set as , following Fokin & Gillet (1997), and then adjusted within a range of about by minimizing the trend in the deduced abundances with EWs for Fe i and Fe ii lines.
We performed the spectral analysis independently on each exposure adopting the extreme values reached by the parameters during the observation, and assumed the corresponding abundances as upper and lower limits. Spectra taken during maximum light were rejected because of non-LTE effects due to shock wave phenomena.
3. Results
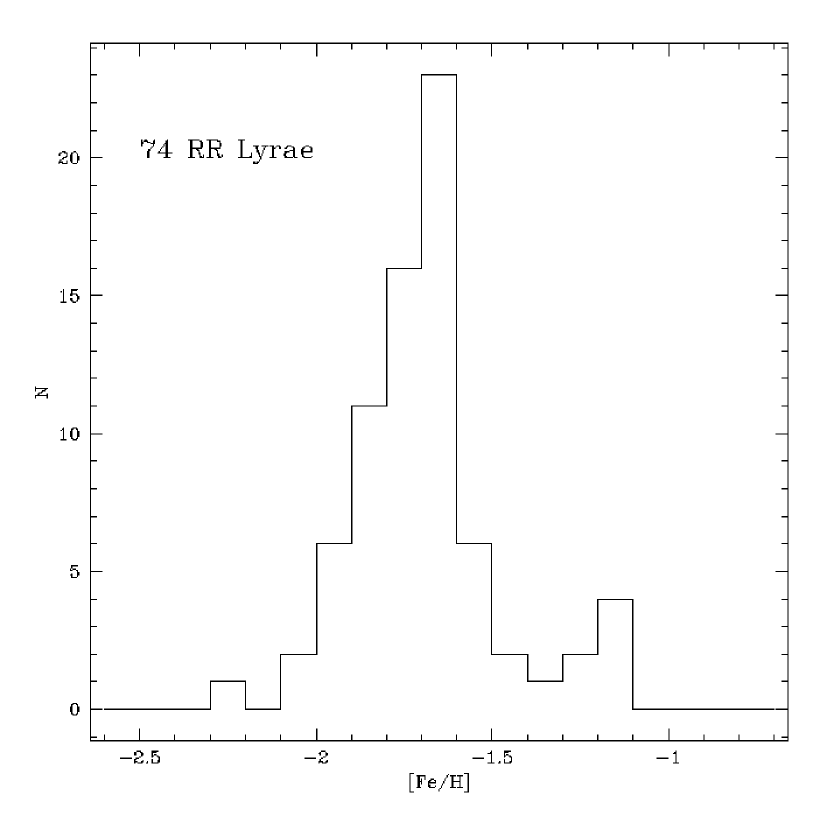
The metallicities derived for the 74 observed RRL stars are listed in Table 1. The metallicity distribution is shown in Fig. 1. The KMM test (Ashman, Bird, & Zepf 1994) performed on our metallicity distribution rejects the single Gaussian model at the 99.9% confidence level, supporting a bimodal distribution that peaks at and (MP and MInt groups, respectively) with an estimated common covariance 0.02. A detailed comparison with the metallicities measured by Rey et al. (2000) indicates a systematic offset dex, with a dispersion of dex. Since the accuracy of both sets of results is dex, the observed dispersion is consistent with the above uncertainties.
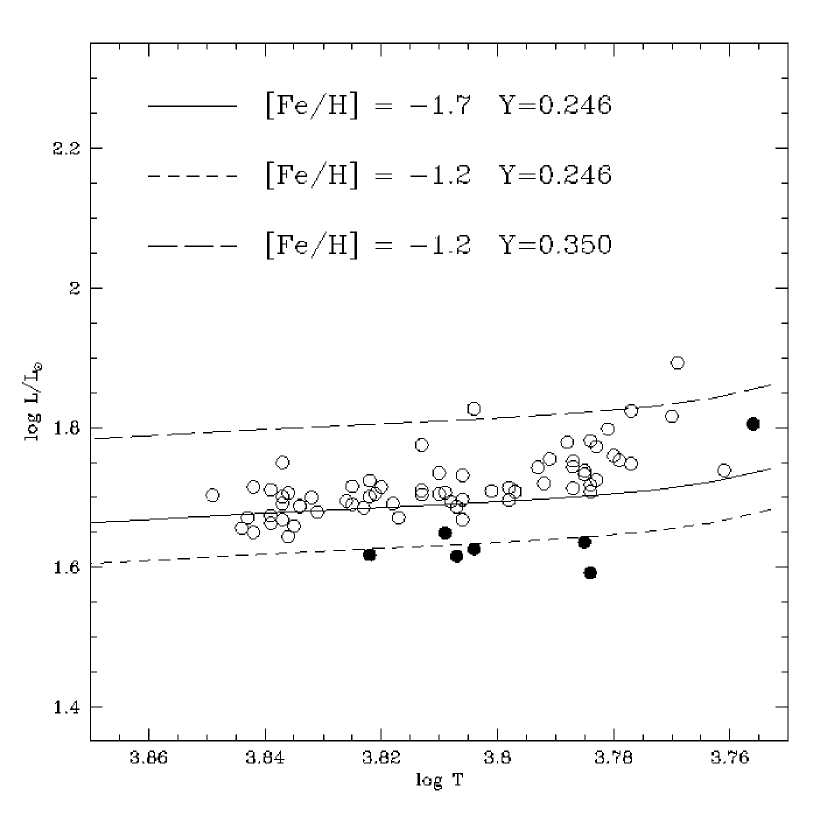
The location in the HR diagram of the RRL stars in our sample444We transformed the magnitudes and colors into luminosities and temperatures using a distance modulus (Bellazzini et al. 2004), as well as color transformations and -band bolometric corrections by Montegriffo et al. (1998). The colors were corrected for the non-static atmosphere using the correction by Bono, Caputo, & Stellingwerf (1995). is shown in Fig. 2. As can be seen, the dominant MP RRL population () has a mean luminosity , whereas MInt RRL () are systematically fainter, with . This evidence is in agreement with the results by Rey et al. (2000). For comparison, we show three zero-age horizontal branch (ZAHB) models555The ZAHBs were calculated using the FRANEC code (Straniero, Chieffi, & Limongi 1997). The location in the CMD was interpolated from the tracks of stars with masses ranging from 0.52 to 0.80 . with and , and , and and . The ZAHB models with fit nicely the lower envelopes of the respective MP and MInt RRL stars. Conversely, the helium-enhanced () MInt model is far too bright and does not match the observed MInt RRL stars.
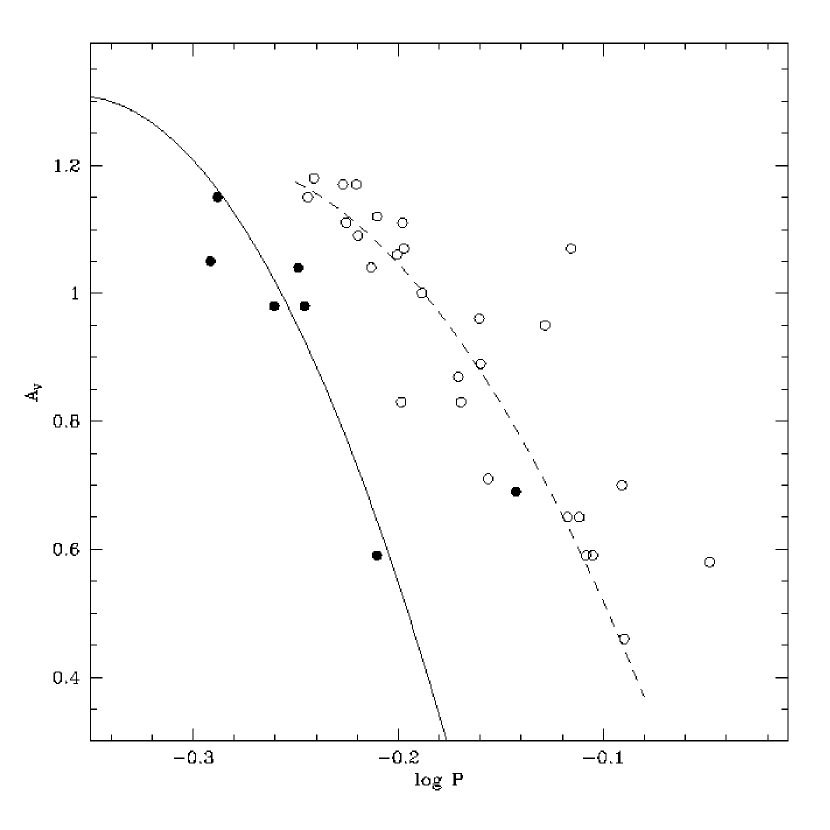
Fig. 3 shows the location of the RRab Lyrae in our sample in the period-amplitude diagram. For comparison, the mean locus of the M3 (Oosterhoff I type; Cacciari et al. 2005) and M92 (Oosterhoff II type) RRab Lyrae variables are overplotted in this figure. As can be noted, the stars of the MInt and MP samples occupy different regions of the diagram: while MInt stars do not show significant deviations from the M3666Note that M3 is a good reference cluster for the MInt RRL population in spite of its lower metal abundance, because metallicity does not have a significant effect on the period-amplitude distribution in globular clusters belonging to the same Oosterhoff group (Cacciari et al. 2005). period-amplitude relation, MP stars have longer periods and fall nicely on the M92 period-amplitude relation. . In this respect, the effect of a He enhancement on the MInt RRL would be to produce longer periods, as a consequence of the higher luminosities involved (Catelan 1996).
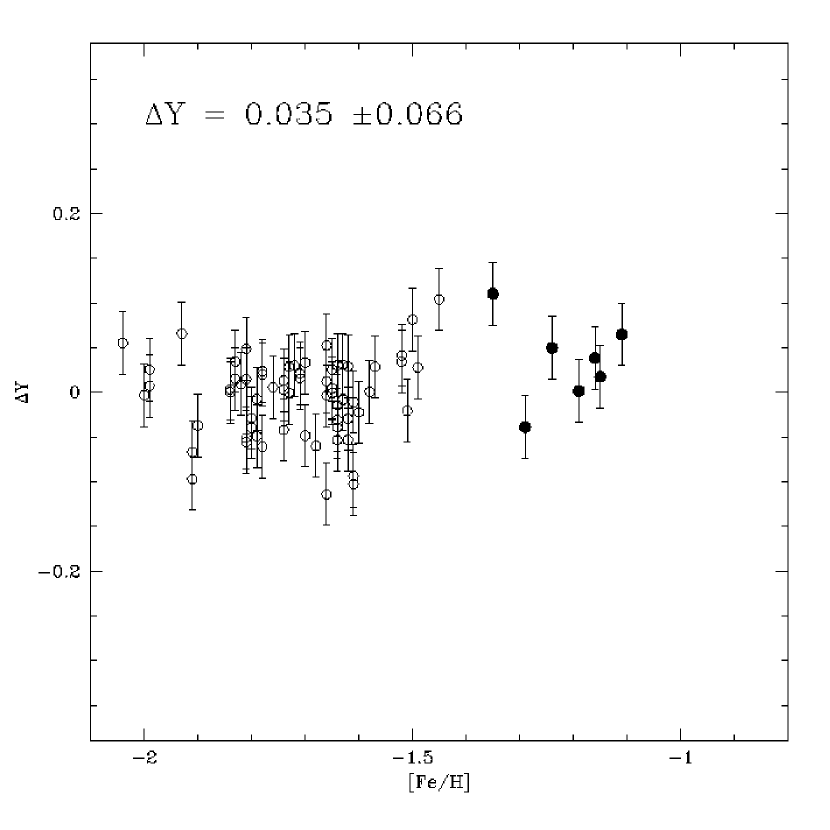
An independent check on the helium abundance can be made using the mass-luminosity parameter (Caputo, Cayrel, & Cayrel de Strobel 1983; Sandquist 2000). This parameter depends on the helium abundance in the sense that, at a fixed mass and for a given temperature, increasing the helium abundance increases the luminosity, and thereby the period, of an RRL star. Although has a relatively low sensitivity to the helium abundance, statistical errors are generally small (), and this method may provide some useful indications in regard to (at least) relative helium abundances. We derived values for the 74 RRL stars in our sample using eq. 8 of Cacciari et al. (2005), and converted these values into differences with respect to the mean of the MP stars assuming (Sandage 1990; Bencivenni et al. 1991). Figure 4 shows the obtained values of as a function of metallicity. As can be seen, there is no evidence of a systematic trend with metallicity to within the errors ().
4. Discussion
The most important result of this analysis is the confirmation of the existence of a metal-intermediate () RRL population in Cen with luminosity and pulsational properties that are incompatible with any significant helium overabundance. This evidence adds new complexity to the scenario proposed to explain the origin of the bMS. In fact, while spectroscopic analyses suggest that the bMS (Piotto et al. 2005) and the MInt RRL share a similar metallicity (), the results presented in this Letter demonstrate that they cannot share the same helium abundance. On the other hand, a helium-rich population is not expected to produce a sizeable RRL component (Lee et al. 2005), unless a fairly large age difference with respect to the dominant population of Cen ( Gyr, in the sense that the He-enriched population should be younger) is assumed, in contrast with the results by Hilker et al. (2004) and Sollima et al. (2005b), who both found a rather small ( Gyr) age difference between these two populations of Cen.
Therefore, following these considerations, two populations with similar metallicities but very different helium abundances seem to coexist within the cluster. This possibility is still compatible with the complexity of the population mix observed at the SGB level (see Ferraro et al. 2004; Sollima et al. 2005b), and sets severe constraints on the helium enrichment mechanism and its timescale.
As a matter of fact, in the framework of the self-enrichment scenario, the huge helium enrichment required to explain the anomalous position of the bMS in the CMD has to occur after the entire MP and (at least part of) the MInt population (comprising of the whole cluster population) were already formed without any significant helium enhancement. Then, the MInt He-rich population has to be formed from a gas enriched in helium by maintaining its metal abundance practically unchanged. Under this assumption, if the sources of the helium enrichment are intermediate-mass stars with (as suggested by D’Antona & Caloi 2004), then the entire chemical enrichment of the system has to occur over a time-scale of Myr. Moreover, a very efficient mechanism is required in order to homogenize and efficiently reuse all the “enriched” material ejected by the previous generation of polluting stars (Norris 2004). In this respect, further support to this scenario could come from new evidence suggesting that a similar helium self-enrichment may have occurred also in the metal-homogeneous globular cluster NGC 2808 (Lee et al. 2005; D’Antona et al. 2005; see also Catelan 2006 for a recent, critical discussion). Also in this case, no He-rich RRL have been found in the cluster (Corwin et al. 2004; D’Antona et al. 2005)
Alternatively, scenarios outside the “pure self-enrichment” one may also be considered; in particular, one possibility could be that the MInt populations formed in a different environment, thus not partaking the chemical enrichment process of Cen. In this case, a complex interplay of chemical and dynamical evolution has to be taken into account, including gas exchange with the Milky Way and/or minor mergers, within a framework such as the binary cluster mergers scenario (Minniti et al. 2004).
Alternative scenarios which try to reproduce the anomalous location of the bMS without invoking a helium overabundance are not much simpler and present even more obvious inconsistencies with observations. For example, if we assume that MInt RRL and bMS belong to the same population (with the same cosmological helium abundance), then the anomalous position of the bMS can only be explained by assuming a different (longer) distance modulus [ mag, corresponding to kpc behind the main body of the cluster]. This would be inconsistent with the MInt RRL luminosity shown in Fig. 2, which suggests that MInt RRL are at the same distance as the MP population. Moreover, Piotto et al. (2005) found that bMS stars show the same radial velocity distribution of the MP group, implying that the bMS and the main body of Cen are at least dynamically bound to each other.
The results presented in this analysis add new questions in the interpretation of the complex metal enrichment history of Cen. However, this additional piece of information is important to define a scenario able to explain the inhomogeneous chemical enrichment of the stellar populations of this system.
References
- Anderson (2002) Anderson, J. 2002, in Centauri: A Unique Window into Astrophysics, ed. F. van Leeuwen, J. D. Huges, & G. Piotto, ASP Conf. Series, 87
- Ashman et al. (1994) Ashman, K. M., Bird, C. M., & Zepf, S. E. 1994, AJ, 108, 2348
- Bedin et al. (2004) Bedin, L. R., Piotto, G., Anderson, J., et al. 2004, ApJ, 605, L125
- (4) Bellazzini, M., Ferraro, F. R., Sollima, A., Pancino, E., & Origlia, L. 2004, A&A, 424, 199
- Bencivenni et al. (2001) Bencivenni, D., Caputo, F., Manteiga, M., & Quarta, M. L. 1991, ApJ, 380, 484
- Böhm-Vitense (1979) Böhm-Vitense, E. 1979, ApJ, 234, 521
- (7) Bono, G., Caputo, F., & Stellingwerf, R. F. 1995, ApJS, 99, 263
- Butler, Dickens & Epps (1978) Butler, D., Dickens, R. J., & Epps, E. 1978, ApJ, 225, 148
- (9) Cacciari, C., Corwin, T. M., & Carney, B. W. 2005, AJ, 129, 267
- Catelan (1996) Catelan, M. 1996, A&A, 307, L13
- Catelan (2006) Catelan, M. 2006, in Resolved Stellar Populations, ASP Conf. Ser., ed. D. Valls-Gabaud & M. Chávez (San Francisco: ASP), in press (astro-ph/0507464)
- Corwin et al. (2004) Corwin, T. M., Catelan, M., Borissova, J., & Smith, H. A. 2004, A&A, 421, 667
- (13) D’Antona, F., Bellazzini, M., Caloi, V., et al. 2005, ApJ, 631, 868
- D’Antona & Caloi (2004) D’Antona, F., & Caloi, V. 2004, ApJ, 611, 871
- Ferraro et al. (2004) Ferraro, F. R., Sollima, A., Pancino, E., et al. 2004, ApJ, 603, L81 (F04)
- (16) Fokin, A. B., & Gillet, D. 1997, A&A, 325, 1013
- (17) Freeman, K. C., & Rodgers, A. W. 1975, ApJ, 201, L71
- Gratton, Tornambè, & Ortolani (1986) Gratton, R. G., Tornambè, A., & Ortolani, S. 1986, A&A, 169, 111
- Hilker et al. (2004) Hilker, M., Kayser, A., Richtler, T. & Willemsen, P. 2004, A&A, 422, L9
- (20) Jones, V. J., Carney, B. W., & Fulbright, J. P. 1996, PASP, 108, 877
- (21) Kaluzny, J., Olech, A., Thompson, I. et al., 2004, A&A, 424, 1101
- (22) Kurucz, R. L. 1979, ApJS, 40, 1
- (23) Kurucz, R. L., & Bell, R. 1995, Kurucz CD-ROM No. 23. Cambridge, Mass.: Smithsonian Astrophysical Observatory, .
- Lee et al. (1999) Lee, Y.-W., Joo, J.-M., Sohn, Y.-J., et al. 1999, Nature, 402, 55
- (25) Lee, Y.-W., Joo, S.-J., Han, S.-I., et al. 2005, ApJ, 621, L57
- (26) Lub, J. 2002, in A Unique Window into Astrophysics, ed. F. van Leeuwen, J. D. Hughes, & G.Piotto, ASP Conf.Series, Vol. 265, 95
- (27) Marconi, M., Caputo, F., Di Criscienzo, M., & Castellani, M. 2003, ApJ, 596, 299
- (28) Minniti, D., Rejkuba, M., Funes, S. J., et al. 2004, ApJ, 612, 215
- (29) Montegriffo, P., Ferraro, F. R., Origlia, L., & Fusi Pecci, F. 1998, MNRAS, 297, 872
- Norris & Da Costa (1995) Norris, J. E., & Da Costa, G. S. 1995, ApJ, 447, 680
- (31) Norris, J. E., Freeman, K. C., & Mighell, K. J. 1996, ApJ, 462, 241
- Norris et al. (1997) Norris, J. E., Freeman, K. C., Mayor, M., & Seitzer, P. 1997, ApJ, 487, L187
- (33) Norris, J. E. 2004, ApJ, 612, L25
- (34) Pancino, E., Ferraro, F. R., Bellazzini, M., et al. 2000, ApJ, 534, L83
- Pancino et al. (2002) Pancino, E., Pasquini, L., Hill, V., et al. 2002, ApJ, 568, L101 (P02) SPIE, 4841, 1682
- (36) Piotto, G., Villanova, A., Bedin, L. R., et al. 2005, ApJ, 621, 777
- (37) Rey, S.-C., Lee, Y.-W., Joo, J.-M., et al. 2000, AJ, 119, 1824
- Rey et al. (2004) Rey, S.-C., Lee, Y.-W., Ree, C. H., et al. 2004, AJ, 127, 958
- Sandage (1990) Sandage, A. 1990, ApJ, 350, 631
- Sandquist (2000) Sandquist, E. L. 2000, MNRAS, 313, 571
- (41) Savage, B. D., & Mathis, J. S. 1979, ARA&A, 17, 73
- Smith et al. (2000) Smith, V. V., Suntzeff, N. B., Cunha, K., et al. 2000, AJ, 119, 1239
- (43) Sneden, C. 1973, ApJ, 184, 839
- (44) Sollima, A., Ferraro, F. R., Origlia, L., et al. 2004, A&A, 420, 173
- Sollima et al. (2005a) Sollima, A., Ferraro, F. R., Pancino E., & Bellazzini, M. 2005a, MNRAS, 357, 265
- Sollima et al. (2005b) Sollima, A., Pancino E., Ferraro, F. R., et al. 2005b, ApJ, 634, 332
- (47) Straniero, O., Chieffi, A., & Limongi, M. 1997, ApJ, 490, 425
- (48) Suntzeff, N. B., & Kraft, R. P. 1996, AJ, 111, 1913
- Vanture et al. (2002) Vanture, A. D., Wallerstein, G., & Suntzeff, N. B. 2002, ApJ, 569, 984
| OGLE ID | [Fe/H] | RRL type | (d) | ||||||
|---|---|---|---|---|---|---|---|---|---|
| 5 | -1.24 | 0.11 | 14.745 | 13.295 | 3.804 | 1.626 | 1 | 1.15 | 0.515 |
| 11 | -1.61 | 0.22 | 14.534 | 13.158 | 3.813 | 1.704 | 1 | 0.65 | 0.565 |
| 15 | -1.68 | 0.18 | 14.397 | 12.765 | 3.784 | 1.781 | 1 | 0.70 | 0.811 |
| 16 | -1.65 | 0.46 | 14.562 | 13.409 | 3.839 | 1.674 | 0 | 0.49 | 0.330 |
| 20 | -1.52 | 0.34 | 14.579 | 12.953 | 3.784 | 1.708 | 1 | 1.12 | 0.616 |
Note. — The complete version of this table is in the electronic edition of the Journal. The printed edition contains only a sample.