The Tully-Fisher relations of the Eridanus group of galaxies
Abstract
The Tully-Fisher (TF) or the luminosity line-width relations of the galaxies in the Eridanus group are constructed using the H i rotation curves and the luminosities in the optical and in the near-infrared bands. The slopes of the TF relations (absolute magnitude logVflat) are , , , and in the R, J, H, and K bands respectively for galaxies having flat H i rotation curves. These values of the slopes are consistent with those obtained from studies of other groups and clusters. The scatter in the TF relations is in the range mag in different bands. This scatter is considerably larger compared to those observed in other groups and clusters. It is suggested that the larger scatter in the TF relations for the Eridanus group is related to the loose structure of the group. If the TF relations are constructed using the baryonic mass (stellar + H i + Helium mass) instead of the stellar luminosity, nearly identical slopes are obtained in the R and in the near-infrared bands. The baryonic TF (baryonic mass logVflat) slope is in the range .
keywords:
Galaxy: rotation, luminosity-linewidth relation – galaxies: groups – individual: Eridanus – radio lines: H i 21cm-line.1 Introduction
A correlation between the total mass derived using the HI line-widths and optical luminosity was noticed in the late 70’s and early 80’s by a number of investigators (e.g., Roberts 1969, Rogstad & Shostak 1972, Balkowski et al. 1974, Shostak 1975). Tully & Fisher (1977) suggested a luminosity-linewidth relation of the form to measure distances to spiral galaxies. Subsequently, the luminosity-linewidth relation was also known as the Tully-Fisher (TF) relation. Tully & Fisher (1977) demonstrated that using some nearby spiral galaxies for which the distances are known accurately, the luminosity-linewidth relation can be calibrated to infer distances to clusters of galaxies as well as to obtain a value for the Hubble constant. The value of index has been found to be in the optical bands and in the near-infrared bands.
The Tully-Fisher relation can possibly be best attributed to a tight correlation between dark matter and the total baryonic matter embedded in it. This is because the constant rotation velocity in the outer regions of galaxies is believed to be due to dark matter, and the stellar luminosity directly correlates with the stellar mass, which is the dominant component of the baryonic mass in a galaxy. The cold dark matter models of galaxy formation predict a relation () between the baryonic mass and the rotation velocity , where for non-baryonic dark matter (e.g., van den Bosch 2000, Navarro & Steinmetz 2000) and for the collisional baryonic dark matter (Walker 1999). The stellar component of the baryonic mass can be estimated from the stellar luminosity, provided, the stellar mass to light ratio () is known. Bell & de Jong (2001) estimated as a function of color using the spectro-photometric stellar population synthesis models of galaxy evolution. Observationally, the value of is found in the range (e.g., McGaugh et al. 2000, Bell & de Jong 2001). It is advantageous to study the TF relation using the near-infrared luminosities due to the following two reasons: 1) the extinction due to dust is minimal in these bands and, 2) the total stellar mass in galaxies is dominated by the old stellar population, which emits mostly in the near-infrared.
The I-band TF relation in several groups and clusters has been studied by Giovanelli et al. (1997) using H i line-widths and optical rotation curves. They noticed that the TF relations in the Eridanus and Centaurus groups, and in the Fornax cluster have larger scatter ( mag) compared to that in other groups and clusters (). One of the implications of the larger scatter could be significant distance variations for galaxies in those groups or clusters. Giovanelli et al. (1997) discussed the selection effects and biases inherent in a sample of galaxies and their consequences on the slope and on the scatter in the TF relations. Furthermore, the observed scatter will also depend on the sample size. In addition to the above effects, various extinction corrections applied to obtain the intrinsic luminosity of a galaxy are not well understood. The line-width or the rotation velocity also needs to be corrected for the random and turbulent motions in the galactic-disks. Tully & Fouque (1985) have described the procedures to make various corrections to the two TF observables, rotation velocity and the stellar luminosity. Many of these corrections are empirically determined. There are indications that the TF slope depends upon the types of galaxies (Rubin et al. 1985). Persic et al. (1996) have shown a strong dependence of the shape of the rotation curve on the I-band luminosity. They noticed that galaxies with M have rotation curves declining in their outer regions. The dependence of the TF relation on the shapes of rotation curves has been recently brought to attention by Verheijen (2001). For galaxies in the Ursa-Major group, they reported a scatter as low as 0.21 mag in the K-band TF relation, consistent with the measurement uncertainties and leaving no scope for any intrinsic scatter in the TF relation. They also reported that the scatter in the near-infrared TF relation is reduced by mag if the flat rotation velocity is used instead of the maximum rotation velocity. Therefore, it appears that the flat part of the rotation curve, and hence the dark matter is better correlated with the stellar luminosity.
The TF relations for the Eridanus group have been studied in the I-band (Giovanelli et al. 1997) and in the near-infrared bands (Bamford 2002). The I-band TF slope for the Eridanus group () is slightly steeper than the mean slope () for all the clusters studied by Giovanelli et al. (1997). Bamford (2002) reported a K-band TF slope of and a scatter of for the Eridanus group.
In this paper, the optical R-band and the near-infrared TF relations are constructed using the H i rotation curves of galaxies in the Eridanus group using the GMRT observations. The H i observations and the data analyses are described in Omar & Dwarakanath (2005). The near-infrared photometry in the J, H, and K bands are from the Two Micron All Sky Survey (2MASS). The optical R-band photometric data are from the 104-cm Sampurnanand telescope at Nainital (Omar 2004).
2 The Radio observations
The H i 21cm-line observations of the Eridanus galaxies were carried out with the Giant Meterwave Radio Telescope (GMRT). The details of the observations and of the data analyses can be found in Omar & Dwarakanath (2005). Here, only a brief description is given. Galaxies were not selected based on their H i content or the optical luminosity. The disk galaxies were selected primarily from the inner 4 Mpc region of the group where the galaxy density is high. This selection criterion was adopted since one of the aims of this survey was to study the galaxy evolution in the high galaxy density regions. After editing and calibrating the data, a channel rms of mJy beam-1 was obtained. The velocity resolution was typically km s-1 and the spatial resolution was ( kpc).
The velocity fields of galaxies were obtained from one-component Gaussian fittings of the line-profiles at each pixel containing H i signal. It was found that this procedure of constructing velocity field provides better image fidelity compared to that obtained from the moment analysis. The kinematical parameters (position angle, inclination and rotation curve) of the H i disks were obtained using the tilted-ring model. Detailed analyses, maps and results are presented in Omar & Dwarakanath (2005). The galaxies often showed kinematical lopsidedness. However, the rotation curves used in the present analyses are averages of those for the approaching and the receding sides. The rotation curves of the galaxies in the current study have no appreciable difference between the maximum and the flat rotation velocities. Therefore, the TF studies are carried out using the flat part of the rotation curves, which do not require any significant correction for the effects of beam smearing. The flat parts of the rotation curves were inferred by visual inspection.
3 The Optical data
3.1 R-band observations and data reduction
The optical observations were carried out in the R-band () using the 104-cm Sampurnanand reflector at the Aryabhatta Research Institute of observational-sciencES (ARIES, formerly State Observatory; longitude E, latitude N, altitude m), Nainital. This telescope uses the Ritchey-Chrétien system with a f/13 Cassegrain focus having a plate scale of mm-1. The observations were carried out during October 11 - 17, 2002. These observations were carried out during a month when the atmospheric conditions at the site are good. The data were recorded on pixels CCD camera cooled at the temperature of liquid Nitrogen. The CCD covers a field of view on the sky with each square element having a resolution of . The data were acquired after averaging the counts in every pixels making each square element equal to . The read-out noise and the gain of the CCD camera are 10 e- and 5.3 e- per analog-to-digital count respectively. Two to five frames each of 5 min or 3 min duration were observed for each galaxy. A few galaxies having low surface brightness features were observed for a total of 30 min duration. The observational parameters are given in Tab. 1.
| Name | Frames | Time | Airmass | FWHM |
| ESO 482- G 035 | 2 | 10 | 1.71 | 2.8 |
| ESO 548- G 065 | 2 | 10 | 1.57 | 2.6 |
| ESO 549- G 002 | 2 | 10 | 1.95 | 2.8 |
| IC 1952 | 3 | 10 | 1.66 | 2.3 |
| IC 1953 | 4 | 20 | 1.87 | 2.9 |
| IC 1962 | 3 | 15 | 1.87 | 2.4 |
| MCG -03-10-041 | 2 | 10 | 1.76 | 3.1 |
| NGC 1325 | 2 | 10 | 1.66 | 2.6 |
| NGC 1371 | 3 | 15 | 1.66 | 3.2 |
| NGC 1385 | 6 | 30 | 1.65 | 2.7 |
| NGC 1414 | 2 | 10 | 1.68 | 2.9 |
| NGC 1422 | 2 | 10 | 1.68 | 2.9 |
| SGC 0321.2-1929 | 2 | 30 | 1.54 | 2.0 |
| UGCA 068 | 2 | 10 | 1.77 | 3.6 |
| UGCA 077 | 2 | 10 | 1.59 | 3.1 |
| Column 1: Name of the galaxy, Column 2: Number of frames, Column 3: Total exposure time (in minutes) combining all the frames, Column 4: The mean value of the airmass estimated at the mid-exposure time of the frames; Column 5: The FWHM (in arcsec)of stellar images on CCD estimated after co-adding the frames. | ||||
On October 13, 2002 the standard Landolt field SA 92 (Landolt 1992) was observed in the V and R bands for photometric calibration and local atmospheric extinction correction. A total of eight stars from this Landolt field with V magnitudes between 12.5 and 15.6, and, (V–R) colors between 0.31 and 0.72 were observed at different zenith angles. The value of the zero point is and that of the extinction coefficient () is on that night. The value of the color coefficient to make the color correction was insignificant. Hence, no color corrections were made. The typical value for the R-band sky brightness was 20.5 mag arcsec-2. The average was . Based on the vast observing experience at the observatory, if weather is stable during the observing period, no significant variations in the calibration is expected during the nights. The weather during the observing period was found to be stable. Hence, the Landolt field to determine the calibration was observed during one of the five nights. The calibration errors are expected to be less than 0.05 mag, estimated from the fitting errors in the extinction coefficient and the zero-point. These observations lie in the regime where noise in the image is dominated by the sky brightness. We estimate, for a typical galaxy size of , an additional error of 0.03, 0.15, and 0.7 mag for a 10, 12, and 14 mag galaxy respectively due to Poisson noise.
On each night of observation, several bias frames were taken and averaged to correct the CCD frames. Since the exposure time in each frame was short, no significant dark counts are expected. Every alternate night, morning twilight flat fields were observed. For the nights when no flat fields were taken, previous day’s flat fields were used. The CCD data reduction was performed using the package CCDRED in the Image Reduction and Analysis facility (IRAF) software package developed by National Optical Astronomy Observatory. The frames were aligned using bright stars in the field. The pixels hit by cosmic rays were removed using the median filtering in each pixel of different frames whenever at least three frames for a field were available. When there were only two frames available, the bad pixels were identified by comparing their values with the average value of the surrounding pixels. After removing the cosmic ray events, all the aligned frames for a galaxy were averaged to get the final image. The images were regrided to a pixel size of . The images were registered for the equatorial coordinates in the J2000 epoch using the Digitized Sky Survey (DSS) plates.
The sky background was taken as the mode of the pixel values in the averaged frame. If the presence of a bright star near the edge or within the observed frame caused significant light gradients across the frame, or, the electron pickup noise caused bright and dark stripes in the frames, a mean value of the sky was estimated using pixels surrounding the galaxy. The Galactic foreground stars over a galaxy were replaced by an average value of the intensities surrounding the affected region. The azimuthally averaged limiting surface brightness is mag arcsec-2 in the R band.
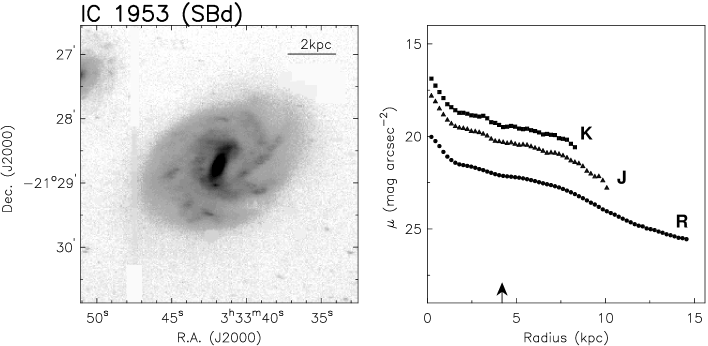
The R-band image of IC 1953 and its surface brightness profile are shown in Fig. 1 as an example. More images can be found in Omar (2004).
3.2 2MASS archival data
The 2MASS is an all sky survey in the near-infrared J (1.24 m), H (1.66 m) and Ks (2.16 m) bands (Jarrett et al. 2000). Each 2MASS camera consists of a liquid Nitrogen cooled cryostat, housing three NICMOS3 CCDs each covering a field of view on the sky. The final calibrated, co-added (6.8s integration time), and full resolution images with sampling are obtained from the 2MASS archive.
The overall photometric accuracy of the 2MASS images is believed to be better than mag (Jarrett et al. 2000). The zero points are typically , , and for the J, H, and K bands respectively. The sky brightnesses are typically , , mag arcsec-2 in the J, H, and K bands respectively. The azimuthally averaged surface brightness sensitivities (3) are , , and mag arcsec-2 in the J, H, and K bands respectively.
4 Image analyses
The image analyses were carried out using IRAF, KARMA, and GIPSY (Groningen Image Processing System). All the images were converted to an identical format with pixel size and regrided to the J2000 epoch. Foreground stars on galaxies, bad pixels, and other defects in the images were removed and replaced by the mean of the pixels surrounding the affected region. The axial parameters of the stellar disks (position angle and ellipticity), surface brightness profiles, color profiles, disk scale lengths, central disk surface brightnesses, isophotal and total magnitudes etc. were estimated. Details of the analyses and results are described in Omar (2004). Here, the procedure to obtain the magnitudes of galaxies is described. The photometric data are presented in Table 5 (Appendix I).
4.1 Isophotal and total magnitudes
Both isophotal and total magnitudes were obtained for the galaxies. The isophotal magnitudes were estimated within the isophote at , , , and mag arcsec-2 for the R, J, H, and K bands respectively. These are the limiting isophotes for the respective bands. The isophotal magnitude corrected for the atmospheric extinction is estimated using the following relation:
| (1) |
where the subscript refers to the limiting isophote in a band and the superscript refers to isophotal, is the zero point magnitude corresponding to 1 second of exposure time, is the extinction coefficient, is the airmass, is the total number of counts above the sky background within the limiting isophote, and is the total exposure time on the galaxy.
The isophotal magnitude provides a lower limit to the actual luminosity of a galaxy. Normally, optical observations are sensitive to detect light up to disk scale lengths while near-infrared observations detect light only up to disk scale lengths in a reasonable exposure time. It is obvious that different bands are sensitive to different levels in detecting light from galaxies. To overcome this effect, correction for the un-detected light has to be applied to obtain the total magnitudes of galaxies. If the disks were infinitely extended and follow the exponential light profiles, it can be shown that the total light above a certain limiting isophotal radius depends only on the number of scale lengths within that limiting radius, and can be estimated using the following relation :
| (2) |
(Tully et al. 1996); where is the total light beyond the limiting isophote radius and n is the number of observed scale lengths within the limiting isophote radius . Here, and are the central disk surface brightness and the surface brightness of the limiting isophote respectively. It is suggested by Tully et al. (1996) that the disks are in reality not infinitely extended but rather truncated. They empirically determined that only 88% of the given by Eq. 2 should be used to make correction to the isophotal magnitude in order to get the total magnitude.
The scale length , and the central disk surface brightness were estimated from a fit of the form to the averaged radial surface brightness profile (see Omar 2004 for details). The average radial surface brightness () was computed for galaxies in elliptical annuli of width with a fixed position angle and ellipticity. The inner regions where the disk profiles are significantly modified due to the presence of a bar or a bulge were excluded in the fit. The range of data to be excluded in the fit was determined by visual inspection.
4.2 Extinction corrections
The total magnitudes were corrected for the Galactic and the internal dust extinction in galaxies. The values of the Galactic extinction provided by Schlegel et al (1998) were used in the present analysis. The high Galactic latitude () of the Eridanus group results in minimal Galactic extinction. The average values of the Galactic extinction toward Eridanus are , , , and mag in the R, J, H, and K bands respectively. The estimation of the internal dust extinction in galaxies is quite uncertain. It depends on their orientation, morphological type, size, and luminosity. Several authors have discussed internal dust extinction in galaxies (e.g., Tully & Fouque 1985, Tully et al. 1998, Masters et al. 2003). We used the corrections suggested by Tully et al. (1998) and Masters et al. (2003), who obtained an empirical relation between the total luminosity and the dust content in disk galaxies. The extinction, , is given as a function of the axial ratio () in the pass-band as:
| (3) |
Where and are the length of the semi-major and the semi-minor axis respectively. The was estimated in each band using an equation of the following form:
| (4) |
where the values of the coefficients (i=0,1,2) for each band and for different magnitude ranges are given in Tab. 2. is the absolute magnitude in the corresponding pass-band.
| Band | mag. range | |||
|---|---|---|---|---|
| R | 0.00 | 0.00 | 0.00 | |
| 0.00 | -0.24 | 16.2 | ||
| J | 0.77 | -0.26 | 23.0 | |
| 0.60 | -0.04 | 23.0 | ||
| H | 0.58 | -0.26 | 23.0 | |
| 0.38 | -0.01 | 23.0 | ||
| K | 0.31 | -0.13 | 23.0 | |
| 0.20 | 0.00 | 23.0 |
5 Sample selection and the error budget
The slope and the scatter in the TF relation depends on the selection criteria and biases in the sample. Bernstein et al. (1994) outlined some criteria for galaxies to be included in TF studies. They preferred non-interacting galaxies of types Sb – Sd with steep H i profiles at the end velocities, having smooth outer isophotes and without a prominent bar. Galaxies with inclination are generally not included in TF studies. This is because for low inclination galaxies, it is difficult to get an accurate estimate of the position angle and the inclination angle. This results in uncertain deprojected rotation velocities. For instance, for a TF slope of in the near-infrared, a marginal error of 5∘ in the inclination angle introduces an additional scatter of nearly 0.4 mag, 0.2 mag and 0.05 mag in the TF relations at inclinations of 45∘ , 60∘ , and 80∘ respectively. At the same time, nearly edge-on galaxies will have their optical luminosities poorly estimated due to uncertainties in the internal dust extinction corrections. Therefore, TF studies on galaxies having intermediate inclination angles, and in the near-infrared bands are preferred. One would also like to reduce scatter due to uncertainties in the distances to galaxies in a sample. For this reason, galaxies in a group or a cluster may be the right choice instead of field galaxies.
The survey of the Eridanus group was not volume-limited. The rotation curves were measured for about half of the spiral galaxies. Therefore, somewhat relaxed criteria compared to those described above are used to construct the sample for the present study. The S0/a and interacting galaxies were excluded from the sample. Galaxies with inclination less than are not included. There are 4 galaxies (ESO 548- G 065, ESO 549- G 002, IC 1962, NGC 1422), whose rotation curves are nearly flat. The sample consists of finally a total of 17 galaxies for which the H i rotation curves are flat or nearly flat in the outer regions. These galaxies are included in the sample. The photometric data on all galaxies are not available in all the bands. The photometric and the kinematical properties of the galaxies in the Eridanus group are given in Tab. 3.
We have assumed all the galaxies to be at a distance of Mpc. This assumption is based upon the distance estimates using the surface brightness fluctuations in the I-band and in the K-band of a few early type galaxies in the different sub-groups of the Eridanus group (Jensen et al. 1998, Tonry et al. 1997, Tonry et al. 2001). The mean distance modulus of NGC 1400 (S0, 558 km s-1 ), NGC 1407 (E, 1779 km s-1 ), NGC 1395 (E, 1717 km s-1 ), NGC 1332 (S0, 1524 km s-1 ), and NGC 1426 (E, 1443 km s-1 ) is mag.
| Name | Type | Incl. | log(W) | MR | MJ | MH | MK |
|---|---|---|---|---|---|---|---|
| ESO 482- G 005 | SBdm | 84.6 | 2.205 | – | -17.31 | – | – |
| ESO 482- G 035 | SBab | 51.8 | 2.374 | -18.86 | -20.62 | -21.08 | -21.45 |
| ESO 548- G 021 | SBdm | 88 | 2.244 | – | -18.47 | -18.19 | -18.99 |
| ESO 548- G 065 | SBa | 79.6 | 2.164 | -16.96 | -18.29 | – | – |
| ESO 549- G 002 | IBm | 53.1 | 2.048 | -17.46 | -18.33 | – | – |
| IC 1952 | SBbc | 81.4 | 2.427 | -19.39 | -21.55 | -22.09 | -22.19 |
| IC 1953 | SBd | 50.6 | 2.476 | -20.18 | -22.13 | -22.68 | -23.04 |
| IC 1962 | SBdm | 79.8 | 2.216 | -17.64 | -18.24 | -18.21 | -19.41 |
| MCG -03-10-041 | SBdm | 62.5 | 2.342 | -18.25 | -19.92 | -20.44 | -20.54 |
| NGC 1325 | SAbc | 74.5 | 2.500 | -20.69 | -22.64 | -23.18 | -23.33 |
| NGC 1371 | SABa | 48.1 | 2.716 | -21.12 | -23.38 | -24.00 | -24.21 |
| NGC 1385 | SBcd | 51.5 | 2.442 | -20.97 | -22.80 | -23.41 | -23.55 |
| NGC 1414 | SBbc | 79.8 | 2.193 | -16.95 | -19.27 | -19.68 | -20.10 |
| NGC 1422 | SBab | 79.6 | 2.169 | -17.95 | -20.38 | -20.95 | -21.16 |
| SGC 0321.2-1929 | IBm | 36.2 | 2.052 | -15.04 | – | – | – |
| UGCA 068 | SABcdm | 37.6 | 2.244 | -17.57 | -18.90 | -19.15 | -19.65 |
| UGCA 077 | SBdm | 64.3 | 2.193 | -17.30 | – | – | – |
| Notes: Column 1: Name of the galaxy, Column 2: Hubble type. Column 3: The inclination angle (in degree) as obtained from the tilted ring model or obtained from the R-band optical images in those cases where the tilted ring model did not provide a satisfactory fit, Column 4: Width is twice the value of the velocity at the flat part of the rotation curve, or, of the rotation velocity at the last measured point. Columns 5-8: Absolute total magnitudes in the R, J, H, and K bands respectively. These magnitudes include all the corrections as described in Sect. 4. All the galaxies are assumed to be at a distance of 23 Mpc (distance modulus ). | |||||||
The photometric precision is estimated taking into account the measurement uncertainties. For typical magnitudes of the Eridanus galaxies ( mag) in the R-band, the photometric accuracy is estimated as mag (Omar 2004). The accuracy of the 2MASS photometry is taken as 0.1 mag. There seems to be not much understanding on how much additional scatter can arise in the TF relations due to uncertainties in the internal dust extinction. Verheijen (2001) noted that the scatter in the TF relation is increased by a marginal amount ( mag) from the K band to the R-band. If we attribute this extra scatter to the extinction corrections, it appears that the internal dust extinction corrections are fairly well determined in these bands. There may be a significant contribution to the total scatter due to errors in the inclination angles of galaxies as explained before. We estimate the error budget for an intermediate inclination of 60∘ . Though all the errors may not be truly random in nature, we estimate the total expected rms assuming that the different errors add up randomly. This combined error is estimated as mag.
6 Tully-Fisher relations
6.1 luminosity-linewidth relation
Figure 2 shows TF relations in the R, J, H, and K bands. A least square fit is carried out to obtain the slope and the intercept for an equation of the form . The fit is carried out using data for galaxies having flat rotation curves (). All such data points are given equal weights. The total observed scatter (rms of residuals) is estimated in magnitude. The slope, the intercept, and the scatter obtained from the fit are given in Tab. 4.
The slopes of the TF relations obtained in the present analysis are comparable to those obtained in other studies of nearby groups and clusters (e.g., Giovanelli et al. 1997, Verheijen 2001). The TF slopes from the current study are , , , in the R, J, H, and K bands respectively. The slopes obtained by Verheijen (2001) for the Ursa-Major galaxies are and in the R and K bands respectively. They reported a scatter as low as mag for the K-band. Giovanelli et al. (1997) obtained a mean slope of in the I-band for a set of nearby groups and clusters. They also reported an I-band TF slope of with a scatter of mag for the Eridanus group using their single dish H i data and the optical rotation curves. They pointed out that both the slope and the scatter for the Eridanus group are somewhat different from the average values for other groups and clusters in their sample. Recently, using the photometric data from 2MASS and the kinematical data from Giovanelli et al. (1997), Bamford (2002) reported slopes of , , and for the J, H, and K bands respectively, and a scatter of mag for the Eridanus galaxies. It can be seen from Tab. 4 that the scatter in the TF relations in the present study ( mag) is also significantly higher compared to that obtained for the Ursa major group and for other nearby groups and clusters.
The larger scatter in the TF relations for the Eridanus galaxies in various studies including those based on the near-infrared data indicate that there are variations in the distances to the galaxies in the group. If the additional scatter in the TF relation is attributed to the depth of the group then it indicates that the depth of the Eridanus group can be as large as 4 Mpc. Perhaps, it is tied up with the dynamical stage of the Eridanus group where galaxies or small groups are being accreted from outer regions (Willmer et al. 1989).
6.2 Baryonic TF relation
The baryonic TF relations are constructed using the combined H i and Helium gas mass, and the stellar mass obtained using the stellar luminosities in different bands and their corresponding M∗/L ratios from the spectrophotometric population synthesis models of Bell & de Jong (2001). These models predict a linear relationship between the colors of galaxies and the M∗/L ratio for a band. These models allow the estimation of the total stellar mass from the stellar luminosity in any wave-band provided the colors of galaxies are known. For the current study, the total stellar masses are estimated using the (R–J) colors. The Helium mass is taken as 1.32 times the H i mass. Since the molecular and the ionized gas masses are unknown, the baryonic masses thus obtained are lower limits. The baryonic TF relations are plotted in Fig. 3.
If the TF relations were truly a correlation between the baryonic mass and the rotation velocity, and the models of Bell & de Jong (2001) make accurate predictions of M∗/L for each band, the baryonic TF slope should be independent of pass-band. A nearly pass-band independent baryonic TF relation is obtained in the R, J, H, and K bands as indicated in Fig. 3 and Tab. 4. The slope of the Baryonic TF relation is in the range .
McGaugh et al. (2000) obtained a slope of for a sample of galaxies with rotation velocities over a large range ( km s-1 ). Using data from Verheijen (2001), Bell & de Jong (2001) obtained a slope of for the Ursa-major group of galaxies. The slope of the baryonic TF relation is predicted to be for non-baryonic dark matter (Navarro & Steinmetz 2000) and for the collisional baryonic dark matter (Walker 1999). It is worth mentioning here that all these observational baryonic TF relation (including the present one) do not include the molecular and the ionized gas masses. These mass components will be significant for dwarfs and gas rich low surface brightness (LSB) galaxies, whose rotation velocities are lower compared (typically ) to that for high surface brightness (HSB) galaxies. The inclusion of the molecular and the ionized gas masses to the total baryonic mass in a sample having all types (dwarfs, LSB and HSB) of galaxies will make the slope of the baryonic TF relations shallow. Further, the M∗/L ratios in the models of Bell & de Jong (2001) were calibrated assuming that the galactic disks are supported mainly by rotation. If this is not the case, the baryonic TF relation will be even shallower. We believe that with uncertainties in these analyses and the incomplete information about the total baryonic mass in galaxies, currently no dark matter model can be ruled out based on the baryonic TF relation.
| Band | Slope | Intercept | Scatter |
| Classical TF | |||
| R | 0.52 mag | ||
| J | 0.88 mag | ||
| H | 1.10 mag | ||
| K | 0.76 mag | ||
| Baryonic TF | |||
| R | 0.19 | ||
| J | 0.18 | ||
| H | 0.18 | ||
| K | 0.16 | ||
| Note: The scatter is the reduced chi-square value of the fit. | |||


7 Conclusions
-
•
The TF slopes in the Eridanus galaxies are consistent with those obtained in other studies of nearby groups and clusters. The slopes of the TF relations (absolute magnitude logVflat) for the galaxies in the Eridanus group are , , , and in the R, J, H, and K bands respectively.
-
•
The TF relation for the Eridanus group has a significantly larger scatter ( mag) compared to that for other groups and clusters ( mag).
-
•
If the larger scatter in the TF relations indicates variations in the distances to galaxies in a sample, the maximum difference in the distances to galaxies in the Eridanus group will be Mpc. This implies that the galaxies in the Eridanus group are more dispersed in space compared to other groups and clusters. It is suspected that we arr looking down a filament.
-
•
The value of the index () of the baryonic TF relation is in the range .
Acknowledgments
We thank Shashi Pandey and Ram Sagar for the help provided during the optical observations from Nainital. 2MASS data obtained as part of the Two Micron All Sky Survey (2MASS), a joint project of the University of Massachusetts and the Infrared Processing and Analysis Center/California Institute of Technology, funded by the National Aeronautics and Space Administration and the National Science Foundation.
Appendix-I
| Galaxy | Type | F | r | r(25) | m26 | mtotal | |
|---|---|---|---|---|---|---|---|
| P.A. | r(21) | m21 | |||||
| Incl. | r(20.5) | m20.5 | |||||
| r(B25) | r(20) | m20 | |||||
| (kpc) | (kpc) | (kpc) | (mag arcsec-2) | (mag) | (mag) | ||
| E 482-005 | SBdm | R | – | – | – | – | |
| 79 0 | J | 1.89 0.10 | 2.5 | 19.51 22.06 0.05 | 15.10 | 14.50 | |
| 85 2 | H | – | – | – | – | – | |
| 5.6 | K | – | – | – | – | – | |
| E 482-035 | SBab | R | 2.20 0.03 | 7.4 | 21.02 21.23 0.02 | 13.19 | 12.94 |
| 4 1 | J | 1.95 0.05 | 3.6 | 18.89 19.39 0.04 | 11.76 | 11.18 | |
| 52 1 | H | 1.61 0.08 | 3.6 | 18.13 18.64 0.08 | 11.18 | 10.72 | |
| 4.4 | K | 1.96 0.12 | 3.4 | 18.14 18.65 0.09 | 11.03 | 10.35 | |
| E 548-021 | SBdm | R | – | – | – | – | – |
| 70 1 | J | 4.71 0.20 | 5.6 | 19.40 23.01 0.02 | 14.12 | 13.33 | |
| 88 0 | H | 3.37 0.23 | 4.5 | 18.86 22.48 0.05 | 14.15 | 13.62 | |
| 6.7 | K | 3.71 0.34 | 4.5 | 18.43 22.06 0.06 | 13.68 | 12.81 | |
| E 548-065 | SBa | R | 1.77 0.01 | 5.8 | 21.34 22.11 0.01 | 15.31 | 14.85 |
| 41 0 | J | 1.74 0.10 | 2.2 | 18.99 20.78 0.05 | 13.98 | 13.51 | |
| 80 1 | H | – | – | – | – | – | |
| 5.0 | K | – | – | – | – | – | |
| E 549-002 | IBm | R | 1.51 0.03 | 4.5 | 21.79 21.88 0.03 | 14.73 | 14.34 |
| 32 1 | J | 1.08 0.15 | 1.3 | 19.42 19.91 0.21 | 14.28 | 13.48 | |
| 53 1 | H | – | – | – | – | – | |
| 4.4 | K | – | – | – | – | – | |
| I 1952 | SBbc | R | 3.52 0.06 | 11.2 | 20.21 21.21 0.02 | 13.05 | 12.42 |
| 140 0 | J | 3.60 0.04 | 9.0 | 17.88 19.91 0.01 | 10.78 | 10.26 | |
| 81 0 | H | 3.46 0.06 | 9.0 | 17.17 19.22 0.02 | 10.15 | 9.72 | |
| 8.7 | K | 3.49 0.07 | 7.8 | 16.92 18.97 0.02 | 9.98 | 9.62 | |
| I 1953 | SBd | R | 4.20 0.11 | 12.1 | 21.08 21.26 0.03 | 11.95 | 11.62 |
| 121 0 | J | 3.78 0.10 | 7.4 | 19.03 19.50 0.03 | 10.39 | 9.68 | |
| 51 1 | H | 3.78 0.07 | 7.6 | 18.42 18.90 0.02 | 9.75 | 9.13 | |
| 9.4 | K | 4.19 0.13 | 7.2 | 18.22 18.70 0.03 | 9.51 | 8.77 |
| I 1962 | SBdm | R | 2.77 0.05 | 9.2 | 21.64 22.54 0.02 | 14.62 | 14.16 |
|---|---|---|---|---|---|---|---|
| 1 1 | J | 2.06 0.14 | 2.5 | 19.70 21.56 0.07 | 14.45 | 13.57 | |
| 80 2 | H | 1.76 0.21 | 2.0 | 19.29 21.16 0.14 | 14.44 | 13.60 | |
| 9.1 | K | 1.68 0.18 | 2.7 | 18.32 20.19 0.13 | 13.19 | 12.40 | |
| M-03-10-041 | SBdm | R | 2.67 0.08 | 6.9 | 21.81 22.09 0.04 | 13.99 | 13.56 |
| 166 1 | J | 3.13 0.28 | 2.0 | 20.14 20.93 0.10 | 13.54 | 11.89 | |
| 63 1 | H | 2.68 0.26 | 2.7 | 19.36 20.17 0.12 | 12.59 | 11.37 | |
| 6.7 | K | 2.36 0.29 | 2.0 | 18.95 19.77 0.16 | 12.63 | 11.26 | |
| N 1325 | SAbc | R | 4.93 0.03 | 19.3 | 20.45 21.14 0.01 | 11.75 | 11.12 |
| 53 1 | J | 4.60 0.06 | 11.7 | 18.04 19.46 0.01 | 9.74 | 9.17 | |
| 75 0 | H | 4.51 0.09 | 12.3 | 17.36 18.78 0.03 | 9.06 | 8.63 | |
| 15.8 | K | 4.61 0.09 | 10.8 | 17.13 18.56 0.02 | 8.88 | 8.48 | |
| N 1371 | SABa | R | 3.55 0.02 | 17.2 | 20.22 20.38 0.01 | 10.98 | 10.69 |
| 134 1 | J | 3.34 0.02 | 10.3 | 17.65 18.07 0.01 | 8.75 | 8.42 | |
| 48 1 | H | 3.28 0.02 | 10.8 | 16.96 17.38 0.01 | 8.06 | 7.81 | |
| 18.8 | K | 3.37 0.04 | 9.6 | 16.76 17.19 0.01 | 7.87 | 7.60 | |
| N 1385 | SBcd | R | 3.32 0.04 | 15.2 | 20.20 20.42 0.02 | 11.14 | 10.84 |
| 173 1 | J | 3.21 0.10 | 8.7 | 18.10 18.60 0.05 | 9.43 | 9.02 | |
| 51 1 | H | 3.16 0.10 | 9.2 | 17.39 17.89 0.05 | 8.72 | 8.40 | |
| 11.4 | K | 2.98 0.11 | 8.1 | 17.13 17.64 0.07 | 8.60 | 8.26 | |
| N 1414 | SBbc | R | 1.88 0.04 | 5.6 | 21.16 22.07 0.02 | 15.18 | 14.86 |
| 170 1 | J | 1.96 0.06 | 3.8 | 18.69 20.55 0.03 | 12.95 | 12.54 | |
| 80 1 | H | 1.57 0.04 | 4.0 | 17.85 19.72 0.04 | 12.37 | 12.13 | |
| 5.8 | K | 1.81 0.07 | 3.4 | 17.73 19.60 0.04 | 12.23 | 11.71 | |
| N 1422 | SBab | R | 2.32 0.03 | 9.2 | 20.90 21.80 0.02 | 14.30 | 13.86 |
| 66 0 | J | 2.44 0.03 | 5.8 | 18.29 20.12 0.01 | 11.87 | 11.43 | |
| 80 1 | H | 2.12 0.05 | 5.8 | 17.38 19.22 0.03 | 11.15 | 10.85 | |
| 7.4 | K | 1.84 0.03 | 5.4 | 16.94 18.79 0.02 | 10.98 | 10.65 | |
| S 0321.2-1929 | IBm | R | 2.10 0.20 | 0.2 | 24.79 24.83 0.065 | 17.99 | 16.76 |
| 170 0 | J | – | – | – | – | – | |
| 36 6 | H | – | – | – | – | – | |
| 4.4 | K | – | – | – | – | – |
| U 068 | SABcdm | R | 2.06 0.05 | 5.2 | 22.41 22.45 0.03 | 14.53 | 14.24 |
| 42 1 | J | 1.29 0.12 | 1.3 | 19.58 19.80 0.13 | 13.84 | 12.90 | |
| 38 3 | H | 1.43 0.22 | 1.3 | 19.27 19.51 0.20 | 13.75 | 12.66 | |
| 5.7 | K | 1.08 0.16 | 1.3 | 18.55 18.79 0.24 | 13.08 | 12.15 | |
| U 077 | SBdm | R | 2.42 0.05 | 6.0 | 22.52 22.83 0.02 | 14.97 | 14.51 |
| 138 1 | J | – | – | – | – | – | |
| 64 1 | H | – | – | – | – | – | |
| 5.7 | K | – | – | – | – | – | |
| Notes: Column 1: The name of the galaxy in an abbreviated format. The ESO galaxies are written as E, NGC is written as N, UGCA is written as U, IC is written as I, MCG is written as M, and SGC is written as S. Column 2: The morphological type, position angle and inclination with associated errors in the estimation determined from the R band observations or from DSS images when R band observations were not available, radius in kpc at 25 mag arcsec-2 B band isophote taken from RC3. The P.A. is measured from North to East (counter-clockwise). Column 3: The filter/band. Column 4&5: The disk scale length and associated errors in the fitting procedure in units of kpc. Column 6: The radius in kpc corresponding to the isophotal level of 25 mag arcsec-2 in the R, 21 mag arcsec-2 in the J, 20.5 mag arcsec-2 in the H, and 20 mag arcsec-2 in the K band. Column 7,8,&9: The central surface brightness of the disk as obtained from the fit, and the values corrected for the inclination, Galactic extinction, and internal extinction. The error is obtained from the fitting procedure and does not include calibration errors. Column 10: The isophotal magnitude of the galaxy estimated within the fixed aperture at 26.0 mag arcsec-2 for the R-band, mag arcsec-2 in the J band, mag arcsec-2 in the H band, and mag arcsec-2 in the K band. Column 11: The total magnitude extrapolated to infinity with corrections for Galactic and internal extinctions. | |||||||
References
- [1] Balkowski, C., Bottinelli, L., Chamaraux, P., Gouguenheim, L., & Heidmann, J. 1974, Astron. Astrophys., 34, 43
- [2] Bamford, S.P. 2002, astro-ph/0210227
- [3] Bell, E.F., & De Jong, R.S. 2001, Astrophys. J., 550, 212
- [4] Bernstein, G.M., Guhathakurta, P., & Raychaudhury, S. et al. 1994, Astron. J., 107, 1962
- [5] Giovanelli, R., Haynes, M. P., Herter, T., Vogt, N. P., da Costa, L. N., Freudling, W., Salzer, J. J., Wegner, G. 1997, Astron. J. , 113, 53
- [6] Jarrett, T. H., Chester, T., Cutri, R., Schneider, S., Skrutskie, M., & Huchra, J. P. 2000, Astron. J. , 119, 2498
- [7] Landolt A.U. 1992, Astron. J.. 104, 340
- [8] Masters K.L., Giovanelli, R., & Haynes, M.P. 2003, Astron. J. , 126, 158
- [9] McGaugh, S. S., Schombert, J. M., Bothun, G. D., & de Blok, W. J. G.,2000, Astrophys. J. Letter, 533, 99
- [10] Navarro, J.F., & Steinmetz, M. 2000, Astrophys. J., 538, 477
- [11] Omar A. 2004, Ph.D. thesis, Jawaharlal Nehru University, Delhi.
- [12] Omar, A. & Dwarakanath, K.S. 2005, J. Astrophys. Astron., 26, 1
- [13] Persic, M., Salucci, O., & Stel, F. 1996, Mon. Not. R. Astron. Soc., 281, 27
- [14] Roberts, M.S. 1969, Astron. J. , 74, 859
- [15] Rogstad, , D.H., & Shostak, G. S. 1972, Astrophys. J., 176, 315
- [16] Rubin, V. C., Burstein, D., Ford, W. K., Jr.; Thonnard, N. 1985, Astrophys. J., 289, 81
- [17] Schlegel, D.J., Finkbeiner, D.P., & Davis, M. 1998 Astrophys. J., 500, 525
- [18] Shostak, G. S. 1975, Astrophys. J., 198, 527
- [19] Tully, R. B., & Fisher, J. R. 1977, Astron. Astrophys., 54, 661
- [20] Tully, R.B., & Fouque, P. 1985, Astrophys. J. Suppl., 58, 67
- [21] Tully, R.B., Pierce, M.J., Huang, Jia-Sheng et al. 1998 Astron. J., 115, 2264
- [22] Tully, R.B., Verheijen, M.A.W., Pierce, M.J. et al. 1996 Astron. J., 112, 2471
- [23] van den Bosch, F.C. 2000, Astrophys. J., 530, 177
- [24] Verheijen, M.A.W. 2001, Astrophys. J., 563, 694
- [25] Walker, M. A. 1999, Mon. Not. R. Astron. Soc., 308, 551
- [26] Willmer, C.N.A., Focardi, P., da Costa, L.N., & Pellegrini, P.S. 1989, Astron. J., 98, 1531