The merger rate of massive galaxies
Abstract
We calculate the projected two point correlation function for samples of luminous and massive galaxies in the COMBO-17 photometric redshift survey, focusing particularly on the amplitude of the correlation function at small projected radii and exploring the constraints such measurements can place on the galaxy merger rate. For nearly volume-limited samples with , we find that 41% of luminous galaxies are in close physical pairs (with real space separation of proper kpc). The corresponding fraction for massive galaxies with is 51%. Incorporating close pair fractions from the literature, the 2dFGRS and the SDSS, we find a fairly rapid evolution of the merger fraction of massive galaxies between and the present day. Assuming that the major merger timescale is of order the dynamical timescale for close massive galaxy pairs, we tentatively infer that % (70%) of all galaxies with present-day masses (remnants of mergers between galaxies with ) have undergone a major merger since : major mergers between massive galaxies are a significant driver of galaxy evolution over the last eight billion years.
1 Introduction
Galaxy mergers are ubiquitous in a hierarchical universe, and are predicted to be an important mode of galaxy growth, particularly at early times in cosmic history (e.g., Kereš et al., 2003; Maller et al., 2006). Mergers may be an important feature of the growth of massive early-type galaxies (e.g., Toomre & Toomre, 1972; Barnes & Hernquist, 1996; Khochfar & Burkert, 2003; van Dokkum, 2005; Naab, Khochfar, & Burkert, 2006; Bell et al., 2006). It is possible that mergers may also be an important driver of disk galaxy evolution: gas-rich mergers may conserve enough angular momentum to form a disk (Robertson et al., 2004). The non-circular gas motions induced by the rapidly-changing potential may drive gas inflows, igniting intense star formation (see, e.g., Sanders & Mirabel, 1996, for a review), feeding pre-existing supermassive black holes, enhancing AGN activity, and perhaps even driving a galaxy-scale superwind, evacuating the galaxy of gas (Springel, di Matteo, & Hernquist, 2005; di Matteo, Springel, & Hernquist, 2005).
Despite their importance, it has proven challenging to measure the rate of major galaxy merging, and its evolution with cosmic epoch. The measurement of the galaxy interaction rate by counting the incidence of strongly-disturbed galaxies (with strong asymmetries, double nuclei, or prominent tidal tails) has provided important constraints on merger rate (e.g., Le Fèvre et al., 2000; Conselice et al., 2003, 2005; Lotz et al., 2006), but suffers from uncertainties: minor gas-rich interactions may produce much more spectacular results than a major merger between two spheroid-dominated galaxies, and the timescales over which merger signatures are visible is highly dependent on orbits, gas content, and mass ratio. Another powerful method for exploring the galaxy merger rate is to measure the incidence of close pairs of galaxies: it allows access to the properties of the progenitors (and therefore, e.g., stellar mass ratio of the merger), is straightforward to quantitatively measure, and can be modeled using current generations of galaxy formation models. Yet, this has proven to be a reasonably challenging endeavor: contamination by projection, luminosity boosts by interaction-induced star formation, and small number statistics are significant challenges and are not easily circumvented.
In this paper, we present our first attempt at addressing this issue using the COMBO-17 photometric redshift survey (§2). This analysis uses a large sample, attempts to correct the close pair fraction estimates for projection, and incorporates stellar mass estimates, making it highly complementary to other important recent attempts at measuring the evolution of close pair fraction (e.g., Patton et al., 2002; Lin et al., 2004). We split the problem into two aspects. Firstly, we measure the fraction of galaxies in kpc separation pairs (in real space) through analysis of the projected correlation function of galaxies from COMBO-17 (§3). This is a well-understood and well-posed problem, with a clear and well-constrained outcome (§4). We subsequently use estimates of merger timescale to explore implications for the merger rate of galaxies: inasmuch as this part of the analysis makes use of somewhat uncertain merger timescales and assumes that all real space close pairs will merge, this part of the analysis is much less robust (§5). Throughout, we assume , , and km s-1 Mpc-1.
2 The Data
To date, COMBO-17 has surveyed three disjoint southern and equatorial fields to deep limits in 5 broad and 12 medium passbands. Using these deep data in conjunction with non-evolving galaxy, star, and AGN template spectra, objects are classified and redshifts assigned for % of the objects to a limit of . Typical galaxy redshift accuracy is (Wolf et al., 2004), allowing construction of mag accurate rest-frame colors and absolute magnitudes (accounting for distance and -correction uncertainties). Astrometric accuracy is ″. Owing to reduced depth close to the edges of the fields, we discard galaxies from the image edge.
As we are concerned with the clustering of galaxies on small angular scales, we have tested how the detection of galaxies by COMBO-17 is affected by having a nearby luminous neighbor. We extracted the images of 400 isolated massive galaxies (galaxies which were included in our sample) in the COMBO-17 image of the Extended Chandra Deep South, and placed these postage stamps of real massive galaxies with a distance from another massive galaxy. We then put this modified image through the COMBO-17 object detection pipeline, allowing us to determine the fraction of these inserted massive galaxies which were recovered by COMBO-17’s pipeline as a function of distance from the primary galaxy. We found that the detection fraction was independent of distance at ; only at (corresponding to kpc at the redshift of interest) was there evidence for substantial incompleteness in object recovery. Accordingly, we do not use information from pairs with separations kpc in what follows.
Borch et al. (2006) estimated the stellar mass of galaxies in COMBO-17 using the 17-passband photometry in conjunction with a non-evolving template library derived using the Pégase stellar population model (see Fioc & Rocca-Volmerange, 1997, for a description of an earlier version of the model). The masses were derived using a Kroupa et al. (1993) stellar IMF; the use of a Kroupa (2001) or Chabrier (2003) IMF would have yielded similar stellar masses, to within %. The redder templates have smoothly-varying exponentially-declining star formation episodes and a low-level constant star formation rate; the bluer templates have a recent burst of star formation superimposed (thus, ongoing tidally-induced bursts of star formation are approximately accounted for). Such masses are quantitatively consistent with those derived using a simple color-stellar M/L relation (Bell et al., 2003), and comparison of stellar and dynamical masses for a few early-type galaxies yielded consistent results to within their combined errors (see Borch et al., 2006, for more details). Random stellar mass errors are dex on a galaxy-by-galaxy basis, and systematic errors in the stellar masses (setting the overall mass scale and its redshift evolution) were argued to be at the 0.1 dex level.
3 The Method
As stated in the introduction, our goal is to estimate as accurately as possible the fraction of galaxies which have a companion satisfying our selection criteria within a certain physical distance. The accuracy of photometric redshifts is clearly insufficient to directly estimate the redshift space correlation function of galaxies directly: COMBO-17’s typical redshift error translates into Mpc along the line-of-sight. Consequently, we separate this problem into two parts: construction of a projected correlation function, and subsequent de-projection of this correlation function into a real-space correlation function.
3.1 Estimating the projected correlation function
As a first step, we calculate the projected two-point correlation function of galaxies (Davis & Peebles, 1983). The projected correlation function is the integral of the real space correlation function along the line of sight:
| (1) |
where is the transverse distance between two galaxies and is their line-of-sight separation. It is clear that traditional close pair counts are an integral over small projected radii of the projected two-point correlation function for galaxies with particular properties, multiplied by the space density of such galaxies.
In practice, we estimate for various samples of galaxies using the following scheme. We construct a histogram of the number of galaxy pairs with given properties (as defined later in §4) and as a function of projected physical separation, and for a randomly-distributed mock galaxy sample. The mock samples were generated from the real data by bootstrapping the data multiple times, assigning random positions and fields, and applying a small Gaussian redshift offset (). Masks defining the field edges and the areas around bright stars were applied in the same manner to the data and random fields. Projected auto-correlations were estimated from these histograms by constructing the ratio , where is the path length being integrated over, DD is the histogram of separations between real galaxies and RR is the histogram of separations of mock catalog galaxies. Other formulations ( and , where DR is the histogram of separations of real and mock galaxies) were verified to be equivalent to within the errors.
One will see that, in order to preserve S/N, we did not integrate along the entire line of sight in calculating , rather along in redshift path length from the galaxy of interest. Therefore, we must correct our estimate of to account for pairs missed because their photometric redshift errors took them erroneously out of the redshift range being integrated over. Extensive comparison with spectroscopic redshifts (Wolf et al., 2004) has shown that a Gaussian with the following -band apparent magnitude-dependent width is an adequate representation of the photometric redshift errors: . The average for the galaxy sample of interest was evaluated, and the redshift difference distribution of galaxy pairs was taken to be described by a Gaussian with width . Accordingly, the fraction of genuine galaxy pairs included in the sample is:
| (2) |
(i.e. the fraction missed was ). The estimate of was then multiplied by to account for the missing pairs, a correction of % in all cases. No correction for the integral constraint was applied: Phleps et al. (2006) show in their §4.4 that such corrections are Mpc in for luminous/massive galaxies in COMBO-17, which given our focus on the strongly correlated smallest scales is a % correction.
3.2 Estimating the real space correlation function
Assuming that the real-space and projected correlation functions can be adequately fit with power laws, the parameters of the two fits are intimately related. If , then , where Thus, we have adopted the approach of fitting the estimated from the data as a function of projected radius, then using the above relations to estimate and . It is also possible to directly estimate from using the Abel integral (Davis & Peebles, 1983): we choose not to adopt this method by default in this work because the direct inversion is rather noise-sensitive, and because we are interested in very close pairs kpc, and some power-law extrapolation of would be necessary at any rate to fill in the closest kpc separations (see above). We have confirmed that in the best-posed cases where the are well-measured that i) the correlation functions are well-parameterized by a power-law, and ii) inverting directly into gives very similar answers to the power-law parameterization.
3.3 Estimating the close pair fraction
Given a good parameterization of the real space correlation function of galaxies on small kpc scales, it is straightforward to define a real space close pair fraction (as discussed by Patton et al., 2000; Masjedi et al., 2006). Recall the definition of the real space correlation function: , where is the probability of a secondary galaxy occupying a volume a distance from the galaxy of interest, and is the space density of the secondary galaxies (equal to the space density of the primary galaxies for an autocorrelation). Therefore, the probability of a galaxy being within a distance of another galaxy satisfying our selection criteria is:
| (3) | |||||
| (4) |
given that at all radii of interest for this paper. Therefore, parameterizing the real-space correlation function as , one obtains:
| (5) |
It is worth noting that because typically , to first order: i.e., that there is roughly an equal contribution of galaxies in each radius bin to the total close pair fraction.
4 Results
| Sample | /Mpc | /Mpc3 | ||
|---|---|---|---|---|
| Auto-correlations | ||||
| (1) | 3.10.5 | 1.930.08 | 0.0162 | 0.040.01 |
| (2) | 3.60.5 | 0.0091 | 0.050.01 | |
| Cross-correlations | ||||
| (3) | 0.0136 | |||
| (4) | 0.0061 | |||
Sample (1) is a luminosity and volume-limited sample with and
Sample (2) is a stellar mass and volume-limited sample with and
Sample (3) has primary galaxies with and ; secondary galaxies must be 1.2 mag fainter or less than their primary galaxy
Sample (4) has primary galaxies with ;
secondary galaxies must be 1/3 or more of their primary galaxy’s mass to be counted as a pair
For samples (3) and (4), the space density of secondary galaxies is
used to determine the pair fraction
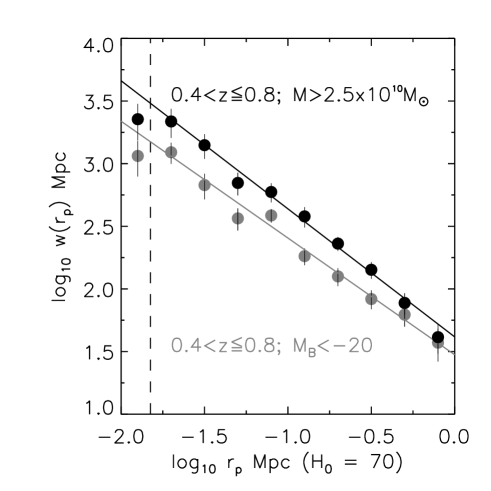
As stated earlier, our goal is to understand the role of merging in driving the evolution of massive galaxies. Therefore, we study the close pair fraction of galaxies selected in two ways: luminous galaxies, and massive galaxies. We restrict the sample to galaxies in the redshift interval . Each sample is % complete across the entire redshift range of interest, forming a nearly volume-limited sample. The auto-correlation function for each sample has been derived using the methods outlined above. A power law is fit to the values for the whole sample, and the close pair fraction derived from this power law fit coupled with the measured number density of galaxies meeting our selection criteria. Error bars in all quantities were derived for each field separately, adopting Monte Carlo errors of 0.1 dex in luminosity/mass and accounting for counting uncertainties in the histogram of real galaxy pairs DD. These were then combined in quadrature and divided by . It is important to note for this paper we have used proper coordinates to calculate the correlation functions and space densities.
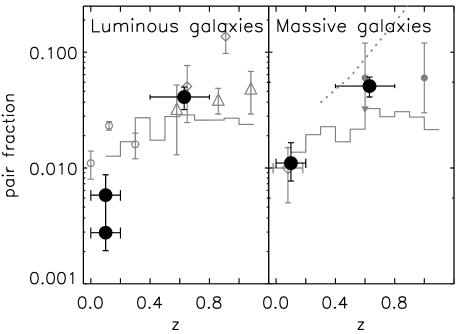
The results are shown in Figs. 1 and 2. One can see that the power-law parameterization to is an acceptable description of the data on sub-Mpc scales, and that is measured with interesting accuracy even to kpc scales (allowing reasonably robust measurement of ); we showed earlier that object detection failed for separations kpc, therefore power law fits to are determined only for , and are extrapolated inwards. The resulting close pair fractions , adopting proper kpc, are shown in Fig. 2.
Many previous studies have attempted to estimate the major merger rate, i.e., the rate of galaxies merging with galaxies with mass ratios between 1:1 and 3:1. Accordingly, we have also estimated the cross-correlations between galaxies in our sample and potential major merger partners: for the luminous galaxy samples, between galaxies and galaxies between and mag fainter than the primary galaxy; and for the massive galaxy samples between galaxies and galaxies with between and the same mass as the primary. The samples are close to volume limited in each case; the faintest red sequence galaxies are missing at in the secondaries (the blue cloud secondary galaxies are complete at all redshifts), leading to a % incompleteness in the secondary sample; we do not correct for this incompleteness. The number density of secondary galaxies is not trivial to calculate as each primary galaxy has a different set of secondary galaxies. We estimated the ‘characteristic’ number density of secondary galaxies by evaluating the number density of potential secondary galaxies for each primary galaxy, and then averaging these number densities. The cross-correlation parameters are very similar to those for the autocorrelations, with the modest differences between the values of for the auto- and cross-correlations driven by the differences in the number densities. We give parameters of power-law fits to the estimates in Table 1.
5 Discussion

5.1 Comparison with local pair fractions derived using the same method
Using published studies, one can use the methodology presented in this paper to estimate the local pair fraction. For luminous galaxies, we use results from the Two degree Field Galaxy Redshift Survey (2dFGRS; Colless et al. 2001). Norberg et al. (2002a) presented the two-point correlation function for galaxies with (corresponding to adopting from Norberg et al. and converting to ). The values of and are Mpc and respectively, and were defined only outside 100 kpc; the inwards extrapolation required for this analysis is unconstrained and therefore this estimate should be regarded with due caution. Adopting the luminosity function from Norberg et al. (2002a), a density of galaxies with of 0.0019(2) Mpc-3 was derived, giving a pair fraction estimate of 0.003(1). An unavoidable complication is that of the fading of galaxies towards lower redshift as their stellar populations fade; thus, a sample of somewhat fainter galaxies at lower redshift may be a better conceptual match to the population of distant galaxies. Adopting a somewhat fainter cut of (corresponding to 1 mag fading per unit redshift in the rest-frame B-band), one derives instead a largely unchanged clustering signal (Norberg et al., 2002a), a larger density of 0.0039(4) Mpc-3, and a larger pair fraction of 0.006(2). Two points become clear: two-point correlation function parameters are substantially less sensitive to limiting depth than the number density or close pair fraction; and, the fading of stellar populations is a considerable complicating factor in studying the evolution of close pair statistics for luminosity-selected samples.
Stellar mass-limited samples largely overcome the last of these two challenges. A large number of galaxies in the main galaxy sample of the Sloan Digital Sky Survey (SDSS; York et al., 2000) have estimates of their stellar mass. We use the two-point correlation function of mass-limited samples (Li et al., 2006) and the space density of massive galaxies (Bell et al., 2003). Rough fits to Li et al.’s and samples gave correlation function parameters and : given a number density of galaxies of 0.0040(4) galaxies/Mpc3 from the SDSS stellar mass function of Bell et al. (2003), we estimate a . Again, the correlation function was defined only outside 100 kpc; for both the SDSS and the 2dFGRS a direct redetermination of the pair fractions from the data would be preferred to these rough estimates. The average redshift of the galaxy samples in both cases is .
These estimates are included in Fig. 2 as the estimates. It is worth noting in both cases that there is clear evidence for a dramatically-reduced fraction of galaxies in close ( kpc separation) physical pairs at the present day, compared to the pair fraction at . This will be discussed in more detail later.
5.2 The relationship between true close pairs and projected close pairs
In order to compare our measurements to others in the literature, it is necessary to explore the relationship between the fraction of galaxies in real space close pairs and the projected close pair galaxy fraction. The projected space close pair fraction is the real space close pair fraction plus a contribution from more distant galaxies along the line of sight111It is worth remembering that the projection of very distant fore- and background galaxies has been automatically removed when calculating .. Specifically, the projected close pair fraction:
| (6) |
following previous notation. In our particular case, kpc, and using the observed luminous/massive galaxy correlation functions and number densities as input, we find that 65% of projected close luminous pairs have real space separations kpc; the corresponding fraction for massive galaxies is 69%. It is important to note that this ‘contamination’ is with galaxies which are correlated with the host (i.e., those which are primarily nearby with ), and would likely have very similar redshifts to the primary galaxy (i.e., much of contamination is suffered by spectroscopic close pair samples). It is important to note that the exact fraction depends on the detailed form of the correlation function and should not be blindly adopted by workers using rather different sample cuts: in particular, our estimate is slightly higher than the estimate of % from Patton et al. (2000), which was derived using a very similar approach with a less clustered lower-luminosity parent sample.
5.3 Comparison with published merger fraction determinations
In Fig. 3, we have attempted to show close pair or merger fractions from a variety of published works, to compare with our determinations. Such an exercise is not trivial, as very different methods were used in many cases.
5.3.1 The sample
The vast majority of previous determinations of close pair fractions have been derived for luminous galaxies. At , we show results for Patton et al. (2002) and de Propris et al. (2005) as open circles. Patton et al. (2002) adopts a radius range kpc; adopting km s-1 Mpc-1 this becomes kpc (i.e., some 1/4 of the galaxy pairs are not counted). Patton et al.’s default magnitude range is ; corresponding to for km s-1 Mpc-1. Using their table 3, one can convert their results to a narrower range in absolute magnitude , or in our units, by dividing by 2.5. Accordingly, we adjust Patton et al.’s values upwards by 4/3 (to account for kpc pairs) and downwards by a factor of 2.5 (to account for the magnitude range). de Propris et al. (2005) adopt a magnitude range of , corresponding to for our choice of , thus the only correction applied is 4/3, to account for missed kpc pairs.
At , we show the fraction of galaxies in close pairs with kpc separation (their kpc values) taken from Le Fèvre et al. (2000, open diamonds); we have adjusted the values downwards to 65% of their original values to account for projection within galaxy groups (as discussed above, as opposed to projection of random galaxies along the line of sight, which Le Fèvre et al. corrected for already). We do not show values from Bundy et al. (2004), whose optical pair statistics agree well with Le Fèvre et al.’s values but who argue (based on near-infrared data) that many of the apparently luminous pairs are in fact minor mergers which have been boosted in rest-frame -band luminosity by enhanced star formation222We address this source of concern through the analysis of the stellar mass-limited sample, but find a roughly equal pair fraction. On one hand, many pairs of luminous galaxies are indeed minor mergers by mass; yet, on the other hand, there are a large number of red and lower-luminosity galaxies which are missed by the luminous galaxy criterion which make it into a mass-limited sample. . We attempt also to include the estimates of Lin et al. (2004). They adopt km s-1 Mpc-1 for the purposes of quoting -corrected magnitudes, thus their evolution-corrected sample corresponds roughly to , remembering that the evolution correction is roughly 1 magnitude per unit redshift. They quote their pair fractions in terms of (L. Lin, 2006, priv. comm.) thus their bin corresponds to kpc adopting our . Since we find that , their 27 kpc of coverage for their pair fraction should be approximately equal to the which we would calculate within 30 kpc. We do, however, apply a correction of 0.65 to their measurements, to account for projection at small radii (following §5.2). It is clear that the COMBO-17 estimate is quantitatively consistent with these estimates, to within the combined uncertainties, with the advantage of robust projection correction, a volume-limited galaxy sample, large sample size, and therefore highly competitive errors.
Owing to the difficulty in extracting the properties of progenitors from a morphologically-classified ongoing merger, we elect not to compare explicitly with morphologically-derived merger fractions from Le Fèvre et al. (2000), Conselice et al. (2003), Cassata et al. (2005), and Lotz et al. (2006). Lotz et al. (2006) compare their merger fractions to the other morphological studies, finding consistent results to within their combined error bars. They further compare their results with Lin et al.’s and Patton et al.’s results for pair fraction evolution, finding overall consistency in both the inferred zero point and redshift evolution.
5.3.2 The sample
To the best of our knowledge, there is only one published estimate of the massive galaxy merger fraction at intermediate redshift, for galaxies from Conselice et al. (2003). This estimate is of limited applicability: not only is the mass limit substantially lower, but it is derived from ongoing mergers, making it almost impossible to fairly compare with our pair-based estimate. Furthermore, the small sample size weakens their constraints on the merger fraction; in particular, they can only place an upper limit at intermediate redshift. Nonetheless, their constraints are consistent with ours, to within the combined uncertainties.
Xu, Sun & He (2004) presented an analysis of -selected galaxy pairs taken from a combined 2MASS/2dFGRS sample (Cole et al., 2001). Converting their results to our value of and stellar IMF, extrapolating their kpc results to kpc, and accounting for the % contamination of their pair sample with ‘group interlopers’, we find a pair fraction of for galaxies with , in excellent agreement with the SDSS determination.
5.4 The relationship between close pair fraction and merger fraction
In order to compare with galaxy formation models and to explore the implications of these and other close pair fraction determinations for galaxy merger rate, it is important to discuss the relationship between galaxy close pair fraction and merger fraction (see, e.g., Lotz et al., 2006, for a recent discussion).
Let us, for the sake of argument, take the case of galaxy mass limited samples. In this work, we derive the close pair fraction , where is the number of galaxies in pairs with , and is the number of massive galaxies, per given volume. If one wanted to relate this close pair fraction to a merger fraction, i.e., the fraction of galaxies which have been created by mergers of galaxies in the pair sample, one notes that i) two galaxies in pairs merge into one merger remnant, ii) the merger remnants are higher mass, and iii) the timescales of being a recognizable merger remnant may differ from the close pair timescale. In this example above, the merger fraction most directly related to the above close pair fraction is: ; i.e., the number of newly-created merger remnants with (the remnants of mergers between galaxies with ) divided by the number density of galaxies. The number of pairs should be then be related to the number of newly-created remnants: where is the ratio of the timescales over which a pair enters one’s close pair sample vs. the timescale over which a merger remnant is recognizably disturbed, and the factor of two accounts for the fact that a galaxy pair merges to form a single remnant.
Let us make this example more concrete.
| (7) | |||||
| (8) | |||||
| (9) |
where is the ratio in number density between galaxies with and . This ratio in this case (as directly measured from the dataset), giving . Thus, the fact that two galaxies in pairs merge to form only a single remnant (entering the numerator of the fractions) is canceled out by the factor of two different number densities (in our particular case) between the pair parent population and the plausible newly-created remnant population (entering in the denominator of the merger fractions). Many previous analyses neglect or underestimate this difference in the number density of the parent population from which the pairs are drawn vs. the number density of the higher mass merger remnants; this is one of the main contributors to our higher inferred merger rate than those estimated by Lin et al. (2004, see §5.6 for further discussion). A similar argument, with similar outcome, applies to the luminous galaxy sample. We will use this argument in what follows.
5.5 Comparison with galaxy formation models
In this section, we compare model major merger remnant fractions with our measurements of close pair fraction (see Berrier et al., 2006, for a detailed discussion of model insights into the meaning and evolution of close pair fraction). In what follows, we adopt = = 0.4 Gyr, following the estimated pair timescale calculated in the next section. Thus, , as the timescales are defined to be equal, as long as we choose to explore the fraction of galaxies recently created in galaxy mergers with and/or .
In both panels of Fig. 3, we show major merger fractions taken from an updated version of the Somerville et al. semi-analytic galaxy formation model (see Somerville & Primack, 1999; Somerville, Primack, & Faber, 2001, for a description of the basic model ingredients). The model includes standard prescriptions for gas cooling, feedback, and dust extinction and star formation. Quiescent star formation is parameterized as in de Lucia et al. (2004), and bursts of star formation are triggered by major and minor mergers, based on results from hydrodynamic simulations of merging galaxies (Cox, 2004). Feedback from AGN is not included in this model, although we found that merger rates calculated from a model including AGN feedback were similar to those presented here. The model reproduces reasonably well the evolution of the luminosity and stellar mass function of galaxies in the interval . This particular model uses Monte Carlo realizations of dark matter merger histories based on the analytic Extended Press-Schechter formalism, supplemented with standard prescriptions for dynamical friction, and therefore we lack detailed information about the spatial location of galaxies within their dark matter halos. As a result, we cannot directly compute close pair fractions from these simulations; rather, we compute the fraction of galaxies which have undergone a recent merger and compare this with the observational estimates.
In the right-hand panel of Fig. 3, we show also the close pair fraction inferred from the merger rates of massive galaxies from a SPH galaxy formation model (Maller et al., 2006, dotted line), under the same timescale and merger vs. pair assumptions as adopted above. Maller et al. (2006) present the fraction of mergers per Gyr for galaxies with with mass ratios less than 2:1 in their Fig. 3: they argue that this is equivalent to a mass cut of , as their model dramatically over-produces stellar mass by a factor of 2.75, and as a stop-gap measure they suggest division of the mass cut by that factor when comparing with data. This mass limit is different from the merger remnant mass limit of ; accordingly, we treat this comparison as more qualitative than quantitative. The merger rates are increased by a factor of 1.7 to transform from 2:1 to a 3:1 threshold (following their Fig. 6). These merger fractions are somewhat higher than observed, and show a steeper redshift dependence than the Somerville et al. model estimates.
Recently, Berrier et al. (2006) discussed the evolution of the close pair fraction of luminous galaxies, finding overall consistency at the factor of two level with the Lin et al. (2004) measurements; given that our measurements are consistent with the measured pair fractions from Lin et al. (2004), we would expect that the model close pair fraction from Berrier et al. (2006) would be reasonably consistent with both our data and the Somerville et al. model.
While important discrepancies remain between different models, different datasets, and between the data and models, it is nonetheless obvious that there is an overall qualitative consistency between our best attempts at observationally constraining the merger/close pair fraction of luminous and massive galaxies and our present understanding of galaxy formation and assembly in a CDM universe. Given that the ongoing assembly of massive galaxies is a key (and unavoidable) feature of galaxy evolution in such a cosmology, it is encouraging that there is a decent qualitative agreement between the models and data at this stage.
5.6 Musings on the merger rate of galaxies
In order to convert close pair fractions into merger rates, a timescale over which a close pair of nearly-equal mass galaxies will merge is required. The estimation of such timescales far from straightforward and is the topic of much ongoing work: the mix of orbital parameters will lead to a distribution of timescales, and the effects of e.g., dynamical friction and fly-bys in dense environments are poorly-understood. Here, for illustrative purposes, we take a highly simplistic approach and assume that the merger of two nearly-equal mass galaxies takes roughly one orbital timescale , noting that the circular velocity of a galaxy is , where is the velocity dispersion of the galaxy in question. This estimate is rather similar to those presented by, e.g., Patton et al. (2002) or Lin et al. (2004), and compares favorably to timescales derived from the Naab, Khochfar, & Burkert (2006) dry galaxy merger simulations. We adopt a typical velocity dispersion of a luminous/massive galaxy of kms-1, and we adopt the typical radius of a galaxy in the kpc sample of kpc. On this basis, we estimate a merger timescale of Gyr; uncertainties in this timescale are at least a factor of two333It is worth noting that if dynamical friction timescale arguments were used, one would derive timescales for kpc of Gyr, following the discussion of dynamical friction in Binney & Tremaine (1987). While it is true that the Chandresekar formulation of dynamical friction should not strictly apply in the case of a merger between two massive galaxies, it is nonetheless encouraging that the orbital timescale and dynamical timescale arguments yield approximately equal timescales.. Recalling that when equal timescales are chosen (from §5.4) and when the pair fraction from lower luminosity/mass samples is related to the merger fraction of the more massive remnant galaxies, the merger rate per Gyr is .
Given this rough estimate for merger rate, one can derive the rate of creation of galaxies with through major mergers using the estimated close pair fractions of galaxies with at from SDSS coupled with the determination from COMBO-17. A power-law fit to these data points yields: , where is the close pair fraction. Using that the creation rate of merger remnants with is , and integrating as a function of cosmic time, one derives an average of galaxy mergers per present-day galaxy since . The corresponding numbers for galaxies with , using all available observational determinations and weighting by the uncertainties, are: , and mergers since . This determination is very similar to the recent determination of Lotz et al. (2006, 0.3-0.7 mergers per luminous galaxy)444Differences between this determination and that of Lin et al. (2004) have a factor of 1.3 contribution from inclusion of our data and that of the 2dFGRS and Le Fèvre et al. (2000), a factor of 2 difference following §5.4, a factor of 1.2 difference in redshift integration method, a factor of 1.25 difference in timescale (our 0.4 Gyr vs. their 0.5 Gyr), and finally a difference of 1.3 from the fraction of their pairs deemed to be real (from our sample we estimated 65% of the pairs are physical; they argued 50% following the low redshift analysis of Patton et al.): in all, a factor of five difference in inferred remnant density would be expected, and indeed our estimate is five times larger than theirs.. While it is clear that improvements in both the observational determination of close pair fraction evolution with redshift and work towards robust estimates of merger timescale are of critical importance, this analysis strongly suggests that galaxy mergers between luminous/massive galaxies are a significant feature of the last eight billion years of galaxy evolution.
References
- Barnes & Hernquist (1996) Barnes, J. E., & Hernquist, L. 1996, ApJ, 471, 115
- Bell et al. (2003) Bell, E. F., McIntosh, D. H., Katz, N., & Weinberg, M. D. 2003, ApJS, 149, 289
- Bell et al. (2006) Bell, E. F., et al. 2006, ApJ, 640, 241
- Berrier et al. (2006) Berrier, J. C., Bullock, J. S., Barton, E. J., Guenther, H. D., Zentner, A. R., & Wechsler, R. H. 2006, submitted to ApJ (astro-ph/0604506)
- Binney & Tremaine (1987) Binney, J., Tremaine, S. 1987, Galactic Dynamics (Princeton, Princeton University Press)
- Borch et al. (2006) Borch, A., Meisenheimer, K., Bell, E. F., Rix, H.-W., Wolf, C., Dye, S., Kleinheinrich, M., & Kovacs, Z. 2006, A&A, 453, 869
- Bundy et al. (2004) Bundy, K., Fukugita, M., Ellis, R. S., Kodama, T., & Conselice, C. J., 2004, ApJ, 601, L123
- Cassata et al. (2005) Cassata, P., et al. 2005, MNRAS, 357, 903
- Chabrier (2003) Chabrier, G. 2003, ApJ, 586, L133
- Cole et al. (2001) Cole, S., et al. 2001, MNRAS, 326, 255
- Colless et al. (2001) Colless, M., et al. 2001, MNRAS, 328, 1039
- Conselice et al. (2003) Conselice, C. J., Bershady, M., Dickinson, M., & Papovich, C. 2003, AJ, 126, 1183
- Conselice et al. (2005) Conselice, C. J., Blackburne, J. A., & Papovich, C. 2005, ApJ, 620, 564
- Cox (2004) Cox, T. J. 2004, Phd thesis, University of California, Santa Cruz, http://physics.ucsc.edu/tj/work/thesis/
- Davis & Peebles (1983) Davis, M., & Peebles, P. J. E. 1983, ApJ, 267, 465
- de Lucia et al. (2004) de Lucia, G., Kauffmann, G., & White, S. D. M. 2004, MNRAS, 349, 1101
- de Propris et al. (2005) de Propris, R., Liske, J., Driver, S. P., Allen, P. D., & Cross, N. J. G. 2005, AJ, 130, 1516
- di Matteo, Springel, & Hernquist (2005) di Matteo, T., Springel, V., & Hernquist, L. 2005, Nature, 433, 604
- Faber et al. (2005) Faber, S. M., et al. 2005, submitted to ApJ (astro-ph/0506044)
- Fioc & Rocca-Volmerange (1997) Fioc, M., & Rocca-Volmerange, B. 1997, A&A, 326, 950
- Kereš et al. (2003) Kereš, D., Katz, N., Weinberg, D. H., & Davé, R. 2005, MNRAS, 363, 2
- Khochfar & Burkert (2003) Khochfar, S., & Burkert, A. 2003, ApJ, 597, L117
- Kroupa (2001) Kroupa, P. 2001, MNRAS, 322, 231
- Kroupa et al. (1993) Kroupa, P., Tout, C. A., & Gilmore, G. 1993, MNRAS, 262, 545
- Le Fèvre et al. (2000) Le Fèvre, et al. 2000, MNRAS, 311, 565
- Li et al. (2006) Li, C., Kauffmann, G., Jing, Y. P., White, S. D. M., Börner, G., & Cheng, F. Z. 2006, MNRAS, 368, 21
- Lin et al. (2004) Lin, L., et al. 2004, ApJ, 617, L9
- Lotz et al. (2006) Lotz, J. M., et al. 2006, submitted to ApJ (astro-ph/0602088)
- Maller et al. (2006) Maller, A. H., Katz, N., Kereš, D., Davé, R., & Weinberg, D. H. 2006, submitted to MNRAS (astro-ph/0509474)
- Masjedi et al. (2006) Masjedi, M., et al. 2006, ApJ, 644, 54
- Naab, Khochfar, & Burkert (2006) Naab, T., Khochfar, S., & Burkert, A. 2006, ApJ, 636, L81
- Norberg et al. (2002a) Norberg, P., et al. 2002a, MNRAS, 332, 827
- Norberg et al. (2002a) Norberg, P., et al. 2002b, MNRAS, 336, 907
- Patton et al. (2000) Patton, D. R., Carlberg, R. G., Marzke, R. O., Pritchet, C. J., da Costa, L. N., & Pellegrini, P. S. 2000, ApJ, 536, 153
- Patton et al. (2002) Patton, D. R., et al. 2002, ApJ, 565, 208
- Phleps et al. (2006) Phleps, S., Peacock, J., Meisenheimer, K., & Wolf, C. 2006, A&A, in press (astro-ph/0506320)
- Robertson et al. (2004) Robertson, B., Yoshida, N., Springel, V., & Hernquist, L. 2004 ApJ, 606, 32
- Sanders & Mirabel (1996) Sanders, D. B., & Mirabel, I. F. 1996, ARA&A, 34, 749
- Somerville & Primack (1999) Somerville, R. S., & Primack, J. R., 1999, MNRAS, 310, 1087
- Somerville, Primack, & Faber (2001) Somerville, R. S., Primack, J. R., & Faber, S. M. 2001, MNRAS, 320, 504
- Springel, di Matteo, & Hernquist (2005) Springel, V., di Matteo, & Hernquist, L. 2005, ApJ, 620, L79
- Toomre & Toomre (1972) Toomre, A., & Toomre, J. 1972, ApJ, 178, 623
- van Dokkum (2005) van Dokkum, P. G. 2005, AJ, 130, 2647
- Wolf et al. (2004) Wolf, C., et al. 2004, A&A, 421, 913
- Xu, Sun & He (2004) Xu, C. K., Sun, Y. C., & He, X. T. 2004, ApJ, 603, L73
- York et al. (2000) York, D., et al. 2000, AJ, 120, 1579