The old anticentre open cluster Berkeley 32: membership and fundamental parameters††thanks: Based on observations made with the Italian Telescopio Nazionale Galileo (TNG) operated on the island of La Palma by the Fundación Galileo Galilei of the INAF (Istituto Nazionale di Astrofisica) at the Spanish Observatorio del Roque de los Muchachos of the Instituto de Astrofisica de Canarias.
Abstract
We have obtained medium-low resolution spectroscopy and CCD imaging of Berkeley 32, an old open cluster which lies in the anticentre direction. From the radial velocities of 48 stars in the cluster direction we found that 31 of them, in crucial evolutionary phases, are probable cluster members, with an average radial velocity of +106.7 ( = 8.5) km s-1.
From isochrone fitting to the colour magnitude diagrams of Berkeley 32 we have obtained an age of 6.3 Gyr, = 12.48 and = 0.10. The best fit is obtained with Z=0.008. A consistent distance, , has been derived from the mean magnitude of red clump stars with confirmed membership; we may assume
The colour magnitude diagram of the nearby field observed to check for field stars contamination looks intriguingly similar to that of the Canis Major overdensity.
keywords:
Open clusters and associations: general – open clusters and associations: individual: Berkeley 32 – Hertzsprung-Russell (HR) diagram1 Introduction
Open clusters (OCs) are an important population of the disc of our Galaxy and may be used to trace its properties (e.g., spiral structure, kinematics, age and age distribution, metallicity, etc; see Friel 1995 for a review). In particular, by studying the old component of the OC population we may be able to trace the disc properties at all epochs since its formation, and to derive its evolution. The number of known – and well studied – old OCs has steadily grown in recent years; what we still miss is a populous sample analyzed in a complete and homogeneous way to derive the cluster properties like membership, age, distance, reddening, and (detailed) chemical abundances using both photometric and low- and high-resolution spectroscopic data.
We have therefore undertaken a project devoted to precise and homogeneous derivation of the fundamental properties of a large and well chosen sample of old open clusters. The goal of our project is to get insight on the formation and chemical enrichment mechanisms of the Galactic disc. A description of the motivations of our program, and a status report of its photometric part are given in Bragaglia & Tosi (2006).
As part of this project, we present here a study of Berkeley 32 (Be 32), an old anticentre open cluster, with coordinates , , and , . We have obtained medium resolution spectra of about 50 stars to derive the membership, as we have recently done for Berkeley 29 (Bragaglia, Held & Tosi, Bragaglia et al.2005), while CCD images are used to derive age, distance, reddening, and approximate metallicity.
The cluster has already been studied by several authors. Scott et al. (1995) obtained low-resolution spectra and measured radial velocities of 14 stars, finding that 10 of them were cluster members and obtaining an average velocity of 101 km s-1, with an error of 10 km s-1. These velocities were adopted also by Friel et al. (2002), who determined metallicities - with an individual error of about 0.1 dex - and found an average [Fe/H] = .
Kaluzny & Mazur (1991) obtained and Washington photometry of Be 32; combining different methods, like the Morphological Age Ratio (see Sect. 3), the comparison to well studied clusters like NGC 188 and M 67, and main sequence fitting, they determined that Be 32 has an age of about 6 Gyr, a metallicity [Fe/H] , reddening = 0.16, and distance modulus . Richtler & Sagar (2001), working with data, reached similar conclusions; they employed isochrone fitting and red clump luminosity to derive an age of 6.3 Gyr, [Fe/H] , = 0.08, and true distance modulus . Finally, Hasegawa et al. (2004) observed Be 32 (that they indicate with the alternative name of Biurakan 8) as part of a survey of 14 anticentre clusters; their photometry is of somewhat lower quality, and results they derive from isochrone fitting and morphological parameter indicators are not in perfect agreement, but they confirm that Be 32 is among the oldest OCs.
The paper is organized as follows: observations and reductions are described in Section 2, the CMDs are presented in Section 3, together with results on isochrone fitting; the radial velocities and memberships are derived in Section 4; a summary can be found in Section 5.
2 Observations and data reduction
| Filter | Date | UT | Exp | Airmass | Seeing |
| (dd mm yy) | (sec) | (″) | |||
| Berkeley 32: , | |||||
| 26 11 2000 | 03:39:38 | 600 | 1.081 | 2.34 | |
| 26 11 2000 | 03:36:59 | 40 | 1.082 | 2.20 | |
| 14 02 2004 | 20:41:59 | 5 | 1.210 | 1.19 | |
| 26 11 2000 | 02:47:20 | 480 | 1.118 | 1.79 | |
| 26 11 2000 | 02:43:45 | 20 | 1.122 | 1.65 | |
| 14 02 2004 | 20:37:08 | 2 | 1.223 | 1.38 | |
| 26 11 2000 | 03:03:45 | 480 | 1.100 | 1.98 | |
| 26 11 2000 | 03:01:26 | 20 | 1.102 | 2.06 | |
| 14 02 2004 | 20:39:33 | 1 | 1.216 | 0.96 | |
| Control field: , | |||||
| 26 11 2000 | 04:01:50 | 600 | 1.085 | 2.20 | |
| 26 11 2000 | 03:56:01 | 240 | 1.084 | 1.93 | |
| 26 11 2000 | 03:53:21 | 40 | 1.083 | 1.93 | |
| 26 11 2000 | 04:20:18 | 300 | 1.094 | 1.93 | |
| 26 11 2000 | 04:16:15 | 120 | 1.091 | 2.06 | |
| 26 11 2000 | 04:14:09 | 20 | 1.090 | 2.48 | |
| 26 11 2000 | 04:34:15 | 300 | 1.105 | 1.93 | |
| 26 11 2000 | 04:30:20 | 120 | 1.101 | 1.93 | |
| 26 11 2000 | 04:28:00 | 20 | 1.099 | 1.93 | |
2.1 Photometry
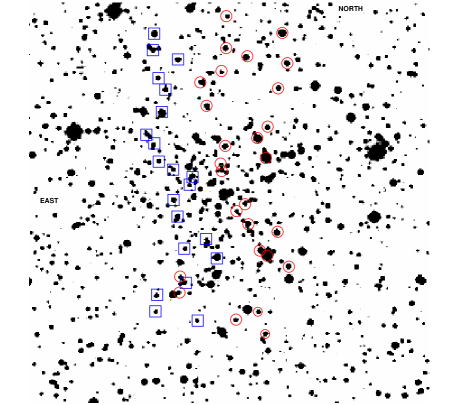
Our data were acquired at the Italian Telescopio Nazionale Galileo, on the Canary Islands, using DOLORES (Device Optimized for the LOw RESolution), a focal reducer capable of imaging and low resolution spectroscopy, on UT 2000 November 26, and UT 2004 February 14. DOLORES mounts a 2k Loral thinned and back-illuminated CCD, with scale of 0.275 arcsec pix-1, and a field of view of 9.4 9.4 arcmin2. We observed two fields, one centered on the cluster (see Fig. 1) and a second one about 20 arcmin away, to determine the level of field star contamination.
For each field, Table 1 lists the date of the observation together with the filters used and other relevant information. Seeing conditions were better for the short exposures taken in 2004; however, since this is a rather loose field, even modest seeing did not represent a problem for our photometry. We did not have any shutter timing problems, since they arise only below 0.1 s with this instrument and even our shortest exposure time was 10 times longer.
The reduction procedure is the same adopted in the other papers of this series, and details can be found e.g., in Tosi et al. (2004) or Di Fabrizio et al. (2005). Standard IRAF 111IRAF is distributed by the National Optical Astronomical Observatory, which are operated by the Association of Universities for Research in Astronomy, under contract with the National Science Foundation routines were utilized for pre-reduction, and the IRAF version of the DAOPHOT-ii package (Stetson 1987, Davis 1994) was used with a quadratically varying point spread function (PSF) to derive positions and magnitudes for the stars. Output catalogues for each frame were aligned in position and magnitude, and final (instrumental) magnitudes were computed as weighted averages of the individual values.
Aperture correction to bring the PSF magnitudes on the same scale of the aperture magnitudes, i.e. the same of the standard stars, was computed for each relevant frame. The corrections range from about to mag.
We observed the standard areas PG0231+051 and Rubin 149 (Landolt, 1992) and derived the calibration equations assuming the average extinction coefficients for the site, as given in the site web pages (www.tng.iac.es: ):
where , , , are the aperture-corrected instrumental magnitudes, after further correction for extinction and for exposure time, and , , are the output magnitudes, calibrated to the Johnson-Cousins standard system.
Finally, we determined our completeness level in each band using extensive artificial stars experiments (see Tosi et al. 2004), whose results are given in Table 2.
We also checked out photometry against the studies of Kaluzny & Mazur (1991) and Richtler & Sagar (2001), finding a very good agreement. The stars in common, about 800 with Kaluzny & Mazur (1991) and 1700 with Richtler & Sagar (2001), respectively, cover the whole interval in magnitude and colours. They have a mean difference (our photometry minus literature) of (=0.070), (=0.061), for Kaluzny & Mazur (1991) and (=0.101), (=0.072) for Richtler & Sagar (2001) (i.e., we are intermediate between the two photometries in ). No trends with magnitude or colour are present.
| mag | ||||||
|---|---|---|---|---|---|---|
| (central field) | (external field) | |||||
| 16.00 | 1.00 | 1.00 | 1.00 | 1.00 | 1.00 | 1.00 |
| 16.50 | 0.97 | 0.95 | 0.92 | 1.00 | 0.99 | 0.95 |
| 17.00 | 0.89 | 0.87 | 0.88 | 0.99 | 0.98 | 0.94 |
| 17.50 | 0.87 | 0.85 | 0.85 | 0.97 | 0.97 | 0.92 |
| 18.00 | 0.80 | 0.81 | 0.78 | 0.97 | 0.94 | 0.87 |
| 18.50 | 0.74 | 0.69 | 0.68 | 0.96 | 0.93 | 0.84 |
| 19.00 | 0.67 | 0.59 | 0.54 | 0.93 | 0.93 | 0.73 |
| 19.50 | 0.52 | 0.45 | 0.37 | 0.91 | 0.90 | 0.52 |
| 20.00 | 0.33 | 0.28 | 0.21 | 0.89 | 0.86 | 0.29 |
| 20.50 | 0.16 | 0.10 | 0.09 | 0.85 | 0.78 | 0.11 |
| 21.00 | 0.07 | 0.05 | 0.03 | 0.69 | 0.58 | 0.04 |
| 21.50 | 0.02 | 0.01 | 0.01 | 0.42 | 0.32 | 0.01 |
| 22.00 | 0.00 | 0.00 | 0.00 | 0.22 | 0.15 | 0.00 |
| 22.50 | 0.00 | 0.00 | 0.00 | 0.07 | 0.05 | 0.00 |
2.2 Spectroscopy
The targets for the spectroscopic observations were selected from the preliminary photometry of images taken during our first run, trying to sample the relevant evolutionary phases: red giant branch (RGB), red clump (RC), upper main sequence (MS) and main-sequence Turn-Off (TO) point. We also added two stars near the RGB tip, taken from published catalogues (stars 2 and 4 in Kaluzny & Mazur 1991). These stars are too bright for the exposure times of our first photometric images and only one of them was later completely recovered in our second run. A few probable field stars, based on the preliminary colour-magnitude diagram, were also included as a check. The spectra were acquired using the Multi Object Spectroscopy (MOS) facility of DOLORES on UT February 14, 16, 17 2004; 4 exposures were take with the first mask, and 3 with the second one (see Table 3), using the VPH grism centered on H and a 11 slit (resolution 1.36 Å, or ). The full wavelength range of our spectra is 680 Å, but in Fig. 2 only a region centred on H is shown. The configuration is the same already used for Berkeley 29 (, Bragaglia et al.2005), as is the reduction procedure.
Given the much better S/N of most of the present spectra (see Fig. 2 for some representative cases with S/N about 25, 75, 125, 150 from bottom to top), a different strategy was instead adopted to derive the radial velocity (RV). To this end we used the task rvidlines in IRAF with a list of about 35 lines, mostly of iron, and comprising H, the only line always visible in all spectra, even at very low S/N and/or high temperature. The formal error of the velocities measured by rvidlines is of about 5 km s-1. The observed velocities were corrected to heliocentric, and averaged (see Section 4).
| MASK | Date | UT | Exp | Airmass |
|---|---|---|---|---|
| (dd mm yy) | (beginning) | (sec) | ||
| mask1_a | 14 02 2004 | 21:12:01 | 1200 | 1.146 |
| mask1_b | 14 02 2004 | 21:40:38 | 1200 | 1.106 |
| mask1_c | 14 02 2004 | 22:06:15 | 1800 | 1.086 |
| mask1_d | 14 02 2004 | 22:42:54 | 1800 | 1.081 |
| mask2_a | 16 02 2004 | 02:11:49 | 1200 | 1.833 |
| mask2_b | 16 02 2004 | 02:37:07 | 1200 | 2.159 |
| mask2_c | 17 02 2004 | 02:11:09 | 1200 | 1.868 |

3 The Colour-Magnitude Diagrams
The final photometric cluster catalogue222 The catalog can be obtained in electronic form through the BDA (Mermilliod, 1995) at http://www.univie.ac.at/webda/new.html includes 2031 objects; 1541 of them are identified in all 3 filters, 1576 at least in and and 1996 at least in and . Similarly, the external field catalogue has 1398 objects (1031 of them with magnitudes in all 3 bands, 1069 at least in and , and 1348 in and ). The corresponding CMDs are shown in Fig. 3, where we also anticipate results on membership, described in Sect. 4. Pixel coordinates for all Be 32 stars were transformed to equatorial coordinates using software written by P. Montegriffo; we used a linear relation, and residuals have a rms of about 0.15 arcsec in both coordinates.

Some disc star contamination is noticed in the cluster CMD, yet we are able to locate the TO and RC at , , , and , , , respectively. Most stars falling out of the main features are contaminating field objects, but there are a few ones, brighter than the TO and bluer than the RGB, that may instead be blue stragglers; they are worth of further examination. Furthermore, an accurate measurement of the RC mean magnitude is obtained using the 4 RC stars with spectroscopically confirmed membership (see next Section). We derive (r.m.s. ) and (r.m.s. ), where the errors are the standard deviations of the measurements.
Be 32 appears to be old; a first measure of its age can be obtained through morphological age indicators, like the Morphological Age Index (MAI: Janes & Phelps, 1994), based on the difference in magnitude between the TO and the RC (), or the Morphological Age Ratio (MAR: Anthony-Twarog & Twarog, 1985), which also takes into account the difference in colour between the two points. From our data we obtain 2.3 and 0.65; these figures have an attached uncertainty of about 0.1 mag, since the actual TO and RC points are difficult to locate in a diagram contaminated by field stars (even if we were helped by the membership information of selected stars). They translate into ages of about 6 Gyr using the MAI, and between 5 and 7 Gyr using the original (Anthony-Twarog & Twarog, 1985) and the revised (Anthony-Twarog & Twarog, 1989) calibrations of the MAR, respectively. Our measure is in good agreement with the age derived both from morphological age parameters and isochrone fitting by Richtler & Sagar (2001). This has to be taken as a first indication of the cluster age, but is substantiated also by the results by (Salaris et al.2004). They calibrated a similar method, that makes also use of information on the metallicity; using the literature values of = 2.4 and [Fe/H]=0.50, they derived a very similar age of 5.91 Gyr.
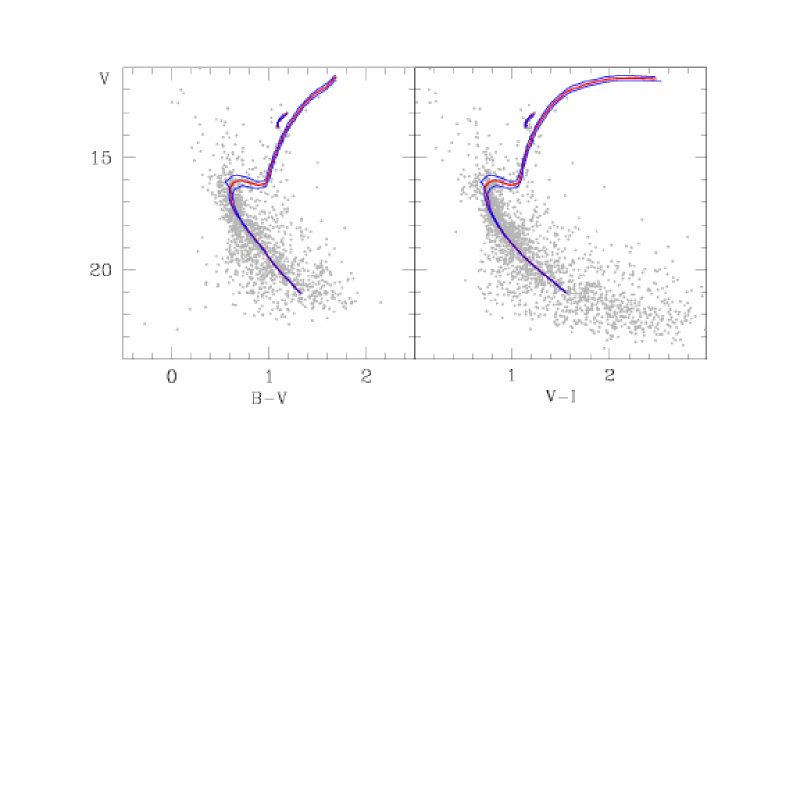
We have fitted our data with isochrones, using the models of Bertelli et al. (1994), since they come from the same set of evolutionary tracks that we have already successfully used in our works (Bragaglia & Tosi 2006 and references therein). We tried three different values of metallicity, Z = 0.02 (i.e., solar abundance), Z = 0.008 (corresponding to [Fe/H] ) and Z = 0.004 (corresponding to [Fe/H] ). The first and last sets of isochrones did not fit well our data, while isochrones with Z = 0.008 provided a good fit. This is in agreement with the most recent determination of the cluster metallicity [Fe/H] = 0.50 (Friel et al., 2002).333 Preliminary analysis of the FLAMES-UVES spectra (see next Section) also indicate a metallicity similar to Z = 0.008 The results of the best fit, obtained with = 0.10, = 12.48 and age = 6.3 Gyr (and Z=0.008), are shown in Fig. 4.
An independent estimate of the distance has been derived by an empirical comparison of the RC in Be 32 with the RC level in open clusters with similar properties and well established distance (see , Bragaglia et al.2005, for details). We chose as template cluster Mel 66, an open cluster for which Sarajedini (1999) reports [Fe/H] and an age 4.5 Gyr, hence quite similar to Be 32. Since the metallicities of Be 32 and Mel 66 are indistinguishable within the uncertainties, there is no need to correct for the dependence of the RC luminosity on metallicity. Instead, we applied a small correction for population effects to the and luminosity of the RC assuming that Be 32 is 2 Gyr older than Mel 66, and using the calculations of Girardi & Salaris (2001). The correction is of the order 0.07 mag (for ) and implies luminosities and for the red clump of Be 32.
With this population correction, and assuming a reddening from our isochrone fit, we obtained an extinction-corrected distance modulus using and from , where the errors mainly reflect the uncertainty on the reddening.
These results do not differ very much from the literature ones (see Introduction). We defer any further comparison until a refinement of our results is obtained using a synthetic CMD technique.
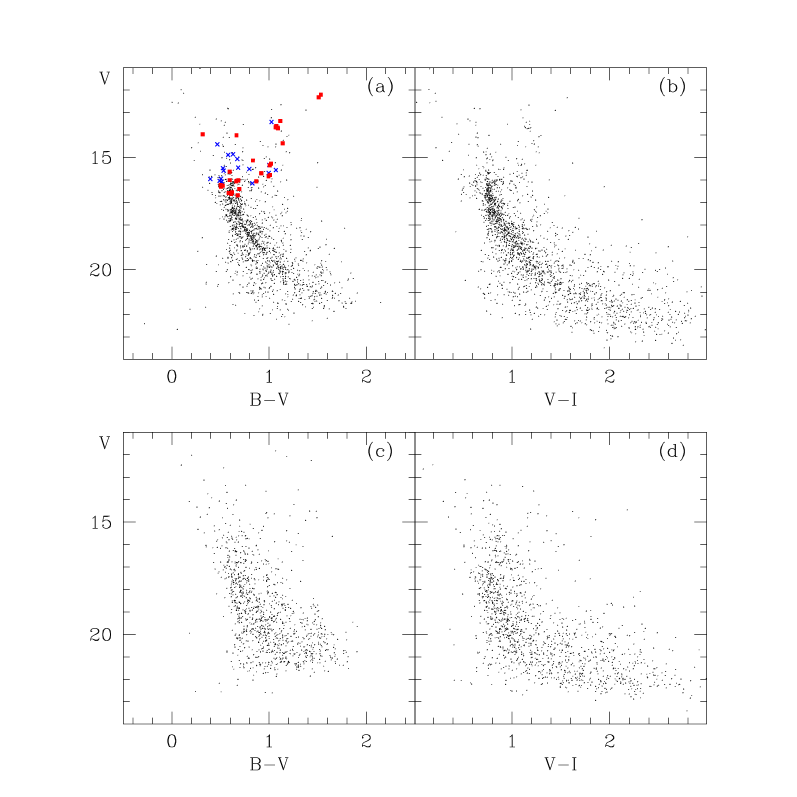
The CMD of the external field appears to be composed by (at least) two populations: a broad young main sequence of field stars, crossing diagonally the diagram, and a second more concentrated sequence fainter and bluer than the Be 32 main sequence. The latter does not seem, at first sight, completely ascribable to the ”normal” disc population, as described, e.g., by the Besançon Galactic model by Robin et al. (2003). A thorough discussion is beyond the purposes of the present paper (and the possibilities of our data), but we consider it useful to further check whether we could be seeing some extra-disc component. Given the position of our field (, ) and the distances involved we cannot have intercepted directly the Monoceros Ring (e.g., Newberg et al. 2002, Ibata et al. 2003). This feature of the Galactic disc has also been suggested (Martin et al. 2004) to be associated to an over density in star counts that could represent the remnant of a dwarf galaxy (Canis Major, CMa). While the existence of the Ring itself is not disputed, the reality of CMa has however been challenged, for instance, by Momany et al. (2004) who attribute the over density to the Galactic Warp. We present in Fig. 5 a comparison of our data [Fig. 5(b)] to what is thought to be the CMD of CMa [(Bellazzini et al., 2004), Fig. 5(a)], and to the modeled disc population [Fig. 5(c)]. All CMDs have been scaled to absolute magnitudes and dereddened colours by correcting for the values given in the caption. The apparently better agreement between the CMDs in panels (a) and (b) suggests that we might be seeing a portion of the disrupting CMa (see also Bellazzini et al., 2006).
To say something more definitive, further investigations would be required, involving e.g. precise radial velocities of lower MS stars, to be compared to the ones that are being derived in the direction of CMa and of several Ring positions. As indicated in the next section, our field stars have an average RV of about 43 km s-1 (with an rms of 28 km s-1), similar to that of the disc stars in the same direction, as deduced from the Besançon model (33 km s-1, with an rms of 28). However, our velocities refer to stars much brighter than those of the faint blue CMD feature which might correspond to extra-disc components. The bright stars of our sample are most likely field objects absolutely compatible with the model in Fig. 5(c).
| Star | KM | RS | RA(2000) | Dec(2000) | RV | RVSFJ | M | ||||
| (h:m:s) | (d:m:s) | (km s-1) | (km s-1) | (km s-1) | |||||||
| Mask 1 | |||||||||||
| 345 | 563 | 6:58:06.351 | 6:22:45.72 | 88.44 | 9.64 | 16.804 | 16.298 | 15.662 | C | ||
| 18 | 351 | 1720 | 6:58:04.037 | 6:22:58.04 | 111.84 | 6.00 | 16.728 | 16.066 | 15.243 | C | |
| 408 | 161 | 525 | 6:58:12.034 | 6:23:26.65 | 116.47 | 2.86 | 17.166 | 16.581 | 15.811 | C | |
| 465 | 116 | 488 | 6:58:11.861 | 6:23:49.03 | 39.29 | 5.43 | 16.975 | 16.148 | 15.241 | F | |
| 500 | 49 | 1243 | 6:58:01.030 | 6:24:06.63 | 39.54 | 1.29 | 16.337 | 15.334 | 14.275 | F | |
| 2689 | 2 | 6:58:03.398 | 6:26:49.89 | 106.57 | 4.46 | 102 | 13.733 | 12.201 | C | ||
| 550 | 26 | 446 | 6:58:03.840 | 6:24:30.16 | 62.76 | 4.77 | 14.879 | 14.412 | 13.849 | F | |
| 605 | 27 | 416 | 6:58:02.269 | 6:24:56.76 | 104.48 | 1.75 | 109 | 15.511 | 14.372 | 13.177 | C |
| 1341 | 57 | 1179 | 6:58:05.104 | 6:25:10.52 | 105.95 | 7.00 | 16.224 | 15.629 | 14.888 | C | |
| 1523 | 236 | 6:58:06.244 | 6:25:28.58 | 115.92 | 4.50 | 17.359 | 16.682 | 15.928 | C | ||
| 698 | 75 | 357 | 6:58:05.417 | 6:25:40.24 | 107.61 | 5.18 | 16.840 | 15.846 | 14.798 | C | |
| 737 | 16 | 1685 | 6:58:06.945 | 6:25:56.45 | 106.91 | 3.07 | 93 | 14.672 | 13.597 | 12.478 | C |
| 787 | 19 | 318 | 6:58:03.095 | 6:26:16.08 | 112.61 | 3.39 | 87 | 14.800 | 13.709 | 12.564 | C |
| 110 | 82 | 292 | 6:58:07.836 | 6:26:37.71 | 70.30 | 4.60 | 16.359 | 15.962 | 15.509 | F | |
| 1556 | 4 | 6:58:03.182 | 6:24:22.32 | 104.55 | 4.04 | 98 | 13.830 | 12.321 | 10.773 | C | |
| 895 | 39 | 1650 | 6:58:07.459 | 6:27:05.82 | -22.78 | 7.70 | 15.739 | 15.065 | 14.326 | F | |
| 1393 | 12 | 1948 | 6:58:04.223 | 6:27:17.15 | 105.69 | 4.87 | 14.492 | 13.375 | 12.203 | C | |
| 1535 | 62 | 1642 | 6:58:03.247 | 6:27:34.16 | 106.09 | 3.77 | 16.620 | 15.699 | 14.452 | C | |
| 1502 | 58 | 963 | 6:58:09.303 | 6:28:05.80 | 72.65 | 5.72 | 16.120 | 15.588 | 14.841 | F | |
| 169 | 51 | 1629 | 6:58:02.148 | 6:28:33.11 | 42.46 | 5.82 | 16.002 | 15.476 | 14.750 | F | |
| 173 | 61 | 1626 | 6:58:09.894 | 6:28:41.84 | 59.85 | 2.33 | 16.690 | 15.693 | 14.594 | F | |
| 1079 | 167 | 911 | 6:58:07.857 | 6:28:56.51 | 105.19 | 2.58 | 17.164 | 16.544 | 15.766 | C | |
| 1101 | 35 | 1616 | 6:58:01.273 | 6:29:10.52 | 74.43 | 3.88 | 15.485 | 14.855 | 14.068 | F | |
| 186 | 22 | 2220 | 6:58:05.383 | 6:29:19.28 | 85.57 | 13.81 | 14.290 | 13.972 | 13.506 | C | |
| 1139 | 44 | 1866 | 6:58:07.474 | 6:29:32.61 | 103.20 | 2.22 | 16.299 | 15.278 | 14.153 | C | |
| 1183 | 1851 | 6:58:01.771 | 6:29:55.30 | 30.77 | 4.47 | 14.450 | 13.425 | 12.282 | F | ||
| Mask 2 | |||||||||||
| 343 | 565 | 6:58:10.213 | 6:22:44.68 | 64.03 | 4.62 | 16.585 | 16.071 | 15.424 | F | ||
| 364 | 2269 | 6:58:14.334 | 6:22:57.83 | 105.93 | 5.04 | 16.726 | 16.223 | 15.573 | C | ||
| 1574 | 178 | 6:58:14.227 | 6:23:22.25 | 91.45 | 12.17 | 17.104 | 16.410 | 15.605 | C | ||
| 445 | 53 | 1274 | 6:58:11.509 | 6:23:41.66 | 29.41 | 2.15 | 16.313 | 15.515 | 14.654 | F | |
| 533 | 17 | 456 | 6:58:08.244 | 6:24:19.55 | 109.97 | 1.18 | 115 | 14.754 | 13.667 | 12.540 | C |
| 57 | 81 | 442 | 6:58:11.428 | 6:24:32.32 | 34.31 | 0.63 | 16.449 | 15.945 | 15.314 | F | |
| 577 | 172 | 1715 | 6:58:09.296 | 6:24:46.16 | 116.44 | 8.24 | 17.245 | 16.633 | 15.936 | C | |
| 666 | 71 | 1702 | 6:58:12.186 | 6:25:20.83 | 109.10 | 1.73 | 16.794 | 15.783 | 14.718 | C | |
| 710 | 41 | 1691 | 6:58:12.586 | 6:25:44.94 | 106.39 | 3.43 | 15.968 | 15.135 | 14.171 | C | |
| 97 | 129 | 1680 | 6:58:11.008 | 6:26:06.94 | 121.55 | 5.11 | 16.778 | 16.254 | 15.650 | C | |
| 799 | 50 | 2239 | 6:58:10.734 | 6:26:21.16 | 109.96 | 2.55 | 16.354 | 15.348 | 14.263 | C | |
| 822 | 91 | 302 | 6:58:12.609 | 6:26:30.27 | 123.18 | 10.31 | 16.605 | 16.010 | 15.276 | C | |
| 113 | 97 | 1661 | 6:58:14.080 | 6:26:43.09 | 109.65 | 4.59 | 16.930 | 16.060 | 15.056 | C | |
| 898 | 99 | 1027 | 6:58:14.622 | 6:27:08.11 | 45.79 | 9.66 | 16.533 | 16.041 | 15.412 | F | |
| 1394 | 59 | 238 | 6:58:15.315 | 6:27:23.25 | 73.75 | 1.25 | 16.633 | 15.564 | 14.415 | F | |
| 997 | 18 | 974 | 6:58:13.758 | 6:27:54.78 | 108.07 | 4.12 | 105 | 14.730 | 13.661 | 12.534 | C |
| 166 | 52 | 1895 | 6:58:13.477 | 6:28:29.70 | -10.49 | 3.42 | 16.138 | 15.456 | 14.545 | F | |
| 1070 | 96 | 157 | 6:58:14.201 | 6:28:47.59 | 102.63 | 3.22 | 16.697 | 16.012 | 15.185 | C | |
| 183 | 36 | 2221 | 6:58:12.193 | 6:29:14.95 | 18.79 | 5.15 | 15.463 | 14.884 | 14.142 | F | |
| 1135 | 64 | 115 | 6:58:14.727 | 6:29:29.77 | 105.12 | 3.27 | 16.621 | 15.701 | 14.689 | C | |
| 199 | 1605 | 6:58:14.580 | 6:29:53.84 | 94.30 | 4.85 | 14.683 | 14.018 | 13.252 | C | ||
4 Radial velocities: membership
We obtained RVs for 48 of the 49 objects observed; one star near the TO had very low S/N spectra and we did not determine its RV. We averaged the 4 or 3 values for the stars in Mask1 and Mask2, respectively, after applying the heliocentric corrections. These average values are given in Table 4, together with their r.m.s. The RV for star 1502 was determined independently for both masks (heliocentric RV= 66.92 and 78.37 km s-1 for Mask1 and Mask2, respectively), and we give here the average of the two values. Given the precision expected on the basis of the resolving power, the internal errors of the RV measures, the standard deviations of the means, and this last result, we may safely attach an average error of 5 km s-1 to our velocities.
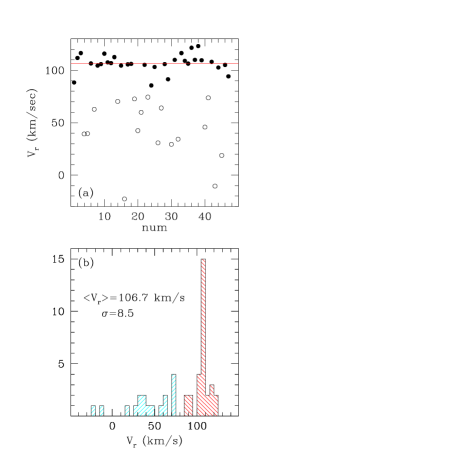
Results of our RV study are summarized in Fig. 6. Panel (a) shows all the measured RVs, and the derived mean cluster velocity, after elimination of all probable field objects (the limit at RV = 85 km s-1 is equivalent to a 2.5 clipping). Panel (b) is a histogram indicating the mean RV and the tail of field stars. The average cluster velocity derived from our data is RV = 106.7 km s-1 (rms 8.5 km s-1, 31 stars).
We have six stars in common with Scott et al. (1995), who derived RVs with a precision of about 10 km s-1. The RVs are in good agreement (see Table 4), with an average difference (MOS minus Scott et al. 1995) of about 6 km s-1, that becomes about 3 km s-1 excluding the most discrepant star.
We have used the membership information based on our RVs to select RGB and RC stars to be observed with FLAMES-UVES (R 40000) at the ESO Very Large Telescope in January 2005. The preliminary UVES measurements of the RVs of six stars in common are in very good agreement with the present values (P. Sestito, private communication): RV(MOS-UVES) = 2.53 ( = 4.92) km s-1, with the difference being dominated by 1 star (without it, we have RV = 0.80, = 2.78 km s-1).
5 Summary
We have presented a photometric and spectroscopic study of stars in the old open cluster Berkeley 32. The main results are the following:
-
1.
Analysis of the cluster CMDs confirms that this is an old, nearby, rather metal-poor cluster (age 6 Gyr, = 12.48, = 0.10, Z = 0.008).
-
2.
An analysis of the mean luminosity of RC stars provides an independent confirmation of this distance to Be 32, yielding .
-
3.
The CMD of the comparison field looks similar to the one of CMa, i.e. of the proposed originator of the Anticentre Ring.
-
4.
Membership of 48 stars in the cluster directions has been determined on the basis of their RV.
-
5.
The cluster average RV has been measured: 106.7 km s-1, rms of 8.5 km s-1, based on 31 member stars.
Further work on this interesting cluster is foreseen, starting from the present results: for instance, the information on membership will be useful when analyzing Be 32 with the synthetic CMD technique and the photometry in deriving atmospheric parameters of stars observed with high resolution spectroscopy.
Acknowledgments
We thank M. Bellazzini and S. Zaggia for valuable discussions on CMa and P. Montegriffo for his very useful software. We gratefully acknowledge the use of the BDA by J.-C. Mermilliod. This project has been partially supported by the Italian MIUR, under PRIN 2003029437.
References
- Anthony-Twarog & Twarog (1985) Anthony-Twarog B. J., Twarog B. A. 1985, ApJ, 291, 595
- Anthony-Twarog & Twarog (1989) Anthony-Twarog B. J., Twarog B. A. 1989, AJ, 97, 759
- Bellazzini et al. (2004) Bellazzini M., Ibata R., Monaco L., Martin N., Irwin M. J., Lewis G. F. 2004, MNRAS, 354, 1263
- Bellazzini et al. (2006) Bellazzini M., Ibata R., Martin N., Lewis G. F., Conn B., Irwin M. J., 2006, MNRAS, in press (astro-ph/0504494)
- Bertelli et al. (1994) Bertelli G., Bressan A., Chiosi C., Fagotto F, Nasi E. 1994, A&A, 106, 275
- Bragaglia & Tosi (2006) Bragaglia A., Tosi M. 2006, AJ, in press (astro-ph/0511020)
- (7) Bragaglia A., Held E. V., Tosi M. 2005, A&A, 429, 881
- Davis (1994) Davis L. E. 1994, A Reference Guide to the IRAF/DAOPHOT Package, IRAF Programming Group, NOAO, Tucson
- Di Fabrizio et al. (2005) Di Fabrizio L., Bragaglia A., Tosi M., Marconi G. 2005, MNRAS, 359, 996
- Friel (1995) Friel E. D. 1995, ARA&A, 33, 381
- Friel et al. (2002) Friel E. D., Janes K. A., Tavarez M., Scott J., Katsanis R., Lotz J., Hong L., Miller N., 2002, AJ, 124, 2693
- Girardi & Salaris (2001) Girardi L., Salaris M., 2001, MNRAS, 323, 109
- Hasegawa et al. (2004) Hasegawa T., Malasan H. L., Kawakita H., Obayashi H., Kurabayashi T., Nakai T., Hyakkai M., Arimoto N., 2004, PASJ, 56, 295
- Ibata et al. (2003) Ibata R. A., Irwin M. J., Lewis G. F., Ferguson A. M. N., Tanvir N. 2003, MNRAS, 340, L21
- Janes & Phelps (1994) Janes K. A., Phelps R. L. 1994, AJ, 108, 1773
- Kaluzny & Mazur (1991) Kaluzny J., Mazur B., 1991, AcA, 41, 167
- Landolt (1992) Landolt A. U. 1992, AJ, 104, 340
- Martin et al. (2004) Martin N., Ibata R. A., Bellazzini M., Irwin M. J., Lewis G. F., Denhen W. 2004, MNRAS, 348, 12
- Mermilliod (1995) Mermilliod J. C. 1995, D. Egret, M. A. Albrecht eds, Information and On-Line Data in Astronomy, Kluwer Academic Press (Dordrecht), p. 127
- Momany et al. (2004) Momany Y., Zaggia S. R., Bonifacio P., Piotto G., De Angeli F., Bedin L. R., Carraro G., 2004, A&A, 421, L29
- Newberg et al. (2002) Newberg H. J., et al. 2002, ApJ, 569, 245
- Richtler & Sagar (2001) Richtler T., Sagar R., 2001, BASI, 29, 53
- Robin et al. (2003) Robin A. C., Reylé C., Derrière S., Picaud S., 2003, A&A 409, 523
- (24) Salaris M., Weiss A., Percival S. M., 2004, A&A, 414, 163
- Sarajedini (1999) Sarajedini A. 1999, AJ, 118, 2321
- (26) Schlegel D. J., Finkbeiner D. P., Davis M. 1998, ApJ, 500, 525
- Scott et al. (1995) Scott J. E., Friel E. D., Janes K. A., 1995, AJ, 109, 1706
- Stetson (1987) Stetson P. B. 1987, PASP 99, 191
- Tosi et al. (2004) Tosi M., Di Fabrizio L., Bragaglia A., Carusillo P. A., Marconi G. 2004, MNRAS, 354, 225