The source of variable optical emission is localized in the jet of the radio galaxy 3C 390.3
1 The link between variable radio emission of the jet and optical continuum emission
The strong continuum emission is believed to originate in the central
pc-scale region of active galactic nuclei (AGN) and is responsible for
ionizing the cloud material in the broad-line region (BLR). Locating
the source of the variable continuum emission in AGN is therefore
central for understanding the mechanism for release and transport of
energy in active galaxies. In radio-loud AGN, the continuum emission
from the relativistic jets dominates at all energies. The presence of
a positive correlation between beamed radio luminosity of the jet and
optical nuclear luminosity in the sample of radio galaxies suggests
that the optical emission is non-thermal and may originate from a
relativistic jet ar:hardcastle00 ; ar:chiaberge02 . The detection
of a correlation between the variations of radio and optical nuclear
emission in a single source would be the most direct evidence of
optical continuum emission coming from the jet.
To search for a relation between variability of the optical continuum flux and radio flux density in AGN on scales of pc, we combine ar:arshakian05 the results from monitoring of the radio-loud broad emission-line galaxy 3C 390.3 () in the optical and ultraviolet regimes with ten very long baseline interferometry (VLBI) observations of its radio emission at 15 GHz ar:kellermann04 made from 1992 to 2002 using the VLBA (Very Long Baseline Array).
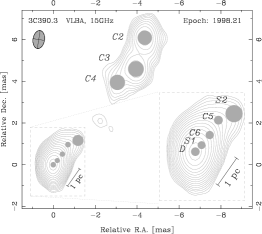
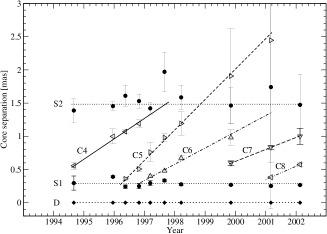
The modelfitting of a single epoch VLBA image (Fig. 1, left panel) shows five radio components on the scale of 2 mas. For ten VLBA images, we identified five moving components (C4-C8) and two stationary components (S1 and S2) separated from D by () mas and () mas, respectively (Fig. 1, right panel). The proper motions of moving components correspond to apparent speeds of to . We also measured the epoch, , at which each component was ejected from the component D and the epoch, , when it passed through the location of the stationary feature S1 (Fig. 1, right panel).
Employing minimization methods we found significant correlations between variations in the radio emission from D and S1 and in the optical continuum emission (Fig. 2, left panel). A time delay of year was found between flux density variations of D and S1 components of the jet. We also showed that the radio light curves of D and S1 correlate significantly ( % confidence level) and lead the optical light curve with time delays of yr and yr respectively. This finding indicates that there is a physical link between the jet components and optical continuum: the variable optical continuum emission is located in the innermost part of the sub-ps-scale jet near to component S1. A large fraction of the variable optical continuum emission in 3C 390.3 is non-thermal ar:wamsteker and produced in a region of 0.004 pc in size ar:dietrich at a distance of pc from D ar:arshakian05 .
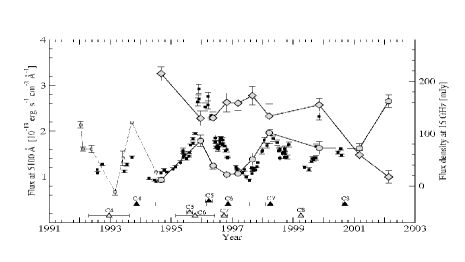
The link between the optical continuum and the jet is also supported by the correlation between the local maxima in the optical continuum light curve and the epochs (Fig. 2, left panel). The null hypothesis that this happens by chance is rejected at a confidence level of 99.98%. This suggests that radio component ejection events are coupled with the long-term variability of optical continuum.
2 The central sub-pc-scale region in 3C 390.3
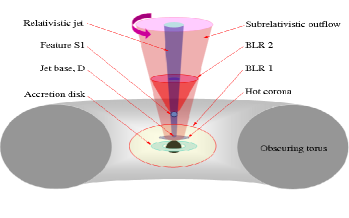
To understand the structure of the central engine and its radiation mechanism one needs to locate the stationary features with respect to the central nucleus. The component D is identified with the base of the jet which is most likely to be located in the central engine of 3C 390.3 near the accretion disk or hot corona. This is supported by the link between the ejection epoch () of the component C5 and the dip in the X-ray emission (similar to 3C 120; ar:marscher02 ). The feature S1 can be associated with the stationary radio feature which may be produced by internal oblique shock formed in the continuous relativistic flow (Fig. 2, right panel). We suggest that the beamed synchrotron radio emission from S1 produces the optical continuum emission via the Inverse Compton effect. The variable optical continuum emission associated with the jet and counterjet forms two conical shaped BLRs (BLR2; Fig. 2, right panel) at a distance of about 0.4 pc from the central nucleus.
The presence of the BLR2 at a large distance from the central nucleus challenges ar:arshakian05 the existing models of BLRs and the assumption of virialized motion in the BLR and hence, the BH mass estimates peterson02 of radio-loud AGN.
References
- (1) M.J. Hardcastle, D.M. Worrall: MNRAS, 314, 359 (2000)
- (2) M. Chiaberge, A. Capetti, A. Celotti: AA, 394, 791 (2002)
- (3) T.G. Arshakian, et al: astro-ph/0512393 (2005)
- (4) K.I. Kellermann, et al.: ApJ, 609, 539 (2004)
- (5) W. Wamsteker, W. Ting-gui, N. Schartel, R. Vio: MNRAS, 288, 225 (1997)
- (6) M. Dietrich, et al.: ApJSS, 115, 185 (1998)
- (7) D. Proga, J.M. Stone, T.R. Kallman: ApJ, 543, 686 (2000)
- (8) A.P. Marscher, et al.: Nature, 417, 625 (2002)
- (9) B.M. Peterson: Variability of AGN. In Advanced Lectures on The Starburst-AGN Connection, ed by I. Aretxaga, D. Kunth, R. Mújica (Singapore World Scientific 2002) pp 3–68