A simple model for quasar density evolution
Abstract
It is widely agreed upon that AGN and Quasars are driven by gas accretion onto a supermassive black hole. The origin of the latter however still remains an open question. In this work we present the results of an extremely simple cosmological model combined with an evolutionary scenario in which both the formation of the black hole as well as the gas accretion onto it are triggered by major mergers of gas-rich galaxies. Despite its very generous approximations our model reproduces the quasar density evolution in remarkable agreement with observations.
1 Introduction
While it is widely agreed upon that galaxy-galaxy interactions and, in particular, mergers play a crucial role for the growth of supermassive black holes in quasars and also for providing the fuel for quasar activity, there is still dispute whether these black holes are of primordial nature or not. N-body simulations (e.g. by barnes96 ) show that the tidal forces in interacting galaxies can trigger strong gas inflows towards the center of the merger. The mass of this gas is sufficient to build a supermassive BH of and provide enough fuel for quasar activity. On the basis of the -viscosity model by duschl00 calculations by duschl06 show that it takes less than a from the merger to form a fully developed quasar even if no primordial supermassive BH was originally present. This model can be tested by comparing the resulting co-moving space density of quasars to those derived from observations (e.g. silverman05 ).
2 Outline of the model
Based on results by duschl06 we assume an average time delay of a between the merger and the peak quasar activity. The individual values of this delay depend, of course, on details like the size () and initial mass () of the disk. Estimates of the relevant (viscous) timescale show its dependence . This leads to the – at first glance surprising—finding of the faster formation of the more massive black holes. For our present purpose, however, an average value of this delay serves its purpose. For more details of this model, we refer the reader to the contribution by Duschl and Strittmatter in this volume and in duschl06 .
For our purpose it is sufficient to use a “test universe” comprised of 50 000 galaxies. This test universe is expanding according to an Einstein-de Sitter-cosmology with a Hubble constant of . Our galaxies are treated as particles with a finite cross section and a thermal velocity dispersion of . In this framework we compute the merger rate for each simulated time bin (a) by taking into account two different processes: Direct geometrical hits and gravitationally driven mergers. For the first process we assume every galaxy to have a spherical cross section with a radius of 15 kpc. For the second process the cross section radius is , with being the mass of one galaxy and being the relative velocity between both. We assume a delay between the merger and the onset of the quasar phase of a for the geometrical hit and a for the gravitationally driven merger. The quasar phase in turn is assumed to last for another a.
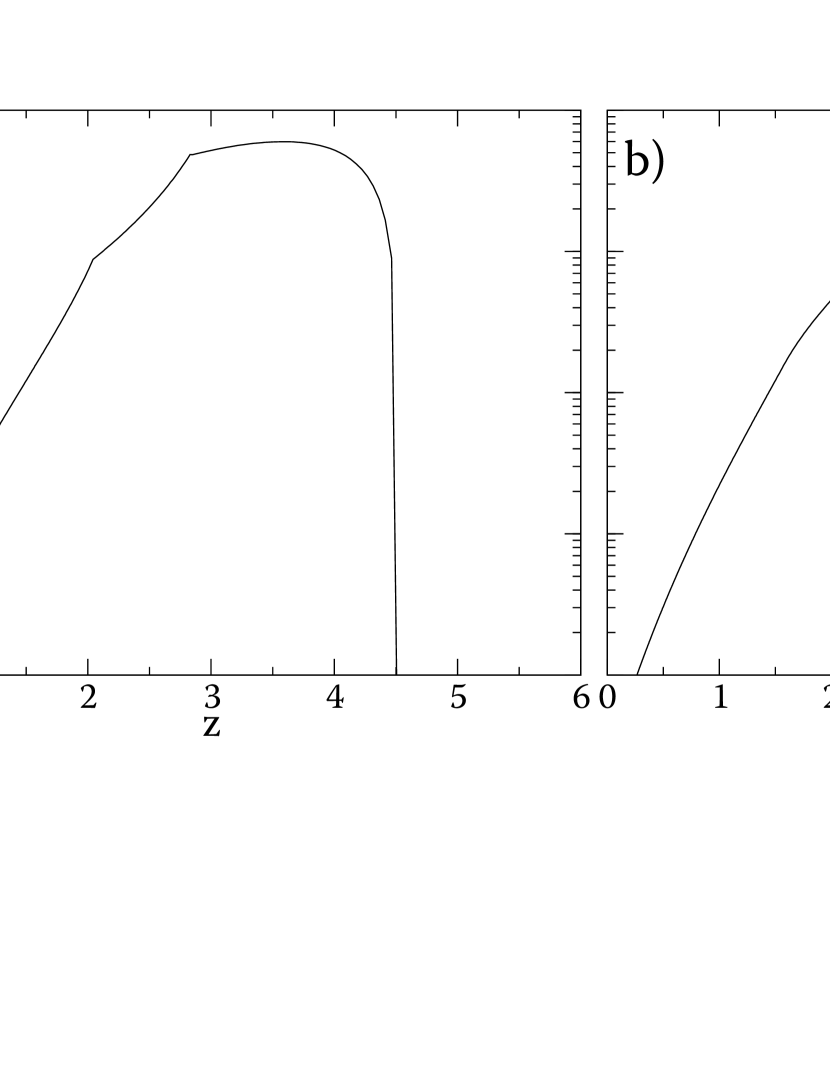
In our model the Universe is treated in very simple manner: As an expanding spherical box. The size of this box is determined by deriving today’s matter density from the assumed Hubble constant () and then using the Friedmann-Lemaître-equation to calculate the according radius at any given time. We completely neglect structure formation and start our simulation with large galaxies () already in place a after the Big Bang. To account for the formation of galaxies we increase their number over the first a of our simulation until the final number of 50 000 is reached (see fig. 1 for the effect of this procedure).
3 Results
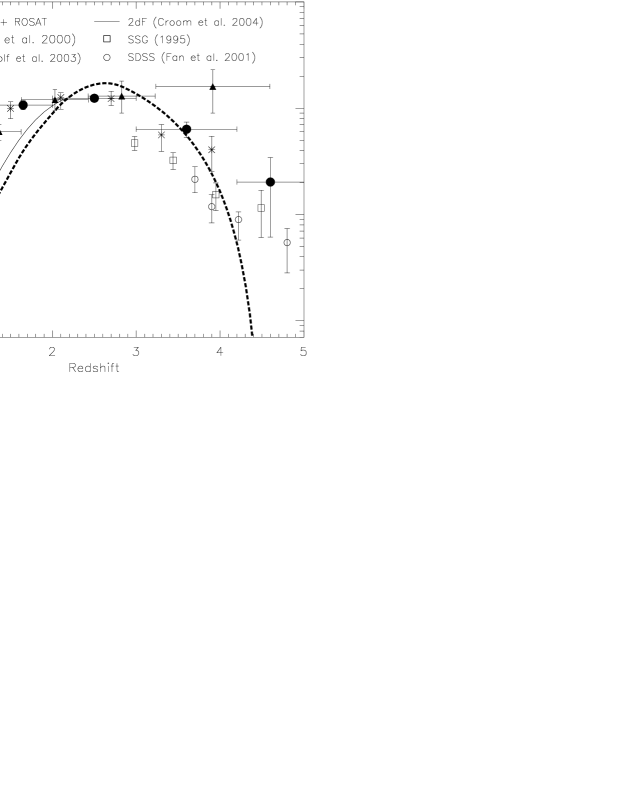
The comparison between our model results and observational data compiled by silverman05 is shown in fig.2. The quasar density evolution at lower redshifts and the position of the peak at match very well. Please note that the X-ray selected sample contains lower luminosity AGN in addition to quasars. In this respect it is natural that our results resemble the 2dF curve (from croom04 ) better than the data from silverman05 . At higher redshifts the deviation between simulated and observed co-moving spatial density is increasing. In our model we clearly miss the earliest quasars which arise from exceptionally fast evolving mergers. Despite this shortcoming of our results their overall agreement with observational data is remarkable.
References
- (1) J. E. Barnes, L. E. Hernquist: ApJ 471, 115 (1996)
- (2) S. M. Croom, et al.: MNRAS 349, 1397 (2004)
- (3) W. J. Duschl, P. A. Strittmatter, P. L. Biermann: A&A 357, 1123
- (4) W. J. Duschl, P. A. Strittmatter: in prep. (2006)
- (5) J. D. Silverman, et al.: ApJ 624, 630 (2005)
Index
- Accretion disk, AGN, cosmology, quasars, quasar evolution A simple model for quasar density evolution