Radio continuum and molecular line observations of four bright-rimmed clouds
Abstract
Aims. To search for evidence of triggered star formation within four bright-rimmed clouds, SFO 58, SFO 68, SFO 75 and SFO 76.
Methods. We present the results of radio continuum and molecular line observations conducted using the Mopra millimetre-wave telescope and Australia Telescope Compact Array. We use the =1–0 transitions of 12CO, 13CO and C18O to trace the distribution of molecular material and to study its kinematics.
Results. These observations reveal the presence of a dense core ( cm-3) embedded within each cloud, and the presence of a layer of hot ionised gas coincided with their bright-rims. The ionised gas has electron densities significantly higher than the critical density ( 25 cm-3) above which an ionised boundary layer can form and be maintained, strongly supporting the hypothesis that these clouds are being photoionised by the nearby OB star(s). Using a simple pressure-based argument, photoionisation is shown to have a profound effect on the stability of these cores, leaving SFO 58 and SFO 68 on the edge of gravitational stability, and is also likely to have rendered SFO 75 and SFO 76 unstable to gravitational collapse. From an evaluation of the pressure balance between the ionised and molecular gas, SFO 58 and SFO 68 are identified as being in a post-pressure balance state, while SFO 75 and SFO 76 are more likely to be in a pre-pressure balance state. We find secondary evidence for the presence of ongoing star formation within SFO 58 and SFO 68, such as molecular outflows, OH, H2O and methanol masers, and identify a potential embedded UC HII region, but find no evidence for any ongoing star formation within SFO 75 and SFO 76.
Conclusions. Our results are consistent with the star formation within SFO 58 and SFO 68 having been triggered by the radiatively driven implosion of these clouds.
Key Words.:
Stars: formation – ISM: clouds – ISM: HII regions – ISM: individual object: bright-rimmed clouds: SFO 58, SFO 68, SFO 75 and SFO 76 – ISM: molecules – Radio continuum: ISM1 Introduction
From the moment they turn on OB stars begin to drive an ionisation front into the surrounding molecular material, photo-evaporating and dissipating the molecular cloud from which they have formed. The rapidly expanding HII region leads to the formation of a dense shell of neutral gas, swept up in front of the ionisation front. These dense shells, and dense neutral clumps of material, surrounding evolved HII regions have long been suspected to be regions where star formation could have been triggered (Elmegreen & Lada 1977; Sandford et al. 1982). Bright-Rimmed Clouds (BRCs) are small molecular clouds located on the edges of evolved HII regions and are considered, due to their relatively simple geometry and isolation within HII regions, to be ideal laboratories in which to study the physical processes involved in triggered star formation.
The photoionisation of the BRCs surface layers by UV photons from nearby OB stars leads to the formation of a layer of hot ionised gas, known as an Ionised Boundary Layer (IBL), which surrounds the rim of the molecular cloud. The hot ionised gas streams off the surface of the cloud into the low density HII regions, resulting in a continuous mass loss by the cloud, known as a photo-evaporative flow (Megeath & Wilson 1997). Within the IBL the incoming ionising photon flux is balanced by recombination, with only a small fraction of ionising photons penetrating the IBL to ionise new material (Lefloch & Lazareff 1994), which replenishes the ionised material within the IBL lost to the photo-evaporative flow. If the IBL is over-pressured with respect to the molecular gas within the BRC, shocks are driven into the molecular gas, resulting in the compression of the cloud, and can lead to the formation of dense cores which are then triggered to collapse by the same (or a subsequent) shock front (Elmegreen 1992). The propagating shock front may also serve to trigger the collapse of pre-existing dense cores, thus leading to the creation of a new generation of stars. This method of triggered star formation is known as Radiative–Driven Implosion (RDI) and may be responsible for the production of hundreds of stars in each HII region (Ogura et al. 2002), and perhaps even contributing up to % of the low-to-intermediate mass IMF (Sugitani et al. 2000).
Shocks continue to be driven into the cloud, compressing the molecular material until the internal density and pressure is balanced with the pressure of the IBL; after which the shock fronts dissipate and the cloud is considered to be in a quasi-steady state known as the cometary stage (Bertoldi & McKee 1990; Lefloch & Lazareff 1994). Once equilibrium is reached the ionisation front is unable to have any further influence on the internal dynamics of the cloud, but continues to propagate into the cloud photo-evaporating the molecular gas, which streams into the HII region, eroding the cloud and accelerating it radially away from the ionising star via the rocket effect (Oort & Spitzer 1955). The mass loss resulting from photoionisation ultimately leads to the destruction of the cloud on a timescale of several million years.
A search of the IRAS point source catalogue, correlated with the Sharpless HII region catalogue (Sharpless 1959) and the ESO(R) Southern Hemisphere Atlas resulted in a total of 89 BRCs being identified with an associated IRAS point source, 44 in the northern and 45 in the southern sky (Sugitani et al. 1991; Sugitani & Ogura 1994; collectively known as the SFO catalogue). The association of an IRAS point source located within these BRCs suggests that these clouds might contain embedded protostars. Several comprehensive studies of individual BRCs have been reported (e.g. Lefloch et al. 1997; Megeath & Wilson 1997; Yamaguchi et al. 1999; Codella et al. 2001; De Vries et al. 2002; Dobashi et al. 2002; Thompson et al. 2004), all of which have confirmed their association with protostellar cores. However, the question of star formation occurring more widely in these objects still remains unclear, and evidence for triggered star formation within the small number of BRCs so far observed remains circumstantial and inconclusive. To address these issues we are currently conducting a complete census of the SFO catalogue; here we report the results of a detailed study of four southern BRCs.
In an earlier paper (Thompson, Urquhart & White, 2004b; hereafter Paper I) we reported the results of a relatively low angular resolution radio continuum survey of the 45 southern BRCs taken from the SFO catalogue. In that survey we detected radio continuum emission toward eighteen BRCs. In each case the radio emission was found to correlate extremely well with both the morphology of the optical bright rim seen in the DSS (R band) image and the Photo-Dominated Region (PDR) traced by the Midcourse Space eXperiment (MSX)111Available from the NASA/IPAC Infrared Processing and Analysis Center and NASA/IPAC Infrared Space Archive both held at http://www.ipac.caltech.edu. 8 m image (Price et al. 2001), consistent with the hypothesis that these eighteen BRCs are being photoionised by the nearby OB star(s).
In this paper we present high resolution molecular line and radio continuum observations toward four clouds (i.e. SFO 58, SFO 68, SFO 75 and SFO 76) from the eighteen photoionised clouds identified in Paper I which displayed the best correlation between the optical, MIR and radio emission and appeared to possess the simplest geometry. These clouds are thus considered ideal candidates for further investigation into the applicability of the RDI star-formation mechanism. From these observations we investigate the internal and external structure of these clouds and calculate their physical parameters, which when combined with archival data will provide a comprehensive picture of star formation within these BRCs and allow us to determine whether or not it could have been triggered.
The structure of this paper is as follows: in Section 2 we briefly describe the morphologies of the BRCs and the HII regions in which they are located, including a summary of any previous observations that have been reported toward them. In Section 3 we describe our observation strategy and the molecular line and radio continuum observations, followed in Section 4 by the observational results and analyses. In Section 5 we discuss the impact the ionisation front has had on the stability, morphology and future evolution of these clouds and try to evaluate the current state of star formation within each cloud and whether it could have been triggered. We present a summary and our conclusions in Section 6.
2 Description of individual BRCs
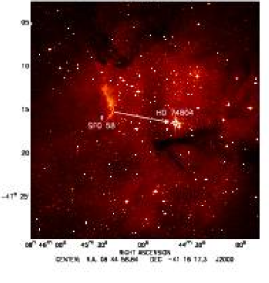
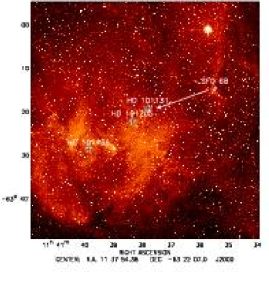
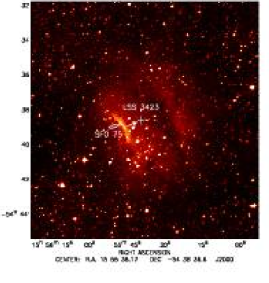
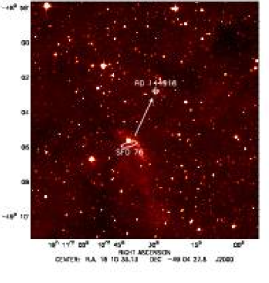
In Figure 1 we present a large scale DSS image of each BRC and the HII region in which they are situated. In these we have indicated the position of the ionising star(s) as identified by Yamaguchi et al. (1999) and the IRAS point source with a cross and an ellipse respectively. In these images it would appear that these BRCs are dense condensations of material that are connected to an extended shell of molecular gas which surrounds the HII region that are beginning to protrude into the HII region as the ionisation front ionises the less dense material around them. An arrow has been added from the centre of each bright rim which points directly toward the ionising star(s). These images clearly show the cloud morphologies to be curved in the general direction of the ionising stars; this is especially evident for SFO 58 and SFO 68. The physical parameters relating to each HII region are presented in Table 1; the distances and spectral types of the ionising star(s) have been taken from Yamaguchi et al. (1999), the age of each HII region has been estimated by calculating their expansion timescale as described by Thompson et al. (2004).
| HII | Distance | Associated | Ionising | Spectral | HII region |
|---|---|---|---|---|---|
| region | (kpc) | BRC | star(s) | type | age (Myr) |
| RCW 32 | 0.7 | SFO 58 | HD 74804 | B0 V | 0.26 |
| RCW 62 | 1.7 | SFO 68 | HD 101131 | O6.5 N | 1.20 |
| HD 101205 | O6.5 | ||||
| HD 101436 | O7.5 | ||||
| RCW 98 | 2.8 | SFO 75 | LSS3423 | O9.5 IV | 0.31 |
| RCW 105 | 1.8 | SFO 76 | HD 144918 | O7 | 0.73 |
| Cloud id. | IRAS id. | IRAS colour type | Luminosity (L⊙) | Spectral type | Mass (M⊙) |
|---|---|---|---|---|---|
| SFO 58 | 08435–4105 | hot cirrus | 140 | B7 V | 4.2 |
| SFO 68 | 11332–6258 | class 0/UC HII | (3400) | (B1–B2) | (10.6) |
| SFO 75 | 15519–5430 | hot cirrus | 34000 | O9.5 | 20.6 |
| SFO 76 | 16069–4858 | class 0/UC HII | 5600 | B1 | 12.2 |
The IRAS point sources can be clearly seen to lie within the cloud, slightly behind the rim with respect to the direction of ionisation. The parameters of the IRAS point sources associated with each BRC are presented in Table 2; the luminosities and classifications of the IRAS colours have been taken from Sugitani & Ogura (1994), the spectral types of the embedded IRAS sources have been estimated using the tables of Panagia (1973) and de Jager & Nieuwenhuijzen (1987) assuming that the IRAS infrared luminosity is due to the presence of a single Zero Age Main Sequence (ZAMS) star, the masses have been estimated using the Lstar M relationship (Allen 1973). Although the assumption that the infrared luminosity of each IRAS point source is due to a single embedded star is a rather crude approximation, it does enable an upper limit to the spectral type of the embedded star to be estimated.
There are a couple of interesting points to note from Table 2. Firstly, three of the four BRCs could possibly harbour Massive Young Stellar Objects (MYSOs), and secondly, two BRCs have IRAS colours consistent with the presence of UC HII regions.
2.1 SFO 58
The BRC SFO 58 is situated on the edge of the HII region RCW 32, which is located at a heliocentric distance of 700 pc (Georgelin et al. 1973). The ionising star of RCW 32 has been identified as HD 74804, a B0 V–B4 II star (Yamaguchi et al. 1999, and references therein), which is located at a projected distance of 1.53 pc from the bright rim of SFO 58.
2.2 SFO 68
SFO 68 is located on the northwestern edge of RCW 62, a bright HII region located approximately 1.7 kpc from the Sun (Yamaguchi et al. 1999). The HII region is driven by three O stars, HD 101131, HD 101205 and HD 101436, which have the spectral types of O6.5, O6.5 and O7.5 respectively (Yamaguchi et al. 1999). At 1.7 kpc the projected distances between SFO 68 and the three ionising stars range between 7.4–14.9 pc, with HD 101131 providing the vast majority of the ionising flux ( %) impinging upon the surface of SFO 68.
SFO 68 has IRAS colours consistent with that of an UC HII region, which has led to SFO 68 being included in several surveys of high-mass star forming regions, such as maser surveys (Braz et al. 1989; MacLeod & Gaylard 1992; Caswell et al. 1995), and molecular line surveys (Zinchenko et al. 1995; Bronfman et al. 1996). H2O, OH (Braz et al. 1989) and 6.7 GHz methanol masers (MacLeod & Gaylard 1992; Caswell et al. 1995) have all been detected toward SFO 68, suggesting the presence of ongoing high-mass star formation within SFO 68. This is supported by the FIR luminosity, from which the presence of a B1–B2 ZAMS star embedded within the cloud can be inferred. The VLSR of the detected maser emission range between 12 and 17 km s-1, which is in good agreement with the VLSR obtained from our CO observations (16.7 km s-1; see Section 4.1).
In addition to the detected masers, a survey of candidate UC HII regions conducted by Bronfman et al. (1996) detected CS(J=2–1) emission toward the IRAS point source embedded within SFO 68. CS is a high density tracer with a critical excitation density threshold between 104–105 cm-3, and therefore confirms the presence of dense gas coincident with the position of the IRAS point source. This CS emission has a VLSR of 15.4 km s-1; similar to our CO velocity, and the velocities measured from the masers, confirms they are dynamically associated with this cloud. Zinchenko et al. (1995) mapped SFO 68 using the CS(J=2–1) transition as well as making single pointing observations toward the molecular peak, identified from the CS map, in the C34S(J=2–1) and 12CO(J=1–0) molecular transition lines. Zinchenko et al. (1995) estimated the main beam temperature and mass of the molecular cloud to be 24 K and 425 M⊙ respectively.
2.3 SFO 75
The bright-rimmed cloud SFO 75 is located on the southeastern edge of the HII region RCW 98. Embedded within SFO 75 is the IRAS point source 15519–5430, which is the most luminous in the SFO catalogue with an FIR luminosity, LFIR L⊙. The surface exposed to the HII region is being ionised by LSS 3423, an O9.5 IV star located 0.61 pc to the northwest. RCW 98 lies at a heliocentric distance of 2.8 kpc (Yamaguchi et al. 1999).
2.4 SFO 76
The exciting star of RCW 105 is HD 144918, an O6 star located at a projected distance of 1.79 pc to the northwest of SFO 76 assuming a heliocentric distance of 1.8 kpc (Yamaguchi et al. 1999). The IRAS point source 16069–4858 is located very close to the rim of the BRC and has an FIR luminosity of 5600 L⊙, and colours consistent with the presence of an UC HII region, which has led to this source being included in many of the same surveys of high-mass star forming regions as SFO 68. However, unlike SFO 68, searches for H2O, OH (Braz et al. 1989; Caswell et al. 1995) and 6.7 GHz methanol masers (Walsh et al. 1997) resulted in non-detections. CS emission has been detected toward SFO 76 (Bronfman et al. 1996), confirming the presence of dense molecular gas coincident with the position of the IRAS point source. The FIR luminosity is consistent with the presence of a single B1 ZAMS star, supporting the identification of this cloud as a high-mass star forming region. However, the non-detection of maser emission suggests that either SFO 76 is at an earlier stage of development than SFO 68, or that it is simply in the process of forming a cluster of intermediate-mass stars.
3 Observations and data reduction
3.1 Survey strategy
Theoretical RDI models (Bertoldi, 1989; Bertoldi & McKee, 1990; Lefloch & Lazareff, 1994) suggest that the pressure balance between the IBL and the molecular gas can be used to identify clouds in which star formation may have been triggered, or is likely to be triggered in the future. A comparison of the internal and external pressures can result in three possible scenarios depending on whether the cloud is (1) over-pressured, (2) under-pressured or (3) in approximate pressure balance with the respect to the IBL. The implications of each of these scenarios are as follows:
-
1.
Over-pressured clouds: the ionisation front is likely to have stalled at the surface of these clouds where it will remain, unable to overcome the internal pressure of the cloud until the pressure in the IBL increases to match that of the molecular cloud. The ionisation front has no dynamical effect on these clouds and therefore is unlikely to have influenced any current, or future, star formation within these clouds.
-
2.
Under-pressured clouds: these clouds are thought to have only recently been exposed to the ionisation front, and although it is highly likely that shocks are currently being driven into these clouds, these shocks have not yet led to the equalisation of the internal and external pressures, leaving the ionisation front stalled at the surface of these clouds. These clouds are thought to be in a pre-pressure balance state. Any current star formation present in these clouds is unlikely to have been triggered and is more likely to be pre-existing.
-
3.
Approximate pressure balance: these clouds are thought to have been initially under-pressured with respect to the ionisation front, however, shocks have propagated through the surface layers compressing the molecular gas, leading to an equalisation of the internal and external pressures, and leaving a dense core in its wake as it continues toward the rear of the cloud. These clouds are said to be in a post-pressure balance state. Models suggest that the star formation within these clouds may have been triggered (Lefloch & Lazareff 1994).
In order to evaluate the state of the pressure balance the physical properties of the ionised and molecular gas need to be measured. A combination of radio continuum and molecular line observations have previously been successfully used to determine the current state of several clouds (e.g. Lefloch et al. 1997; White et al. 1999; Lefloch et al. 2002; Thompson et al. 2004). To build on the models, and these previous observational studies, we have made high resolution molecular line and radio continuum observations of four BRCs.
3.2 CO observations
Observations of the four BRCs were made during June 2003 in the =1–0 rotational lines of 12CO, 13CO and C18O using the Mopra millimetre-wave telescope. Mopra is a 22 metre telescope located near Coonabarabran, New South Wales, Australia.222Mopra is operated by the Australia Telescope National Facility, CSIRO and the University of New South Wales. The telescope is situated at an elevation of 866 metres above sea level, and at a latitude of 31 degrees south.
The receiver is a cryogenically cooled ( 4 K), low-noise, Superconductor-Insulator-Superconductor (SIS) junction mixer with a frequency range between 85–116 GHz, corresponding to a half-power beam-width of 36–33 2″ (Mopra Technical Summary version 10).333Available at http://www.narrabri.atnf.csiro.au/mopra/. The receiver can be tuned to either single or double side-band mode. The incoming signal is separated into two channels, using a polarisation splitter, each of which can be tuned separately allowing two channels to be observed simultaneously. The receiver backend is a digital autocorrelator capable of providing two simultaneous outputs with an instantaneous bandwidth between 4–256 MHz.
For these observations a bandwidth of 64 MHz with a 1024-channel digital autocorrelator was used, giving a frequency resolution of 62.5 kHz and a velocity resolution of 0.16–0.17 km s-1 over the 109–115 GHz frequency range. For the 12CO and 13CO observations the second channel was tuned to 86.2 GHz (SiO maser frequency) to allow pointing corrections to be performed during the observations. However, both bands were tuned to 109.782 GHz for the C18O observations in order to optimise the signal-to-noise ratio. System temperatures were between – K for 12CO and – K for both 13CO and C18O depending on weather conditions and telescope elevation, but were found to be stable over the short time periods required to complete each map, varying by no more than approximately 10 %.444With the exception of the 12CO emission observed toward SFO 58 which suffered from large system temperature variation due to poor weather rendering the 12CO map unreliable. (Only the 13CO map will be presented for this source.) Position-switching was used to subtract sky emission. Antenna pointing checks every two hours showed that the average pointing accuracy was better than 10′′ r.m.s..
| Isotope | Frequency | Velocity res. | Grid | Integration |
|---|---|---|---|---|
| (J=1–0) | (GHz) | (km s-1) | size | time (s) |
| 12CO | 115.271 | 0.162 | 30 | |
| 13CO | 110.201 | 0.170 | 30 | |
| C18O | 109.782 | 0.170 | 120 |
The 12CO and 13CO observations consisted of spectra taken of a pixel grid centred on the cometary head of each cloud, using a grid spacing of 15″. Each grid position was observed for 30 seconds, interleaved with observations at an off-source reference position for 90 seconds after each row of 9 points. The C18O maps consist of a smaller grid of points with the same spacing, and were centred on the molecular peaks identified from the 13CO maps. For each of the C18O grid positions a total integration time of 2 minutes was used. A summary of the observational parameters is presented in Table 3 with the grid centres and off-source reference positions presented in Table 4.
| Cloud | IRAS | Pointing centre | Reference position | ||
|---|---|---|---|---|---|
| id. | id. | (2000) | (2000) | (2000) | (2000) |
| SFO 58 | 08435-4105 | 08:45:25.4 | 41:16:02 | 08:45:26.1 | 41:15:10 |
| SFO 68 | 11332-6258 | 11:35:31.9 | 63:14:51 | 11:24:20.5 | 64:09:56 |
| SFO 75 | 15519-5430 | 15:55:50.4 | 54:38:58 | 16:02:17.6 | 55:19:12 |
| SFO 76 | 16069-4858 | 16:10:38.6 | 49:05:52 | 16:04:09.3 | 48:48:24 |
The measured antenna temperatures, , were corrected for atmospheric absorption, ohmic losses and rearward spillover, by taking measurements of an ambient load (assumed to be at 290 K) placed in front of the receiver following the method of Kutner & Ulich (1981). To correct for forward spillover and scattering, these data are converted to the corrected receiver temperature scale, T, by taking account of the main beam efficiency, B 555Main beam efficiencies have only been accurately determined at 86, 100 and 115 GHz which have efficiencies of 0.49, 0.44 and 0.42 respectively (Ladd et al. 2005). Interpolating from these efficiencies it is easy to show that, although the efficiency is probably not the same at 110 GHz (i.e. 13CO and C18O ) to that at 115 GHz, any difference is smaller that the errors involved. We have therefore adopted the 115 GHz efficiency for all three CO lines. All of the BRCs have angular diameters larger than 80′′, and therefore to take account of the contribution made to the measured intensity from extended material that couples to the error beam, we have used the extended beam efficiency (i.e. ) to correct the 12CO measurements. Absolute calibration was performed by comparing measured line temperatures of Orion KL and M17SW to standard values. We estimate the combined calibration uncertainties to be no more than 10 %.
The ATNF data reduction package, SPC, was used to process the individual spectra. Sky-subtracted spectra were obtained by subtracting emission from the off-source reference position from the on-source data. A correction was made to account for the change in the shape of the dish as a function of elevation. The data have been Hanning-smoothed to improve the signal-to-noise ratio, reducing the velocity resolution to 0.32–0.34 km s-1.
3.3 Radio observations
Centimetre-wave continuum observations were carried out with the Australia Telescope Compact Array (ATCA)666The Australia Telescope Compact Array is funded by the Commonwealth of Australia for operation as a National Facility managed by CSIRO. between June 2002 and September 2003. ATCA is located at the Paul Wild Observatory, Narrabri, New South Wales, Australia. The ATCA consists of 622 metre antennas, 5 of which lie on a 3 km east-west railway track with the sixth antenna located 3 km farther west. Each antenna is fitted with a dual feedhorn system allowing simultaneous measurements of two wavelengths, either 20 & 13 cm or 6 & 3.6 cm. Additionally, during a recent upgrade, 12 and 3 mm receivers were installed allowing observations at 20 and 95 GHz respectively. The 6/3.6 cm receiver system was used for the observations of SFO 58, SFO 68 and SFO 76, while observations of SFO 75 were carried out using the new 12 mm receivers. A summary of the observational parameters is presented in Table LABEL:tbl:radio_observations.
| Cloud | Wavelength | Phase centre | Array | Integration | Phase | |
|---|---|---|---|---|---|---|
| id. | (cm) | (J2000) | (J2000) | configurations | time (hrs) | calibrators |
| SFO 58 | 6/3.6 | 08:45:25.4 | 41:16:02 | 750/352/214 | 36 | 0826–373 |
| SFO 68 | 6/3.6 | 11:35:31.9 | 63:14:51 | 750/352/367 | 18 | 1129–58 |
| SFO 76 | 6/3.6 | 16:10:38.6 | 49:05:52 | 750/352/367 | 18 | 1613–586 |
| SFO 75 | 1.3 | 15:55:50.4 | 54:38:58 | 352 | 12 | 1613-586 |
The 6/3.6 cm observations of SFO 58, SFO 68 and SFO 76 were made at two different frequency bands centred at 4800 and 8309 MHz using bandwidths of 128 and 8 MHz respectively. The second frequency was observed in spectral band mode (using a total of 512 channels, giving a frequency resolution of 15.6 kHz) in order to observe the H92 radio recombination line, however, this proved too faint to be detected toward all three clouds. Each source was observed using three separate configurations over a twelve hour period for SFO 58, and six hours each for SFO 68 and SFO 76 (split into 840 minute observations spread over a 12 hour period to optimise u-v coverage).
Observations of SFO 75 were made using the 12 mm receivers centred at 23569 MHz ( cm) and used a bandwidth of 128 MHz. SFO 75 was observed for a total of 12 hours in a single configuration.
To correct these data for fluctuations in the phase and amplitude caused by atmospheric and instrumental effects, a phase calibrator was observed for two minutes after approximately every 40 minutes of on-source integration ( 15 minutes for SFO 75 due to the atmosphere being less stable at higher frequencies). The primary flux calibrator, 1934–638, was observed once during each set of observations to allow for the absolute calibration of the flux density. To calibrate the bandpass the bright point source 1921–293 was also observed once during each set of observations. The phase centres, array configurations, total integration time and phase calibrators are tabulated in Table LABEL:tbl:radio_observations.
The calibration and reduction of these data were performed using the MIRIAD reduction package (Sault et al. 1995) following standard ATCA procedures. The data were CLEANed using a robust weighting of 0.5 to obtain the same sensitivity as natural weighting, but with a much improved beam-shape and lower sidelobe contamination, with the exception of the 3.6 cm data for SFO 58 and SFO 68. Using a robust weighting of 0.5 for these two clouds resulted in poorer imaging of the large scale structure of the ionised gas surrounding their bright rims. (The smaller bandwidth used for the 3.6 cm observations results in these images being a factor of three less sensitive than the 6 cm observations.) For the 3.6 cm data for SFO 58 and SFO 68 a robust weighting of 1 was used, resulting in a slight loss of resolution but improved sensitivity. The data obtained from baselines which included the 6th antenna were found to distort the processed images (due to the large gap in u-v coverage at intermediate baselines) and so were excluded from the final images. There are three calibration errors that need to be considered: absolute flux calibration, r.m.s pointing errors and the lack of short baselines. The uncertainties introduced by the first two of these are no more than a few percent each. The shortest baseline for all of these radio observations was 31 metres, and therefore flux loss due to short baselines is not considered to be significant. The combined uncertainty is estimated to be no more than 10 %.
4 Results and analysis
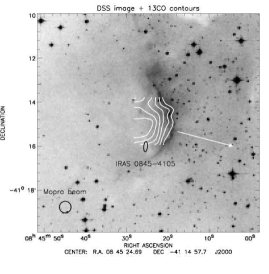
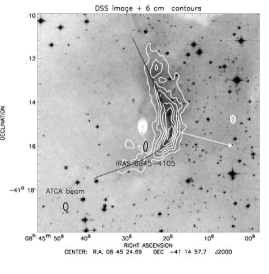
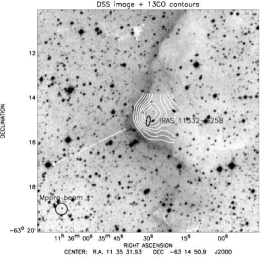
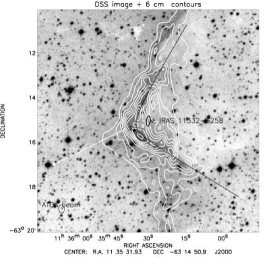
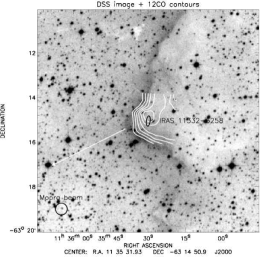
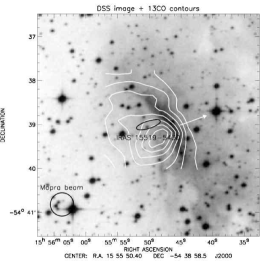
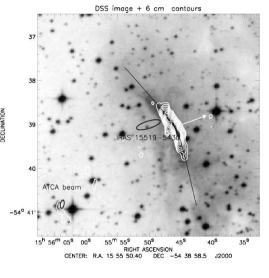
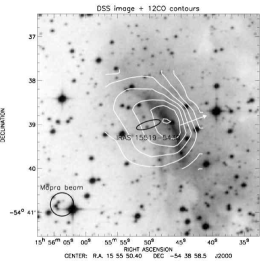
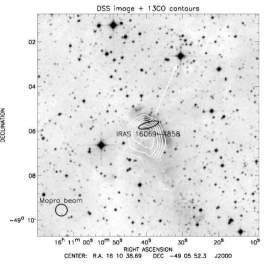
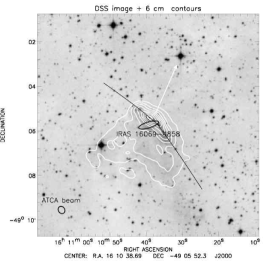
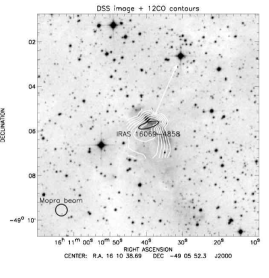
In Figures 2–5 we present plots of the integrated 13CO (upper left panel), 12CO (lower left panel), radio continuum emission (upper right panel) contoured over a DSS image of the BRC and surrounding region. These images reveal a strong spatial correlation between the distribution of both the molecular and ionised gas with the optical morphology of the bright rims.
The molecular gas traced by the 12CO and 13CO contours displays a similar morphology, both tightly correlated within the rim of the cloud and with a steep intensity gradient decreasing toward the HII region. The steep intensity gradient is possibly a consequence of shock compression of the molecular gas which is swept up in front of the expanding ionisation front and accelerated into the cloud, consistent with the predictions of RDI. The 13CO emission reveals the presence of a dense molecular core embedded within every BRC, set back slightly from the bright rim of the cloud with respect to the direction of the ionising star(s). All of the molecular cores appear to be centrally condensed, which suggests they may be gravitationally bound, or have a gravitationally bound object embedded within them, such as a protostar.
There is an interesting difference between the spatial distribution of 12CO and 13CO emission toward SFO 75. The peak of the integrated 12CO emission detected toward SFO 75 is correlated with the position of the bright rim of the cloud, and is slightly elongated in a direction parallel to the morphology of the rim, whereas the integrated 13CO emission peaks farther back within the molecular cloud and is elongated in a direction perpendicular to the rim. There are a few possible explanations that should be considered: heating of the surface layers of the cloud by the FUV radiation field, the ionisation front is preceeded by a PDR, which could sharpen the 12CO emission, or that the cloud is angled to the line of sight and that we are seeing the body of the cloud through the bright rim.
The morphology of the radio and optical emission seen toward all four clouds shows the rims to be curving directly away from the ionising star(s), starting to form the typical cometary structure seen toward more evolved BRCs (e.g. the Eagle nebula). The presence of radio emission and its tight correlation with the morphology of the rim strongly supports the hypothesis that an IBL is present between the ionising star(s) and the molecular material within these BRCs. In addition to the IBL, the radio emission image of SFO 58, also reveals the presence of a compact radio source within the optical boundary of the cloud, which is coincident with the position of the molecular core identified in 13CO image, possibly indicating the presence of an UC HII region within this cloud.
The radio images were analysed using the visualisation package kvis (part of the karma image analysis suite (Gooch 1996). The image parameters and measurements of the peak and source integrated emission are summarised in Table 6.
| Cloud | Restoring | Position | Peak | Integrated | Source-averaged | Image | |
|---|---|---|---|---|---|---|---|
| id. | beam | angle | emission | emission | emission | r.m.s. noise | |
| (cm) | (arcsec) | (degrees) | (mJy/beam) | (mJy) | (mJy/beam) | (mJy/beam) | |
| SFO 58 | 3.6 | 2.8 | 2.66 | 23.1 | 1.33 | 0.11 | |
| 6 | 1.7 | 2.38 | 38.5 | 1.44 | 0.10 | ||
| SFO 68 | 3.6 | 7.5 | 5.22 | 69.3 | 1.63 | 0.17 | |
| 6 | 10.42 | 6.36 | 151.1 | 2.97 | 0.16 | ||
| SFO 76 | 3.6 | 50.1 | 9.84 | 195.4 | 1.74 | 0.25 | |
| 6 | 35.4 | 20.82 | 255.7 | 6.99 | 0.30 | ||
| SFO 75 | 1.3 | 9.2 | 3.39 | 30.3 | 0.53 | 0.20 |
The IRAS point sources within SFO 68, SFO 75 and SFO 76 are located slightly behind the ionisation front, with respect to the ionising star(s), and toward the centre of the bright rim, where one would expect photoionisation induced shocks to focus molecular material, and where the RDI models predict the cores to form (Lefloch & Lazareff 1994). The positions of the 13CO peak emission and the IRAS point source seen toward SFO 58 (Figure 2) are not so well correlated; the IRAS point source is located approximately 1′ to the south of the molecular peak. It is possible that the IRAS point source is unrelated to the molecular core detected, but is associated with another core which has formed on the edge of the molecular cloud, however, considering the positional correlation of the 13CO core with the compact radio source and taking account of the pointing errors, size of the IRAS beam ( at 100 m), and the positional inaccuracy of the IRAS point source, we do not consider the displacement between the IRAS point source and the centre of the 13CO core to be significant.777Comparing the positions of dense cores identified from ammonia maps of the Orion and Cepheus clouds with the positions of their associated IRAS sources Harju et al. (1993) found that they could be offset from each other by up to 80′′.
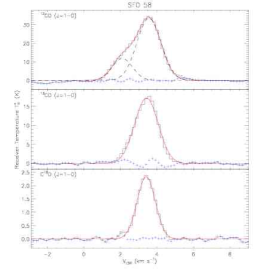
4.1 Physical parameters of the cores
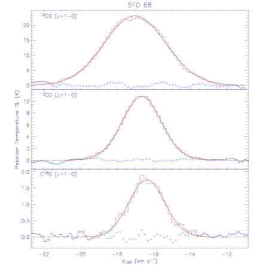
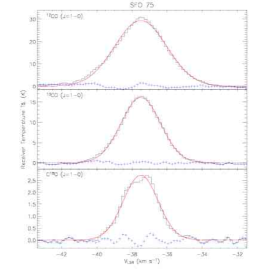
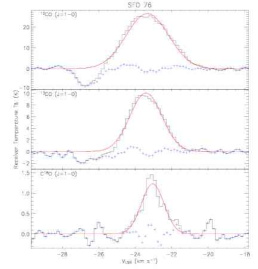
The angular size of each of the four molecular cores was estimated from the FWHM of azimuthally averaged 13CO intensity maps. Averaging all spectra within the derived angular size of each core, a source-averaged spectrum was produced for each of the three molecular lines; these spectra are presented in the lower right panels of Figures 2–5. We note that the baseline for SFO 76 is poor due to the fact that the reference position was found to contain emission at a nearby velocity (i.e. 26.5 km s-1) to the main line.
Gaussian profiles were fitted to the core-averaged spectra of each core to determine the emission peak, FWHM line width and VLSR for each spectral line. These values are listed in Table 7 along with the central position of each core derived from a 2D Gaussian fit to the 13CO emission map. The measured VLSR of each source was compared to those reported by Yamaguchi et al. (1999) and found to agree to better than 2 km s-1, with the exception of SFO 76. For this source Yamaguchi et al. (1999) reported a VLSR of 37 km s-1 compared to our measurement of 23 km s-1. The VLSR obtained from our CO observations compares well with that reported by Bronfman et al. (1996) from CS observations toward SFO 76 (i.e. 22.2 km s-1). It is therefore unclear why there is such a large disagreement between the VLSR reported by Yamaguchi et al. (1999) and that reported in this survey for SFO 76.
Comparisons between the 12CO lines and other isotopomers for each core reveal no significant variations in the kinematic velocities of the emission peaks for either SFO 75 or SFO 76. However, inspection of the SFO 58 source-averaged 12CO spectrum shows evidence of a blue wing component not present in either the 13CO or C18O spectra (this spectrum was best fitted by two Gaussian components). Comparing the source-averaged 12CO spectrum of SFO 68 to the 13CO and C18O spectra reveals a small shift in velocity, which suggests the presence of a broad blue wing. There are several physical phenomenon that could give rise to these observed line wings such as: another cloud on the line of sight, a signature of shock compressions in the surface layers, or the presence of a protostellar outflow.
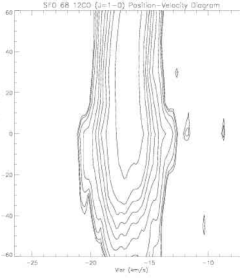
In order to try to determine the source of these blue wings and to look for kinematic signatures of shocks we produced channel maps and position-velocity diagrams of the 12CO emission for each cloud. Only the position-velocity diagram produced for SFO 68 shows any evidence of a large scale velocity gradient, revealing the presence of moderate velocity wing components with a FWHM 8 km s-1(see Figure 6); these can either be attributed to a protostellar outflow, or could be tracing the compression/expansion motions of the surface layers of a collapsing cloud. The spatially localised wings seen in the position-velocity diagram are more suggestive of a bipolar outflow, however, our observations do not have either the mapping coverage or the angular resolution necessary to be able to spatially resolve the red and blue outflow lobes that would confirm the presence of an outflow.
The nature of the blue wings is at present unclear, however, taking into account the presence of a UC HII region within SFO 58 (see Section 4.4) and the association of SFO 68 with methanol, OH and H2O masers – both of which are strong indications of ongoing star formation – we consider the protostellar outflow hypothesis to be the most likely. We must stress that these are only tentative detections and further observations are required to confirm the presence of protostellar outflows in these two sources.
| Cloud id. | Core position | Molecular | VLSR | Peak T | FWHM | |
| (J2000) | (J2000) | line | (km s-1) | (K) | (km s-1) | |
| SFO 58 | 08:45:26 | 41:15:10 | 12CO | 2.1 | 11.9 | 1.3 |
| 3.6 | 33.7 | 1.51 | ||||
| 13CO | 3.4 | 17.3 | 1.5 | |||
| C18O | 3.4 | 2.4 | 1.2 | |||
| SFO 68 | 11:35:31 | 63:14:31 | 12CO | 17.1 | 23.0 | 4.0 |
| 13CO | 16.7 | 10.8 | 2.5 | |||
| C18O | 16.4 | 1.8 | 2.3 | |||
| SFO 75 | 15:55:49 | 54:39:13 | 12CO | 37.5 | 29.4 | 3.5 |
| 13CO | 37.5 | 16.1 | 2.6 | |||
| C18O | 37.5 | 2.7 | 2.3 | |||
| SFO 76 | 16:10:40 | 49:06:17 | 12CO | 23.3 | 26.4 | 2.7 |
| 13CO | 23.4 | 10.1 | 2.1 | |||
| C18O | 23.0 | 1.2 | 1.5 | |||
The optically thin transitions of C18O, and the moderately optically thick ( 1) 13CO, were used to determine the optical depth, gas excitation temperature and C18O column density following the procedures described by Urquhart et al. (2004) using the following equations
| (1) |
where and can be either the corrected antenna or receiver temperatures, and and are the optical depths of the 13CO and C18O transitions respectively. The optical depths are related to each other by their abundance ratio such that = X, where X is the 13CO/C18O abundance ratio. To estimate the 13CO/C18O abundances we first need to estimate 12C/13C abundances for all four clouds. The galactocentric distances for each source lie between 6.5 and 8.5 kpc, which were compared to the 12C/13C gradient measured over the Galactic disk by Langer & Penzias (1990). This gives a 12C/13C ratio range of between 45-55, and therefore a value of 50 was adopted for the 12C/13C ratio. Assuming the abundance of 16O/18O in all of the sources to be similar to solar system abundances (i.e. 500; Zinner 1996), gives a 13CO/C18O abundance ratio of 10.
The gas excitation temperature was estimated using the optically thin C18O line in the following equation,
| (2) |
where is the corrected receiver temperature and is the background temperature assumed to be 2.7 K. We have assumed the cores are in Local Thermodynamic Equilibrium (LTE) and can therefore be described by a single temperature (i.e. ). The derived core temperature and optical depth are related to the column densities, (cm-2), through the following equation,
| (3) |
where is the FWHM of the C18O line, and T are as previously defined. To convert the C18O column densities to H2 column densities a fractional abundance of (C18O/H2) = (Goldsmith et al. 1996) was assumed. The H2 number density was calculated assuming the cores to be spherical, and that contamination effects from emission along the line of sight can be neglected. The total mass (M⊙) was estimated by multiplying the volume densities of each core by the total volume using,
| (4) |
where R is the radius of the core (pc), n is the molecular hydrogen number density (cm-3), is the mean molecular weight (taken to be 2.3, assuming a 25 % abundance of helium by mass), and mH is the mass of a hydrogen atom. The physical parameters for the molecular cores calculated from the 13CO and C18O data are summarised in Table 8. We estimate the uncertainties involved in the estimate of the column density to be no more than 50 %. In estimating the density we have considered the additional uncertainties in the distance to the cores and in the assumptions that the cores are spherical. Taking these additional uncertainties into account we estimate the mass and density calculated to be accurate to within a factor of two.
| Cloud | VLSR | T | Log(N) | Log(n) | Angular | Physical | Mass | |
|---|---|---|---|---|---|---|---|---|
| id. | (km s-1) | (K) | (cm-2) | (cm-3) | size (″) | diameter (pc) | (M⊙) | |
| SFO 58 | 3.4 | 0.07 | 37.0 | 22.53 | 4.89 | 47 | 0.16 | 9.5 |
| SFO 68 | 16.7 | 0.06 | 29.4 | 22.51 | 4.36 | 68 | 0.46 | 66.4 |
| SFO 75 | 37.5 | 0.13 | 23.5 | 22.75 | 4.53 | 41 | 0.56 | 177.3 |
| SFO 76 | 23.3 | 0.05 | 26.7 | 22.26 | 4.06 | 59 | 0.52 | 48.1 |
The physical parameters of the cores are similar, with the densities ranging between 104–105 cm-3, the physical diameters varying between 0.2–0.6 pc, kinetic temperatures ranging from 24 to 37 K, and masses from 10–180 M⊙. The temperature of all of the cores are significantly higher than would be expected for starless cores (T 10 K; Evans 1999), which suggests these cores possess an internal heating mechanism, possibly a YSO, or an UC HII region (as indicated by the IRAS colours; see Table 2). It is possible these cores are being heated by the surrounding FUV radiation field, however, if that were the case, we would expect to find a temperature gradient that peaked at the position of the bright rim and decreased with distance into the cloud, but this is not observed.
4.2 Physical parameters of the ionised boundary layers
Using the radio emission detected toward the rims of SFO 58, SFO 68, SFO 75 and SFO 76 we can quantify the ionising photon flux impinging upon them. Making the assumption that all of the ionising photon flux is absorbed within the IBL we can determine the photon flux, (cm-2 s-1), and the electron density, ne (cm-3), using the following equations which have been modified from Equations 2 and 6 of Lefloch et al. (1997) (see Paper I for details):
| (5) |
| (6) |
where is the integrated flux density in mJy, is the frequency at which the integrated flux density is evaluated in GHz, is the angular diameter over which the flux density is integrated in arc-seconds, R is the shell thickness in pc, and Te is the electron temperature in K. Note, an average HII region electron temperature of 104 K and = 0.2 (Bertoldi 1989) have been assumed.
The values calculated for the ionising photon fluxes, and electron densities within the IBLs of the four clouds, are presented in Table 9. The main uncertainties in these values are due to flux calibration ( %), the approximation of the electron temperature, K (e.g. a difference in the electron temperature of 2000 K corresponds to an uncertainly in the photon flux of 25 %), and the . The uncertainties in flux calibration and electron temperature combine to give a total uncertainty in the calculated photon fluxes and electron densities of no more than 30 %. However, approximating leads to the the electron density being underestimated by at most a factor of , and since the uncertainty in dominates the others it effectively sets a lower limit for the electron density.
| Cloud | Photon fluxes (108 cm-2 s-1) | Electron densities (cm-3) | |||
| id. | Predicted | Peak | Mean | Peak | Mean |
| SFO 58 | 20.4 | 31.9 | 19.3 | 338 | 262 |
| SFO 68 | 126.0 | 68.5 | 32.0 | 341 | 233 |
| SFO 75 | 448.0 | 257 | 40.0 | 839 | 332 |
| SFO 76 | 441 | 263.1 | 46.5 | 1242 | 526 |
Predicted ionising fluxes were calculated from the Lyman flux of the candidate ionising stars and their projected distances to the clouds following the method described in Paper I. Comparing the predicted fluxes to the measured fluxes, and taking into account any attenuation between the OB star(s) and the clouds, we find good agreement (to within a factor of two). In the majority of cases the measured fluxes at the surface of the BRCs are lower than the predicted flux, which is to be expected, as the predicted flux is a strict upper limit. The one notable exception to this is SFO 58 where the measured flux is a factor of one and half times greater than the predicted upper limit. There are two possible explanations for this discrepancy: the spectral type of the ionising star is incorrect, or the distance to the HII region is incorrect. We favour the former as a misclassification of the ionising star’s spectral type by even half a spectral class can alter its predicted Lyman flux by up to a factor of two, which would more than account for the difference in fluxes reported here.
The high resolution radio observations result in a much tighter correlation between the predicted and measured fluxes than were found with the low angular resolution data presented in Paper I. The variation between measured and predicted fluxes for the low resolution data for these four clouds ranged from a factor of a few to more than ten (in the case of SFO 58). Moreover, the analysis of the distribution of radio emission suggests that two sources (SFO 68 and SFO 76) lie in the foreground relative to the locations of the ionising star(s), and thus are located farther from the ionising star(s) than the projected distance, used to derive the predicted flux, would suggest. In these two cases the correlation could be considerably better than the factor of two quoted above.
The main reason for the improved correlation between the predicted and measured fluxes is because the higher resolution observations have been able to resolve the radio emission, resulting in the detected emission being much more tightly peaked. This has allowed more accurate measurements of the flux density to be obtained, and consequently more realistic values for the ionising fluxes and electron densities to be calculated. Values calculated from the low resolution observations presented in Paper I suffer due to the large size of the synthesised beams (typically 90″ and 60″ for the 20 cm + 6 cm and 13 cm + 3 cm observations respectively) which dilutes the emission if the IBL is not resolved, resulting in significantly lower flux densities being measured. This explains why, in every case, the high resolution radio observations have resulted in an increase in the calculated ionising fluxes. Another reason is the vast improvement in the u-v coverage obtained by using multiple array configurations, which allows the brightness distribution of the emission to be more accurately deconvolved from the visibility data. Therefore, although low resolution radio observations may be useful in identifying clouds that are likely to possess an IBL and are thus subject to photoionisation from the nearby OB star(s), their main use is to limited to the determination of global estimates for the physical parameters of the IBLs.
The mean electron densities calculated for each cloud range between 233–526 cm-3, considerably greater than the critical value of n 25 cm-3 above which an IBL is able to develop around the cloud (Lefloch & Lazareff 1994). The excellent correlation of the radio emission with the bright-rim of the clouds strongly supports the presence of an IBL at the surface of each of these clouds, confirming their identification as potential triggered star forming regions. It is therefore clear that these clouds are being photoionised by the nearby OB star(s), however, it is not yet clear to what extent the ionisation has influenced the evolution of these clouds, and what part, if any, it has played a part in triggering star formation within these clouds.
4.3 Evaluation of the pressure balance
In this section the results of the molecular line and radio observations will be used to evaluate the pressure balance between the hot ionised gas of the IBLs, and the cooler neutral gas within the BRCs. Following the method described in Paper I we calculated the internal () and external () pressures (N cm-2) using,
| (7) |
| (8) |
where is the square of the velocity dispersion (i.e. ), where is the core-averaged C18O line width (km s-1)), is the core-averaged density calculated in Section 4.1, and are the ionised gas density and sound speed (assumed to be 11.4 km s-1) respectively. The external pressure term includes contributions from both thermal and ram pressure. The electron densities calculated in Section 4.2 were used to estimate the ionised gas pressures for each cloud’s IBL. The calculated internal and external pressures are presented in Table 10.
| Cloud | Pressure () ( cm-3 K) | |
|---|---|---|
| id. | Internal () | External () |
| SFO 58 | 5.3 | 7.8 |
| SFO 68 | 4.4 | 7.0 |
| SFO 75 | 9.1 | 26.5 |
| SFO 76 | 1.2 | 15.7 |
The largest two uncertainties in the calculation of the molecular pressure are: the uncertainty in the observed line temperature, and the possibility that the C18O derived density may be affected by depletion, either onto dust grain ice mantles, or through selective photo-dissociation. The uncertainties in the densities are thought to be no more than a factor of two, the effects of depletion and photo-dissociation are harder to quantify. However, all of the core temperatures are considerably larger than 10 K, where depletion is expected to be greatest, and given that they are embedded within the clouds, away from the ionisation front, where they are shielded from much of the ionising radiation, these effects are not thought to be significant. We estimate the molecular pressures presented to be accurate to within a factor of two. The IBL pressures are lower limits (due to the electron densities being lower limits) and taking account of the uncertainties are considered to be accurate to 30 %.
As discussed in Section 3.1 theoretical models (Bertoldi 1989; Lefloch & Lazareff 1994) have revealed the pressure balance to be a sensitive diagnostic that can be used to determine the evolutionary state of BRCs. Comparing the internal and external pressures calculated from the molecular line and radio observations (presented in Table 10), reveals that all of the clouds are under pressured with respect to their IBLs, and are thus in the process of having shocks driven into them. However, taking account of the possible factor of two uncertainty in our calculations of these parameters, it is possible that two of these clouds are in approximate pressure balance (i.e. SFO 58 and SFO 68); these clouds are likely to be in a post-pressure balance state, and it is therefore possible that any current, or imminent, star formation within these clouds could have been triggered.
The remaining two clouds, SFO 75 and SFO 76, are under-pressured by factors of three and twelve respectively, with respect to their IBLs, strongly suggesting that these clouds have only recently been exposed to the HII region and that shocks are currently being driven into the surface layers of these clouds, closely followed by a D-critical ionisation front. These clouds are likely to be in a pre-pressure balance state where the shocks have not propagated very far into the surface layers; it is therefore unlikely that the molecular cores within these two clouds have been formed by RDI, but are more likely to pre-date the arrival of the ionisation front and have only recently been exposed to the HII region. Any current star formation taking place within these clouds is unlikely to have been triggered.
4.4 Compact radio source associated with SFO 58
The 6 cm radio continuum image (see upper left panel Figure 3) of SFO 58 clearly shows the presence of a radio source positionally coincident with the 13CO core embedded within this BRC, both of which lie at the focus of the BRC where the photoionisation induced shock is expected to concentrate the majority of the mass within the cloud. The radio source and embedded 13CO core are offset from the IRAS point source, but their positional correlation hints at a possible association between the two. At a distance of 700 pc the angular size of the compact radio source ( 18″) corresponds to a physical diameter of 0.06 pc, which suggested it might be a compact HII region similar to those found within other BRCs reported in Paper I (i.e. SFO 59, SFO 62, SFO 74, SFO 79 and SFO 85; see Urquhart et al. 2004 for a detailed investigation of SFO 79).
The radio flux of the compact radio source is consistent with the presence of a single embedded B2–B3 ZAMS star. Furthermore, the correlation of the position of the radio source with that of the molecular core detected in the CO observations, both of which are located at the focus of the bright rim (see Figure 2), offer some circumstantial support for this hypothesis. However, it is possible that the presence of the radio source is an unfortunate alignment of the cloud with an extragalactic background source. To try to determine the nature of this radio emission we attempted to calculate the spectral index () of the emission using the integrated flux at both frequencies (i.e. ), however, this proved inconclusive due to the poor sensitivity of the 3.6 cm map. We therefore tentatively identify this compact radio source as a possible compact HII region embedded within SFO 58.
| Position | (J2000) = 08:45:26 |
|---|---|
| (J2000) = 41:15:06 | |
| Source size | 18″ |
| Physical diameter | pc |
| 3.6 cm flux density | 1.69 mJy |
| 6 cm flux density | 2.28 mJy |
| log(Ni) | 44.0 photon s-1 |
| Spectral type | ZAMS B2–B3 |
5 Discussion
Whilst a full hydrodynamic analysis is beyond the scope of this paper, an insight into the potential effect that exposure to the FUV radiation field has had upon the stability of the cores can be gained from a simple static analysis. Additionally, we will estimate the lifetime of these clouds in the light of the continued mass loss through photo-evaporation by the nearby OB star(s), and evaluate its effect on future star formation within these clouds.
5.1 Gravitational stability of the cores pre- and post-exposure of the clouds to UV radiation
To investigate the effect that the arrival of the ionisation front has on the stability of the cores we need to compare the stability of the cores while they were still embedded within their parental molecular cloud to that of the cores once exposed to the FUV radiation field. In the following analysis we implicitly assume that the cores pre-date the arrival of the ionisation front (as shown in the previous section, this is certainly likely for the cores embedded with SFO 75 and SFO 76), and that there was negligible external pressure from the surrounding molecular material.
The pre-exposure stability of the cores can be estimated using the standard virial equation to derive the virial mass, (M⊙). Comparing these masses with the core masses calculated from the CO data will give an indication of their pre-exposure stability. The virial mass can be calculated using the standard equation (e.g. Evans 1999),
| (9) |
where Rcore is the core radius (pc) measured from the integrated 13CO maps, is the FWHM line width of the C18O line (km s-1). The results are presented in Table 12 with the core masses derived from the CO observations. Comparing the calculated masses of each core with their virial mass, it is clear that three cores were gravitationally stable against collapse while still embedded within their parental molecular cloud, however, taking the errors into account it is possible that SFO 75 was close to being unstable to gravitational collapse.
Now the effect of exposure to the FUV radiation field of the HII region will be examined. This will be estimated
using a modified version of the virial mass (i.e. the Bonnor Ebert approach) that takes account of the external
pressure of the surrounding medium, in this case the pressure of the IBL. Following the notation of
Thompson et al. (2004), this pressure-sensitive virial mass will be referred to as the pressurised virial
mass, (M⊙), given as,
| (10) |
where (N m-2) is the pressure of the ionised gas within the IBL, G is the gravitational constant, and is in km s-1. The calculated values for the pressurised virial masses are presented in Table 12.
This equation is sensitive to the accuracy of the measured line width, and taking into account the errors involved with Gaussian fits to the spectral lines, the calculated values for the pressurised virial masses are considered to be accurate to within a factor of two (Thompson et al. 2004). In this case it was assumed that the external pressure acts over the entire surface of the core, not just the side illuminated by the OB star, and that the cores were pre-existing cores recently uncovered by the expansion of the ionisation front. This is a rather simplistic approach but does allow the effect that exposure to the FUV radiation has on the stability of the cores to be investigated.
| Cloud | Lifetime | ||||
|---|---|---|---|---|---|
| id. | (M⊙) | (M⊙) | (M⊙) | (M⊙ Myr-1) | (Myr) |
| SFO 58 | 9.5 | 24.2 | 10.7 | 14.9 | 0.64 |
| SFO 68 | 66.4 | 255.5 | 152.2 | 58.6 | 1.13 |
| SFO 75 | 177.3 | 311.1 | 78.2 | 64.6 | 2.75 |
| SFO 76 | 48.1 | 122.8 | 18.4 | 12.6 | 3.80 |
Comparing the values for the virial and pressurised virial masses shows that exposure to the FUV radiation field dramatically reduces the mass above which the clouds become unstable against gravitational collapse. The difference between the virial and pressurised viral masses range from a factor of 2 (i.e. SFO 58 and SFO 68) to a factor of 7 for SFO 76. Taking account of the errors involved in this analysis, only differences of a factor of four or larger are significant. We are therefore unable to determine if exposure to the FUV radiation has had an impact on the stability of SFO 58 or SFO 68, however, it is clear that the exposure is likely to have had a significant impact on the stability of SFO 75 and SFO 76. Moreover, comparing the pressurised virial masses of the cores with those estimated from the CO data reveals that SFO 75 and SFO 76 are both more than a factor of two more massive than the critical pressurised viral mass. It is therefore likely that the exposure of these two cores to their respective HII regions has rendered them unstable against gravitational collapse. However, detailed hydrodynamical or radiative transfer modelling (e.g. Thompson & White 2004; De Vries & Myers 2005) of higher signal-to-noise molecular line data are needed to investigate the presence of collapse motions in these clouds.
5.2 Eventual fate of the BRCs
Once a cloud has reached the cometary stage the shocks dissipate, however, the cloud’s mass continues to be slowly eroded away as the D-type ionisation front continues to propagate into it (Lefloch & Lazareff 1994). In this situation the propagation of the ionisation front leads to a constant mass loss in the form of a photo-evaporated flow into the HII region (Megeath & Wilson 1997). The amount of material within the boundary of a cloud is finite, and thus the effect of the ionisation is to slowly erode the limited reservoir of material available for star formation. This mass loss eventually results in the total ionisation and dispersion of the cloud, and perhaps the disruption of ongoing star formation either by disrupting any molecular cores before the accretion phase has begun, or by exposing the protostar to the FUV radiation field before the accretion phase has finished. Once the protostar has been exposed much of the surrounding envelope of molecular material becomes ionised, therefore limiting the possible size of the forming protostar (see Whitworth & Zinnecker 2004). Therefore the mass loss rate is an important parameter that can help determine the effect photoionisation has on current, and future star formation within BRCs, and in estimating their lifetime.
To evaluate the mass loss we use Equation 36 from Lefloch & Lazareff (1994) which relates the mass loss (M⊙ ) to the ionising flux illuminating the cloud ( photons cm-2 s-1), i.e.
| (11) |
The globally averaged photon flux calculated in Section 4.2 and the cloud radii presented in Paper I were used to estimate the mass loss rate for each cloud using Equation 11; these values are presented in Table 12 along with an estimate for the lifetime of each cloud. The BRC mass loss rates range between 12–59 Myr-1, corresponding to cloud lifetimes from as little as yr to several Myr.
The accretion phase of protostar formation is known to last for several 105 yr (Andre et al. 2000). Therefore any ongoing, or imminent, star formation within SFO 58, SFO 68, SFO 75 and SFO 76 will be unaffected by the ionisation and mass loss, especially SFO 68 where the star formation already appears to be well developed and unlikely to be affected by the mass loss experienced by the cloud. However, the future star formation within SFO 58 may be adversely affected as the ionisation front propagates into the cloud. Although there is no evidence of any current star formation taking place within either SFO 75 or SFO 76, we have shown these clouds are likely to be undergoing RDI as well as having sufficiently long lifetimes for RDI to be a viable method of triggered star formation.
5.3 Star formation and the evolution of the BRCs
Direct evidence of whether star formation within these clouds has been triggered is not readily available, however, it is possible to investigate the probability that the star formation has been triggered by considering the circumstantial evidence. It is interesting to note that there is strong evidence for the presence of ongoing star formation within the two clouds (SFO 58 and SFO 68) that fall into the post-pressure balance cloud category, such as the molecular outflows (see Section 4.1), association with OH, H2O and methanol masers (Braz et al. 1989; MacLeod & Gaylard 1992; Caswell et al. 1995, i.e. SFO 68) and the possible association with an embedded UC HII region (Section 4.4, i.e. SFO 58). Moreover, the association of the UC HII region with SFO 58 and of H2O and methanol masers with SFO 68 — which are respectively and almost exclusively associated with Class 0 protostars (Furuya et al. 2001) and high-mass star formation (Minier et al. 2003) — lead us to conclude that the star formation within these two clouds is relatively recent, being no more than a few 105 years old. Contrary to the evidence of recent high-mass star formation within the post-pressure balanced clouds we find no evidence for any ongoing star formation within either of the two pre-pressure balance clouds (SFO 75 and SFO 76), short of the presence of the embedded IRAS point source.
If, as suggested by the RDI models (e.g. Lefloch & Lazareff 1994; Vanhala & Cameron 1998) and observations (e.g. Sugitani et al. 1991), that rim morphologies represent an evolutionary sequence (see Figure 7), we should expect to find clouds at similar stages of evolution to exhibit similar physical parameters, and furthermore, the star formation within clouds at different evolutionary states to be at different stages of development. It is therefore useful to compare the observational results to the evolutionary sequence predicted by the models to investigate any differences in the star formation within clouds with different rim morphologies. However, we must point out that the boundary conditions of where the clouds meet the larger-scale molecular material are very important and may affect the following analysis.
To emphasise the morphology of each rim a black curved line has been fitted (by eye) to the radio contours following the minimum gradient of the emission (see upper right panel of Figures 2–5). The four clouds separate quite nicely into two morphological groups after comparison of the rim morphologies presented in Figure 7. SFO 58 and SFO 68 are typical of a type A rim morphology, whereas SFO 75 and SFO 76 show only slight curvature intermediate between type A and type 0.
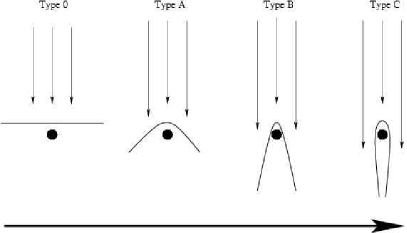
Comparing these rim morphologies with those predicted by the RDI models of Lefloch & Lazareff (1994) we find that SFO 75 and SFO 76 closely resemble the 0.036 My and SFO 58 and SFO 68 closely resemble the 0.126 My snapshots (i.e. Figure 4a and b of Lefloch & Lazareff (1994)). This comparison should be viewed with caution as the Lefloch & Lazareff models were calculated for a simple cloud with specific ionising fluxes and so the absolute timescales are more than likely invalid for our ensemble of BRCs. However the comparison between individual clouds and their relative model ages does support our conclusion that both SFO 75 and SFO 76 are in the early stages of ionisation, having only recently been exposed to the ionising radiation of their HII region, and that SFO 58 and SFO 68 have been exposed for a significantly longer period of time. Moreover, we find that the evolutionary age of the SFO 58 and SFO 68 suggested by the models compares well with the age of the star formation indicator mentioned in an earlier paragraph (i.e. several 105 yr).
Although we have not been able to conclusively prove that the star formation has been triggered within SFO 58 and SFO 68, we have shown that is possible, if not likely. Furthermore, we have shown there are clearly significant morphological and star formation differences between the post- and pre-pressure balance clouds in this survey, which are consistent with the predictions of RDI models. From the observations of the four clouds presented here, it seems that there is reasonably good evidence to support the suggestion that the schematic presented in the Figure 7 is an evolutionary picture of the changing morphology of BRCs under the influence of photoionisation.
6 Summary and conclusions
In this paper the results of a detailed investigation of four BRCs (SFO 58, SFO 68, SFO 75 and SFO 76) are presented, including high resolution radio molecular line and continuum observations obtained with the Mopra millimetre telescope and the ATCA. The main aim is to distinguish between pre- and post-pressure balance clouds, and to evaluate to what extent the star formation within these BRCs has been influenced by the photoionisation from the nearby OB star(s). Each of the BRCs was mapped using the 12CO, 13CO and C18O rotational transitions using the Mopra telescope. To complement the molecular line observations, high resolution radio continuum maps of all four BRCs were obtained using the ATCA.
The CO observations reveal the presence of a dense molecular core within every BRC, located behind the bright rim and, in most cases, coincident with the position of the IRAS point sources. The distribution of the 13CO emission maps suggest that the cores have a spherical structure and are centrally condensed, consistent with the presence of an embedded gravitationally bound object, such as a YSO. The H2 number densities and cores masses range between 3– cm-3 and 10–180 M⊙ respectively. The core temperatures ( 30 K) are significantly higher than expected for starless cores ( 10 K, Clemens et al. 1991), supporting evidence for the presence of an internal heating source, such as a protostar.
The high angular resolution radio observations have confirmed the presence of an IBL surrounding the rim of all four clouds, with the detected emission displaying excellent correlation with the morphology of the cloud rim seen in the optical images. The increased resolution and improved u-v coverage of the radio observations has resulted in significantly higher flux densities being measured, which in turn has led to higher values for the ionising fluxes, which are now more in line with the predicted fluxes than the low angular resolution observations presented in Paper I. The electron densities are all significantly higher than the critical density of 25 cm-3 (Lefloch & Lazareff 1994) above which an IBL can form and be maintained. All these facts strongly support the hypothesis that these clouds are being photoionised by the nearby OB star(s).
CO and radio continuum data are used to evaluate the pressure balance at the HII/molecular region interface. Comparing these values the clouds are found to fall into two categories: pre- and post-pressure balance states; SFO 75 and SFO 76 are identified as being in a pre-pressure balance state, and SFO 58 and SFO 68 are identified as being in a post-pressure balance state (taking account of the errors, see Section 4.3). We draw the following conclusions from our observations:
-
1.
Analysis has revealed clear morphological and evolutionary differences between the pre- and post-pressure balance clouds:
-
•
The two clouds identified in this survey as being in a post-pressure balance state are also the same two identified as having a type A rim morphology and show strong evidence of ongoing high- to intermediate-mass star formation (e.g. UC HII region, masers and molecular outflows).
-
•
The two clouds identified as being in a pre-pressure balance state have all been classified as type 0 clouds, and show no evidence of recent or ongoing star formation.
-
•
-
2.
The two classifications of rim morphologies, type 0 and type A, correspond to the 0.036 Myr and 0.126 Myr snapshots from the Lefloch & Lazareff (1994) RDI model, where the time indicates the exposure time of a cloud to an ionising front. This is consistent with our conclusion that SFO 75 and SFO 76 have only recently been exposed to the ionisation front and that SFO 58 and SFO 68 have been exposed for a significantly longer period of time. Moreover, the morphological age predicted by the RDI models is similar to the estimated age of the star formation within SFO 58 and SFO 68, support the possibility that the star formation has been triggered.
-
3.
Using a simple pressure-based argument, exposure to the FUV radiation field within the HII regions is shown to have a profound effect on the stability of these cores. All of the cores were stable whilst embedded in their natal molecular clouds, however, in all cases exposure to the FUV radiation field of the HII region reduces the stability of the cores by more than a factor of two (in the case of SFO 76 by almost a factor of seven). The reduced stability leaves two clouds on the edge of being unstable to gravitational collapse, and two clouds that have masses at least a factor of two greater than the pressurised virial masses. Analysis of the pre-exposure stability indicates that it is possible that the core embedded within SFO 75 was unstable to gravitational collapse prior to being exposed to the ionisation front. From this analysis we conclude that the cores within SFO 75 and SFO 76 are both unstable to gravitational collapse.
-
4.
The radio continuum observations toward SFO 58 reveal the presence of an embedded compact radio source within the optical boundary of the bright rim. The radio source is offset by 1′ from the position of the IRAS point source, but correlates extremely well with the position of the peak of the molecular core, both of which are located at the focus of the bright rim, suggesting that the radio source is associated with the cloud. The size ( 0.06 pc) and integrated radio flux are all consistent with the presence of an UC HII region embedded within the molecular core. The radio flux of this source is consistent with the presence of an UC HII region excited by a single ZAMS B2–B3 star. Inspection of the core-averaged 12CO spectrum reveals evidence of a substantial blue wing, possibly indicating the the presence of a molecular outflow. This is the first tentative evidence for ongoing star formation within SFO 58.
-
5.
The physical sizes and masses of the molecular cores are typically larger than a single star might be expected to form from. The IRAS luminosities are generally much higher than the bolometric luminosities typical for individual Class 0 and Class I stars (Andre et al. 1993; Chandler & Richer 2000). Additionally, evidence that two BRCs are active high-mass star forming regions is presented in this paper, which form exclusively in clusters. It is therefore highly likely that the presence of the IRAS point source indicates the presence of multiple protostellar systems rather than a single protostar. Higher resolution molecular line observations are required to investigate the possible multiplicity of these sources.
Acknowledgements.
The authors thank the Director and staff of the Paul Wild Observatory, Narrabri, New South Wales, Australia, for their hospitality and assistance during our Compact Array and Mopra observing runs, and the Mopra support scientist Stuart Robertson for his help and advice. We would also like to thank the referee Bertrand Lefloch for his very helpful comments and suggestions. This research would not have been possible without the SIMBAD astronomical database service operated at CDS, Strasbourg, France, and the NASA Astrophysics Data System Bibliographic Services. We have made use of Digitised Sky Survey images was produced at the Space Telescope Science Institute under U.S. Government grant NAG W-2166. These images are based on photographic data obtained using the Oschin Schmidt Telescope on Palomar Mountain and the UK Schmidt Telescope. The plates were processed into the present compressed digital form with the permission of these institutions. This research has also made use of the NASA/IPAC Infrared Science Archive, which is operated by the Jet Propulsion Laboratory, California Institute of Technology, under contract with the National Aeronautics and Space Administration.References
- Allen (1973) Allen, C. W. 1973, Astrophysical quantities (London: University of London, Athlone Press, 1973, 3rd ed.)
- Andre et al. (1993) Andre, P., Ward-Thompson, D., & Barsony, M. 1993, ApJ, 406, 122
- Andre et al. (2000) Andre, P., Ward-Thompson, D., & Barsony, M. 2000, Protostars and Planets IV, IV, 122
- Bertoldi (1989) Bertoldi, F. 1989, ApJ, 346, 735
- Bertoldi & McKee (1990) Bertoldi, F. & McKee, C. F. 1990, ApJ, 354, 529
- Braz et al. (1989) Braz, M. A., Gregorio Hetem, J. C., Scalise, E., Monteiro Do Vale, J. L., & Gaylard, M. 1989, A&AS, 77, 465
- Bronfman et al. (1996) Bronfman, L., Nyman, L.-A., & May, J. 1996, A&AS, 115, 81
- Caswell et al. (1995) Caswell, J. L., Vaile, R. A., Ellingsen, S. P., Whiteoak, J. B., & Norris, R. P. 1995, MNRAS, 272, 96
- Chandler & Richer (2000) Chandler, C. J. & Richer, J. S. 2000, ApJ, 530, 851
- Clemens et al. (1991) Clemens, D. P., Yun, J. L., & Heyer, M. H. 1991, ApJS, 75, 877
- Codella et al. (2001) Codella, C., Bachiller, R., Nisini, B., Saraceno, P., & Testi, L. 2001, A&A, 376, 271
- de Jager & Nieuwenhuijzen (1987) de Jager, C. & Nieuwenhuijzen, H. 1987, A&A, 177, 217
- De Vries & Myers (2005) De Vries, C. H. & Myers, P. C. 2005, ApJ, 620, 800
- De Vries et al. (2002) De Vries, C. H., Narayanan, G., & Snell, R. L. 2002, ApJ, 577, 798
- Dobashi et al. (2002) Dobashi, K., Yonekura, Y., Matsumoto, T., et al. 2002, in EAS Publications Series, 139–139
- Elmegreen (1992) Elmegreen, B. 1992, in Star Formation in Stellar Systems, 381
- Elmegreen & Lada (1977) Elmegreen, B. G. & Lada, C. J. 1977, ApJ, 214, 725
- Evans (1999) Evans, N. J. 1999, in Science with the Atacama Large Millimeter Array (ALMA)
- Furuya et al. (2001) Furuya, R. S., Kitamura, Y., Wootten, H. A., Claussen, M. J., & Kawabe, R. 2001, ApJ, 559, L143
- Georgelin et al. (1973) Georgelin, Y. M., Georgelin, Y. P., & Roux, S. 1973, A&A, 25, 337
- Goldsmith et al. (1996) Goldsmith, P. F., Bergin, E. A., & Lis, D. C. 1996, in IAU Symp. 170: CO: Twenty-Five Years of Millimeter-Wave Spectroscopy, 113
- Gooch (1996) Gooch, R. 1996, in Astronomical Society of the Pacific Conference Series, 80
- Harju et al. (1993) Harju, J., Walmsley, C. M., & Wouterloot, J. G. A. 1993, A&AS, 98, 51
- Kutner & Ulich (1981) Kutner, M. L. & Ulich, B. L. 1981, ApJ, 250, 341
- Ladd et al. (2005) Ladd, N., Purcell, C., Wong, T., & Robertson, S. 2005, Publications of the Astronomical Society of Australia, 22, 62
- Langer & Penzias (1990) Langer, W. D. & Penzias, A. A. 1990, ApJ, 357, 477
- Lefloch et al. (2002) Lefloch, B., Cernicharo, J., Rodríguez, L. F., et al. 2002, ApJ, 581, 335
- Lefloch & Lazareff (1994) Lefloch, B. & Lazareff, B. 1994, A&A, 289, 559
- Lefloch et al. (1997) Lefloch, B., Lazareff, B., & Castets, A. 1997, A&A, 324, 249
- MacLeod & Gaylard (1992) MacLeod, G. C. & Gaylard, M. J. 1992, MNRAS, 256, 519
- Megeath & Wilson (1997) Megeath, S. T. & Wilson, T. L. 1997, AJ, 114, 1106
- Minier et al. (2003) Minier, V., Ellingsen, S. P., Norris, R. P., & Booth, R. S. 2003, A&A, 403, 1095
- Ogura et al. (2002) Ogura, K., Sugitani, K., & Pickles, A. 2002, AJ, 123, 2597
- Oort & Spitzer (1955) Oort, J. H. & Spitzer, L. J. 1955, ApJ, 121, 6
- Panagia (1973) Panagia, N. 1973, AJ, 78, 929
- Price et al. (2001) Price, S. D., Egan, M. P., Carey, S. J., Mizuno, D. R., & Kuchar, T. A. 2001, AJ, 121, 2819
- Sandford et al. (1982) Sandford, M. T., Whitaker, R. W., & Klein, R. I. 1982, ApJ, 260, 183
- Sault et al. (1995) Sault, R. J., Teuben, P. J., & Wright, M. C. H. 1995, in ASP Conf. Ser. 77: Astronomical Data Analysis Software and Systems IV, 433
- Sharpless (1959) Sharpless, S. 1959, ApJS, 4, 257
- Sugitani et al. (1991) Sugitani, K., Fukui, Y., & Ogura, K. 1991, ApJS, 77, 59
- Sugitani et al. (2000) Sugitani, K., Matsuo, H., Nakano, M., Tamura, M., & Ogura, K. 2000, AJ, 119, 323
- Sugitani & Ogura (1994) Sugitani, K. & Ogura, K. 1994, ApJS, 92, 163
- Thompson & White (2004) Thompson, M. A. & White, G. J. 2004, A&A, 419, 599
- Thompson et al. (2004) Thompson, M. A., White, G. J., Morgan, L. K., et al. 2004, A&A, 414, 1017
- Urquhart et al. (2004) Urquhart, J. S., Thompson, M. A., Morgan, L. K., & White, G. J. 2004, A&A, 428, 723
- Vanhala & Cameron (1998) Vanhala, H. A. T. & Cameron, A. G. W. 1998, ApJ, 508, 291
- Walsh et al. (1997) Walsh, A. J., Hyland, A. R., Robinson, G., & Burton, M. G. 1997, MNRAS, 291, 261
- White et al. (1999) White, G. J., Nelson, R. P., Holland, W. S., et al. 1999, A&A, 342, 233
- Whitworth & Zinnecker (2004) Whitworth, A. P. & Zinnecker, H. 2004, A&A, 427, 299
- Yamaguchi et al. (1999) Yamaguchi, R., Saito, H., Mizuno, N., et al. 1999, PASJ, 51, 791
- Zinchenko et al. (1995) Zinchenko, I., Mattila, K., & Toriseva, M. 1995, A&AS, 111, 95
- Zinner (1996) Zinner, E. 1996, in Astronomical Society of the Pacific Conference Series, 147