The Clustering of Low Luminosity AGN
Abstract
We present the first multi-parameter analysis of the spatial clustering properties of nearby galaxies in which accretion activity is present to different degrees. We spectroscopically identify and classify active galactic nuclei (AGN) from the Sloan Digital Sky Survey (SDSS) DR2 main galaxy sample, which yields the most precise measurement to date of AGN clustering. Estimates of the redshift space two-point correlation function (CF) reveal that Seyferts are clearly less clustered than normal galaxies, while the clustering amplitude of LINERs is consistent with that of the parent galaxy population. The similarities of the distributions of host properties (color and concentration index) of Seyferts and LINERs suggest that the difference in their clustering amplitudes is not driven by the morphology-density relation. We find that the luminosity of the [O I] emission shows the strongest influence on AGN clustering, with low sources having the highest clustering amplitude, . This trend is much stronger than the previously detected dependence on , which we confirm. The fact that objects of given spectral types are clustered differently seems correlated with a variety of their physical properties including , , the electron density of the emitting gas , and the obscuration level. LINERs, which exhibit high , show the lowest luminosities and obscuration levels, and relatively low , suggesting that these objects harbor black holes that are relatively massive yet weakly active or inefficient in their accretion, probably due to the insufficiency of their fuel supply. Seyferts, which have low , are very luminous in both [O I] and [O III] and show large , suggesting that in these systems the black holes are less massive but accrete quickly and efficiently enough to clearly dominate the ionization. Star-forming galaxies – the H ii’s – are weakly clustered; because these systems are hosted mainly by blue, late type galaxies, this trend can be understood as a consequence of both the morphology-density and star formation rate-density relations. However, the spectral properties of the H ii’s suggest that these systems hide in their centers, amidst large amounts of obscuring material, black holes of generally low mass whose activity remains relatively feeble. Our own Milky Way may be a typical such case.
Subject headings:
galaxies:active—galaxies:emission lines—galaxies:clustering—galaxies:statistics1. Introduction
Clustering analysis can be a useful tool to employ in investigating the formation and evolution mechanisms of various astrophysical objects. In the case of AGN, the pattern of spatial clustering and its implications for the environments of AGN provides constraints on galaxy evolution models, and in particular on how well AGN trace the normal, non-active galaxy distribution. Comparisons of the AGN environments with those of control samples of regular galaxies may indicate differences that reveal what determines the activity in galaxy nuclei, and even gauge its strength and time cycle, thus yielding a phenomenological link between black hole growth and galaxy formation and evolution processes.
Estimates of the two-point correlation function (CF) provide important diagnostics for the black hole (BH) masses and duty cycle of fueling in AGN. If structure formation is hierarchical, then the rarest and most massive virialized dark matter (DM) halos cluster the most strongly (e.g., Kaiser, 1984), thus the clustering strength of a given object type constrains the mass and number density of the halos in which they reside. The DM halo mass can further be connected to the physical properties of the resident galaxies and their central black holes through empirical scaling relations: the black hole mass – stellar velocity dispersion relation that holds for normal galaxies (Gebhardt et al., 2000a; Ferrarese & Merritt, 2000) as well as for the active ones (Gebhardt et al., 2000b; Ferrarese et al., 2001; Nelson et al., 2004; Onken et al., 2004; Greene & Ho, 2005), the correlations between bulge properties and (e.g., Magorrian et al., 1998; Graham et al., 2001), and the correlation between circular velocity and central velocity dispersion (Ferrarese, 2002; Baes et al., 2003) that links dark matter halos and supermassive BHs. The number density of the DM halos can be used to infer the duty-cycle, or the accretion life-time, as this is given by the inverse ratio of this number density to that of the observed objects (Martini & Weinberg, 2001). Such predictions for the AGN’s lifetime, and its implications for the efficiency of BH formation (Haiman & Hui, 2001), can test the fundamental assumptions of semi-analytical models of AGN and galaxy formation (Kauffmann & Haehnelt, 2000; Di Matteo et al., 2003).
Studying the spatial clustering properties of different spectroscopically-classified AGN species may link their ionization mechanisms to properties of their hosts and environment. Through comparison of the clustering amplitudes of accreting-type sources such as Seyferts and the starlight-ionized H ii galaxies, it is possible to contrast properties of the dark matter halos that host different kinds and levels of galactic nuclear activity. Particularly interesting is the clustering of the ubiquitous Low Ionization Emission-Line Regions (LINERs, e.g. Heckman 1980), whose physical origin, whether thermal or non-thermal, remains ambiguous despite exhaustive analysis of their properties (Ho, 1999; Ho, Filippenko & Sargent, 2003; Filho et al., 2004; Maoz et al., 2005; Constantin et al., 2006).
Galaxy mergers are predicted to play a crucial role in triggering AGN activity (e.g., Barnes & Hernquist, 1992; Kauffmann & Haehnelt, 2000; Di Matteo, Springel & Hernquist, 2005). If galaxy nuclei become more AGN-like when major mergers occur, then active galaxies of different spectral signatures, corresponding to different degrees of contributions from a non-thermal ionization process, may cluster differently, reflecting variation in their environments. Thus, a comparison of the clustering properties of the active and non-active galaxies is an important tool for testing the merger-accretion connection.
Through its wealth of both spectroscopic and photometric data, SDSS (York et al., 2000) is ideal for investigating the dependence of clustering properties on a variety of emission characteristics. The SDSS observations offer the unique opportunity to examine simultaneously the dependence of environment on the spectral classification of emission-line galaxies, and on various other features that characterize or even determine a detectable accretion process, in conjunction with properties of their host galaxies. Previous studies with similar aims (Kauffmann et al., 2003, 2004; Miller et al., 2003; Wake et al., 2004) compared passive galaxies with AGN as a general class and did not investigate the properties of sub-populations such as Seyferts and LINERs separately. In these studies, the optical classification of an object as an AGN relies, especially among the narrow-line emitters, mainly on the [N II]/H vs. [O III]/H diagnostic diagram. There are suspicions that such rather lenient definitions may not best represent the accretion dominated population (Hao et al., 2005). Using such definitions, the AGN population is found by Miller et al. (2003) and Wake et al. (2004) to occupy a uniform fraction of galaxies, to be common to a large range of galactic environments, and to follow the distribution of the whole galaxy population, and therefore to be unbiased tracers of mass in the universe. However, when divided by their ([O III]) luminosities, the active nuclei show markedly different clustering properties (Wake et al., 2004), different star-formation histories in their hosts (Kauffmann et al., 2003), and different environmental preference (Kauffmann et al., 2004). Combined together, these findings seem to suggest that Seyferts and LINERs, that represent quite distinct distributions in (Kauffmann et al., 2003), might also cluster differently. Such inferences are intriguing and thus merit further clarification. It is thus crucial to establish and quantify the connections between the intrinsic physical properties of the nuclear line-emitting regions and those of their host galaxies and dark matter halos. We pursue these issues here by including important spectral diagnostics that probe the astrophysics of AGN.
In this paper, we use SDSS DR2 data in an attempt to detect and analyse differences in the clustering properties of (1) active and non-active galaxies, (2) objects of distinct types of activity, i.e., accretion versus star-formation, and (3) different spectroscopic types of AGN, e.g., Seyferts versus LINERs. In order to carry out such analysis with a good understanding of the possible biases introduced by detection and spectral identification, we present in Section 2 a systematic examination of the different AGN selection criteria and their sensitivity to the dominance of an accreting-type nuclear power source. In Section 3 we estimate and compare the redshift-space CF for subsamples of objects of different spectral classes (Section 3.1.1), and investigate the degree to which these measurements are influenced by the level of nuclear activity, as traced by the [O III] and [O I] luminosities (Section 3.1.2), properties of the line-emitting gas, e.g., intrinsic obscuration, as traced by the neutral hydrogen column densities and the electron density (Section 3.1.3), and host properties (Section 3.2). We discuss in Section 4 possible implications of our findings on the features that distinguish Seyferts from LINERs, on the peculiar nature of the Transition objects, that border the definition of AGN (Seyferts or LINERs) and H ii, and on the potentially great similarity between the Galactic Center and a typical H ii system. Section 5 summarizes the findings and conclusions of this work.
2. The data
This study is based on data from the Sloan Digital Sky Survey (SDSS) Data Release 2 (DR2; Abazajian et al., 2004). The parent sample from which we draw various categories of sources is a subset of the main galaxy sample used for large-scale structure studies (Strauss et al., 2002), and includes objects with Petrosian magnitudes after correction for Galactic extinction based on maps of (Schlegel, Finkbeiner & Davis, 1998), and with a redshift distribution that extends from to , with a median of . Thus, the sample does not include low redshift quasars or broad emission-line, type 1 AGN (Richards et al., 2002; Schneider et al., 2002, 2003). To clarify the nomenclature, what we define as Seyferts and LINERs are only type 2 objects, where no obvious broad component is detected, thereby leaving the narrow lines as the prominent spectral features.
The core of the analysis we present here exploits the source spectroscopic properties and, consequently, the source spectral type definition. The spectroscopic measurements we employ are drawn from a catalog of absorption and emission line fluxes and equivalent widths (EW) of a superset of the DR2 galaxy targets which fulfill the galaxy sample selection criteria. These data are kindly made publicly available by the MPA/JHU collaboration at http://www.mpa-garching.mpg.de/SDSS/ (Brinchmann et al., 2004), and are analyzed by, e.g., Kauffmann et al. (2003, 2004). This dataset has the advantage that the line emission component is separated from the host galaxy light; based on stellar population synthesis templates that span a relatively large range in age and metallicity, the absorption-line contribution is identified and subtracted from the total galaxy spectrum (Tremonti et al., 2004). We should note here that such model-based measurements exclude alpha-enhancement that might result in an enhanced “bluing” on the evolutionary tracks that translate in a possible enhancement in the absorption index by up to 0.26Å (Thomas & Maraston, 2003). Such bias remains however negligible for the strongly line emission systems that we consider in this study, where we employ only 2-sigma line flux measurements (see Section 2.1.1); in such samples, the minimum strength (equivalent width) of the H emission is Å, hence, even an extreme “bluing” has a maximum effect of %, and should affect only % of the sample.
Other observed properties of the objects used in this study were measured using the standard SDSS photometric and spectroscopic pipelines and were obtained directly from the SDSS archive. We employ Petrosian magnitudes, and in calculating the absolute magnitudes from the apparent magnitudes and the redshift we apply the formula
| (1) |
Here is the -band magnitude galaxy -correction relative to the value, as calculated by Blanton et al. (2003b), and made publicly available as part of the NYU Value-Added Catalog (Blanton et al. 2005, http://wassup.physics.nyu.edu/vagc/), is the luminosity distance, with the comoving distance, and accounts for the average evolution in galaxy luminosities in the recent past, with (Blanton et al., 2003a; Tegmark et al., 2004). Throughout this paper we assume a cosmology with , , and km s-1 Mpc-1. The distances are quoted in Mpc.
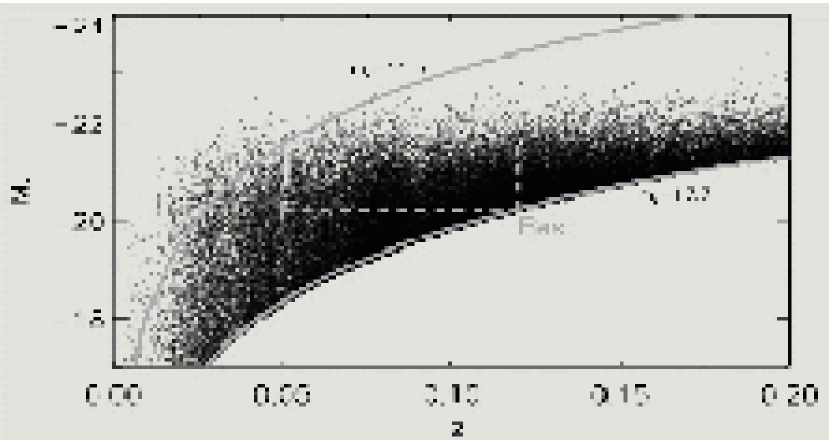
In this study we conduct a comparative analysis of the clustering properties of the emission-line galaxies by employing subsamples of galaxies, defined by absolute magnitude limits. Figure 1 illustrates the distribution of the whole galaxy sample (247,080 objects) in the redshift-absolute magnitude space. The continuous curves delineate the sample boundaries corresponding to our choice of apparent magnitude limits . The bright cutoff excludes bright galaxies that may have been shredded into many pieces, particularly in early SDSS photometry, and/or galaxies that have been excluded from spectroscopic target selection due to fiber saturation effects, while the faint limit corresponds to that of the main galaxy sample (Strauss et al., 2002).
Following Park et al. (2005), we define a “Best” volume-limited sample of SDSS galaxies that contains the maximum number of galaxies, with absolute-magnitude limits that correspond to a redshift range of , or a comoving distance range of Mpc, when the apparent magnitude cuts are applied. The definition of our “Best” volume is shown in Figure 1 as a dashed line. The sky area covered by the parent spectroscopic sample is illustrated in Figure 1 of Abazajian et al. (2004). It is important to note that the subsets of spectroscopically-defined AGN drawn from this volume-limited galaxy sample will not themselves be truly volume-limited samples because of selection effects induced by their spectroscopic definition; the host galaxies are restricted to the described range of absolute magnitude and redshift, but the redshift distributions of AGN may not be uniform because of the requirement that the emission lines be detected. These effects are discussed in detail in Section 2.2 and are taken into account in our clustering analysis.
The spectroscopic subsamples of interest for this study suffer from the fiber collision problem. When two targets lie closer than 55, only one member of such galaxy pair will have a spectrum available, unless later spectroscopic tiles overlap that same area of sky. Because classification as an AGN requires a spectrum for each object, we cannot make any “correction” for such collisions, as is commonly done for large-scale structure studies of SDSS galaxy samples (Zehavi et al., 2002). The impact of this problem on our estimates of the correlation functions is discussed later in Section 3.
2.1. Subsample Definition
2.1.1 Active vs. Non-Active: the Spectral Classification
The fraction of galaxies with an AGN is difficult to assess observationally, because it strongly depends on the quality and quantity of the available spectral data. Sub-classifying emission-line nebulae typically requires a comparison of pairs of line-flux ratios of spectral features that are relatively insensitive to reddening and metallicity, are able to distinguish between different ionization levels, and provide a useful segregation of different object types. There is a set of line ratios that satisfy these criteria, and that have been widely used in quantifying emission properties and distinguishing between accretion-powered and starlight-powered systems: [O III]5007/H, [N II]6583/H, [S II]6716,6731/H, and [O I]6300/H (e.g., Baldwin, Phillips, & Terlevich, 1981; Veilleux & Osterbrock, 1987).
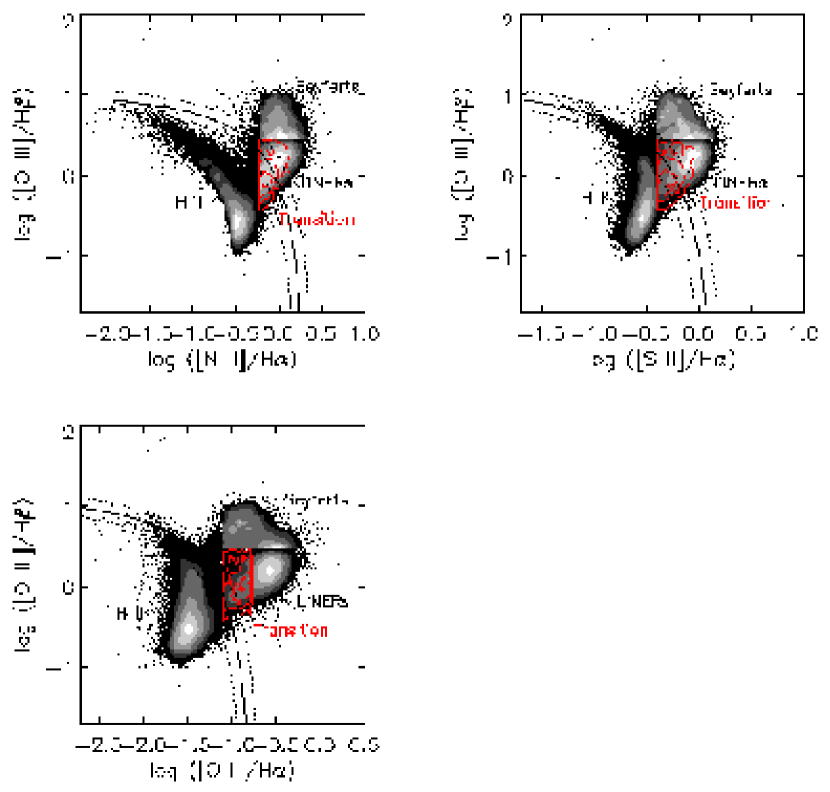
Figure 2 illustrates how galaxies that exhibit all 6 of these emission lines at moderately high signal-to-noise, e.g., with fractional errors 50%, segregate as a function of these combinations of line ratios. Following the Ho, Filippenko & Sargent (1997a) criteria, as listed in Table 1, we classify the objects as H ii galaxies, Seyferts, and LINERs, with their Pure LINER and Transition subsets. H ii’s are the galaxies that populate mainly the left branches of these diagrams, as they usually show weak low-ionization transitions in [N II], [S II], and especially [O I]. By contrast, Seyferts and LINERs occupy the right branch as they exhibit relatively strong forbidden features. The distinction between Seyferts and LINERs is usually given by their ionization level, which is easily gauged by the [O III]/H ratio, with Seyferts showing larger values. The Transition systems are differentiated from the Pure LINERs based on their low [O I]/H ratio. Such divisions offer a basis for categorizing the line-emitters. However, as is apparent from these three heavily populated diagrams, the nebular properties span a continuous range; no breaks appear in the diagrams to indicate a clear-cut transition between one type to another.
There are also relatively successful theoretical attempts to separate the accretion-type galaxy nuclei from star-forming sources, using criteria that can be described using these same spectra diagnostics diagrams. Based on models that account for large realistic metallicity, ionization parameter, and dust depletion ranges, Kewley et al. (2001) find that simple hyperbolic curves can be used to split the line-emitting galaxies into AGN and star-forming galaxies. As can be seen from Figure 2, the curves claimed as upper limits on the location of H ii-like objects exclude only a small fraction of LINERs from the AGN class, and are otherwise reasonably consistent with the Ho, Filippenko & Sargent (1997a) classification criteria.
Previous studies of low luminosity narrow-lined AGN in SDSS samples used simpler criteria than we use here. Based on the shape of the distribution of objects in the [N II]/H vs. [O III]/H diagram, Kauffmann et al. (2003) propose an empirical cut between AGN and H ii -type galaxies, while some other studies (Miller et al., 2003; Wake et al., 2004) consider AGN classification schemes based only on values of the [N II]/H flux ratio (i.e., with the condition that [N II]/H ). These classifications overlook the emission-line behavior as a function of [S II]/H, and [O I]/H, which, e.g., Veilleux & Osterbrock (1987) and Ho, Filippenko & Sargent (1997a) argue that discriminate better than [N II]/H between the young stars and AGN as dominant ionization sources. Of the three low-ionization lines, [O I] is the most sensitive to the shape of the ionizing spectrum, requiring a significantly hard radiation field, i.e., that of an AGN, to sustain a sufficiently extensive partially ionized zone in clouds optically thick to Lyman continuum, and thus to produce a strong such feature. Since the ionization potential of [O I] matches that of H very well, large differences in the [O I]/H ratios are expected between H ii region-like objects and narrow line AGN. The effect is also important for [S II] (6717+6731)/H, however, the fact that S+ can also exist within H+ zones of H ii regions and AGN attenuates the difference between the two classes of objects. Strong [S II] 6717, 6731 are nevertheless expected in AGN because of the large collisional-excitation cross sections for these lines. [N II] has a much smaller excitation cross section, and thus its strength in AGN is weaker. Large [N II]/H line ratios in AGN may however also be caused by potential selective enhancements of nitrogen (Storchi-Bergmann & Pastoriza, 1989, 1990), and thus do not necessarily arise through ionization by an accretion-type radiation field.
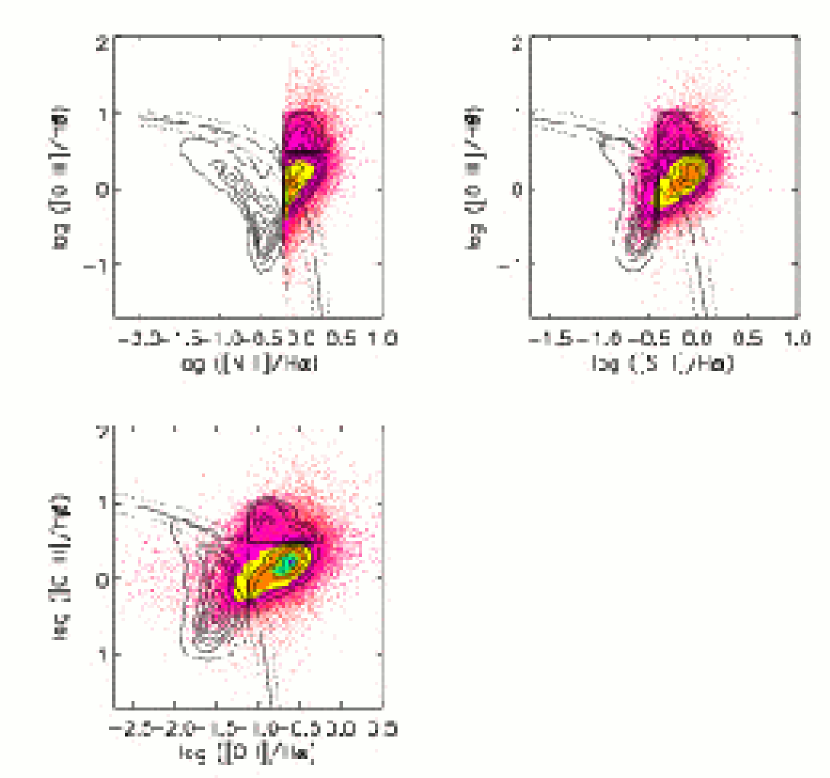
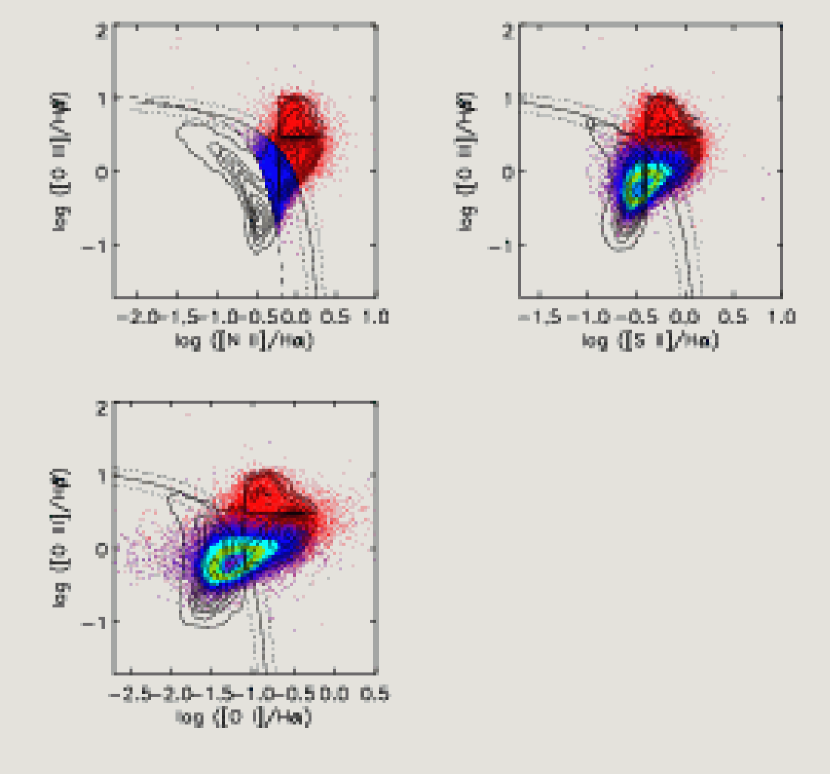
Figure 3 illustrates the behavior as a function of [S II]/H and [O I]/H of the objects classified as AGN based on [N II]/H ratio like in Miller et al. (right panels), and based on the Kauffmann et al. line that separates the two branches of the objects distribution in [N II]/H vs. [O III]/H diagram (left panels). For the Miller et al. classification, the density contours show that these AGN are governed by a LINER-like behavior. Using the spectral types defined in Table 1, the fraction of LINERs is at least 30%, while Seyferts comprise less than 9% of these AGN, in both their ‘2-line” AGN (only detection of 2 line-emissions, [N II] and H is required) and “4-line” AGN (additional detection of [O III] and H emission lines is required) samples. Also, the fraction of Miller et al. AGN with low [S II]/H and [O I]/H ratios, which are more likely to be dominated by star-forming activity, is as high as 20%, which represent more than double the number of Seyferts. AGN defined using the Kauffmann et al. criteria severely leak into the H ii locus in both [S II]/H and [O I]/H diagrams. 27% of these sources, or 45% of the objects situated between the Kewley et al. and Kauffmann et al. lines (the blue dots in the [N II]/H vs. [O III]/H diagram), would be classified as H ii using the criteria in Table 1. Seyferts remain poorly represented in the Kauffmann et al. sample as well (less than 5%), while LINERs, although constituting the majority of the potentially accretion-dominated sources (25%), are greatly outnumbered by H ii’s.
This comparison shows that the Kauffmann et al. and the Miller et al. AGN classifications, although powerful through their great statistics, may not best represent accretion dominated narrow-line galaxies. Such classifications include a significant fraction of galaxies that show star-forming activity, and certainly, a mix of different types of AGN. For the purpose of understanding differences between emission-line activity originating in star formation and black hole accretion, a more stringent characterization of the dominant power source, particularly as a function of [S II] and/or [O I], is necessary.
Note that in our classification of the emission-line systems we weighted equally the three diagnostic diagrams, even if the error distributions in the line ratios vary from diagram to diagram. In particular, the errors in the [O I] fluxes and [O I]/H flux ratios are generally larger than those of the other stronger features. However, for Seyferts in particular, the [O I] error distributions are significantly narrower than those of other object types, suggesting that for this particular category the classification is especially trustworthy.
2.1.2 Our Samples
We select from the parent sample of galaxies a subset of strong “emission-line” sources and a set of “passive” objects that show insignificant, if any, line emission activity. The emission-line sources are galaxies that exhibit all six lines H, H, [O III],[N II] [S II], and [O I] in emission, i.e. the line fluxes have positive values and the fluxes are measured with at least 2 confidence. We identify 54,410 such strong line-emitters, which comprise % of all objects. Note that our definition of emission-line objects is very restrictive, and therefore the detection fraction of such sources among all galaxies is smaller than what Ho, Filippenko & Sargent (1997a) and Miller et al. (2003) find (). When we relax the “6-line” definition criteria to include any kind of emission-line activity, we recover a similarly high fraction. The “passive” galaxies are defined here as the objects for which H, H, [O II], and [N II] are not detected in emission (i.e., their EWs are positive in the emission-line catalog, indicating an absorption feature). This sample, which includes 59,197 sources, is a subset of the red, old, non-H emitters.
Among the emission-line galaxies described above, we use the criteria listed in Table 1 to identify 34,781 H ii-type galaxies, 2,392 Seyferts, and 7,468 LINERs, among which 2,155 are Transition objects. There are a significant number of strong emission-line objects (18%) that do not simultaneously comply with these sets of conditions: these are objects that show large [N II]/H ratios ( 0.6) but low [S II]/H ( 0.4) and/or [O I]/H ( 0.08), or small [N II]/H and large ratios involving [S II] and/or [O I]. For the sake of simplicity, we exclude these sources from the comparative analysis of clustering of Seyfert, LINER and Hii populations.
Although [O I] is generally weak and therefore difficult to measure accurately, this feature is very useful in separating the Transition objects among LINERs. Note, however, that requiring its detection in the sample definition severely diminishes the sample sizes. Without this condition on [O I] and consequently on [O I]/H, we identify 98,556 line emitters, or % of the galaxies, among which 3,052 are Seyferts, 12,779 are LINERs, and 65,971 are H ii galaxies. In our clustering analysis, we compare the clustering properties of active galaxies whose definitions both include and exclude conditions on [O I] and [O I]/H.
2.2. Subsample Properties & Selection Effects
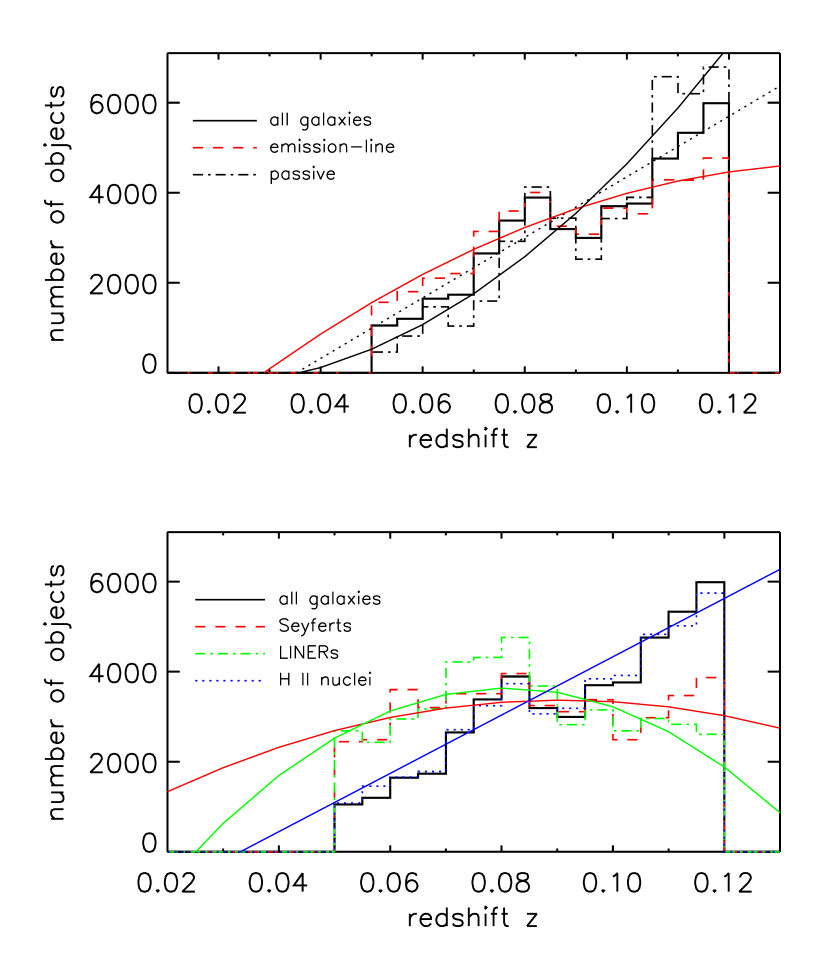
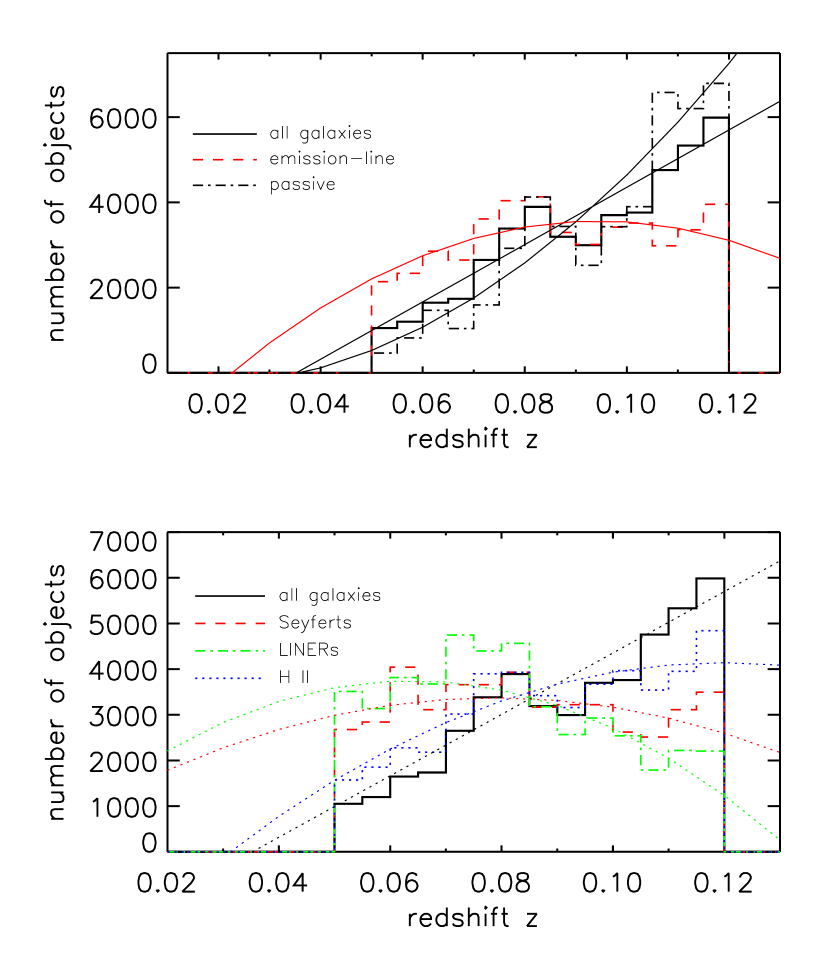
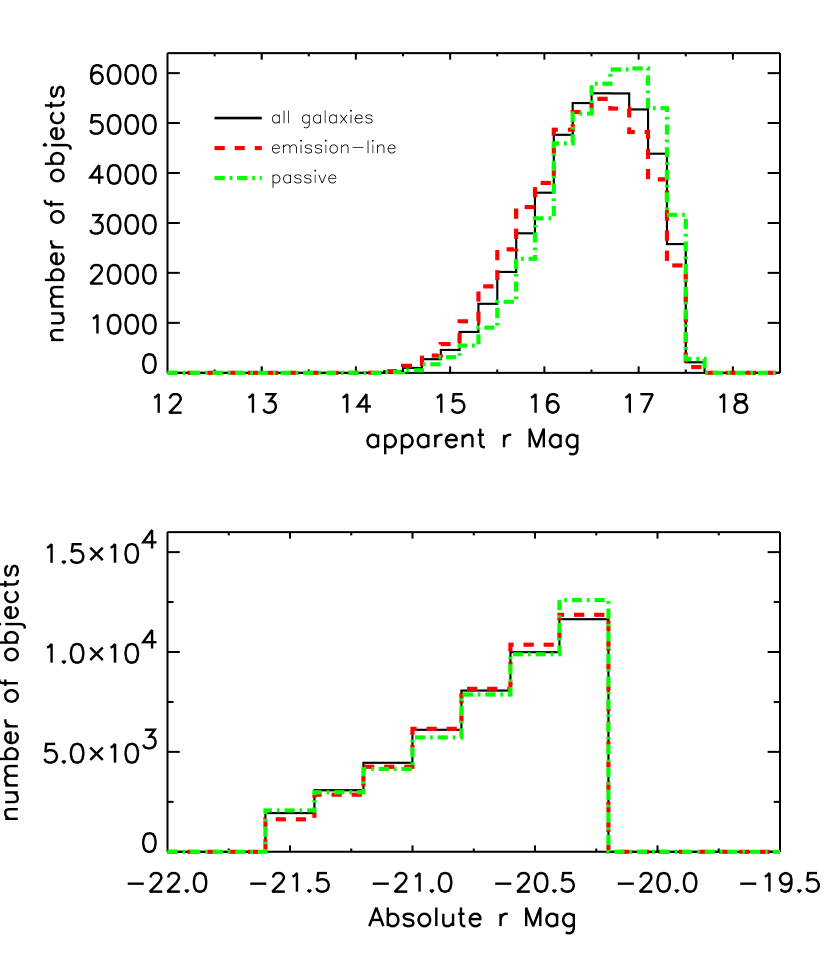
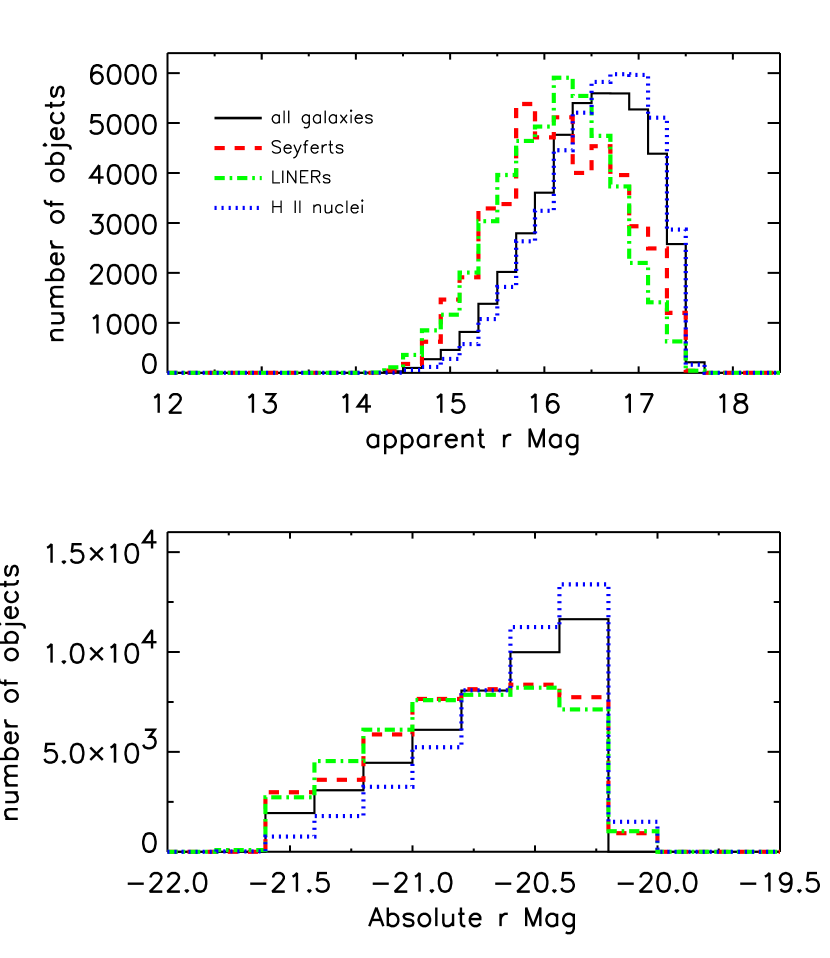
We begin by forming the “Best” absolute-magnitude limited sample of galaxies using the definition illustrated in Figure 1, then apply the criteria listed in Table 1 to form spectroscopically-classified subsamples. The numbers of objects in each subsample are recorded in Table 2. Figure 4 shows the redshift distributions for these samples and comparisons of their apparent and absolute magnitudes are presented in Figure 5.
It is clear that, although drawn from a parent sample of galaxies with a fixed range of intrinsic luminosities, subsamples of spectroscopically-classified objects are not, in general, volume limited. The necessity of detecting the spectral features employed in classification causes a redshift dependence. For example, LINERs and Seyferts are less prominent than other types of sources at , and seem to populate the brighter galaxies, both in apparent and absolute magnitudes, while the H ii systems are shifted toward fainter apparent and absolute magnitudes.
Whether a specific galaxy is included into a given spectral category is strongly subject to multiple selection effects that vary with redshift. The fraction of galaxy centers exhibiting measurable emission lines decreases with redshift as a consequence of decreasing signal-to-noise. More importantly, the increase with distance of the projected size of the SDSS 3 spectroscopic aperture causes dilution of emission-line activity by the increasing amount of host galaxy light. Thus, weak line-emitting systems are more likely to be misclassified as non-active at larger distance. These effects explain the differences seen in the redshift and magnitude distributions of the accretion type sources (Seyferts, and at least some LINERs) and the galaxies in which activity is mainly driven by hot young stars (H ii). While in the latter objects the power source is more extended, and thus more likely to be observed at larger distances, in the accretion dominated nuclei the ionization originates in more centrally concentrated regions and thus is less likely to be included in the emission-line sample at large where the signal-to-noise is lower.
Note that for our specific goals of separating as cleanly as possible among different types of emission-line systems, the fixed aperture biases remain inconsequential. Regarding the detection of the AGN dominance, the fixed fiber effects go only in one direction: the more distant objects are less likely to be detected as AGN as stellar contamination becomes more pronounced; hence, such cases would most likely account for the large fraction of objects that remain unclassified based on our criteria, and which we exclude from our comparative analysis between properties of bona-fide Seyferts and LINERs. Likewise, we do not attempt any aperture correction for the line fluxes as estimates of total quantities (like e.g., the star formation rate) remain irrelevant for this work. Note also that the relative number statistics of various types of emission-line systems are indeed expected to be different for different bins for a fixed fiber size. However, such possible classification biases are minimized through our choice of volume-absolute magnitude limited sample that spans relatively short ranges in both redshift and brightness.
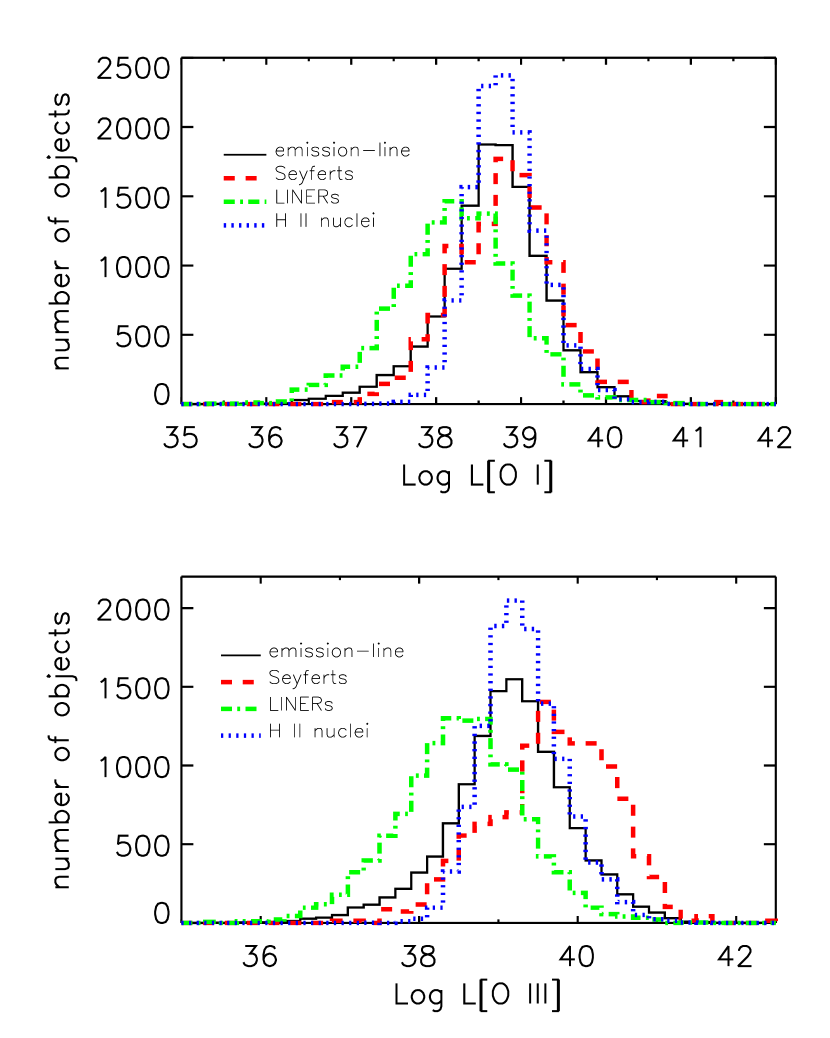
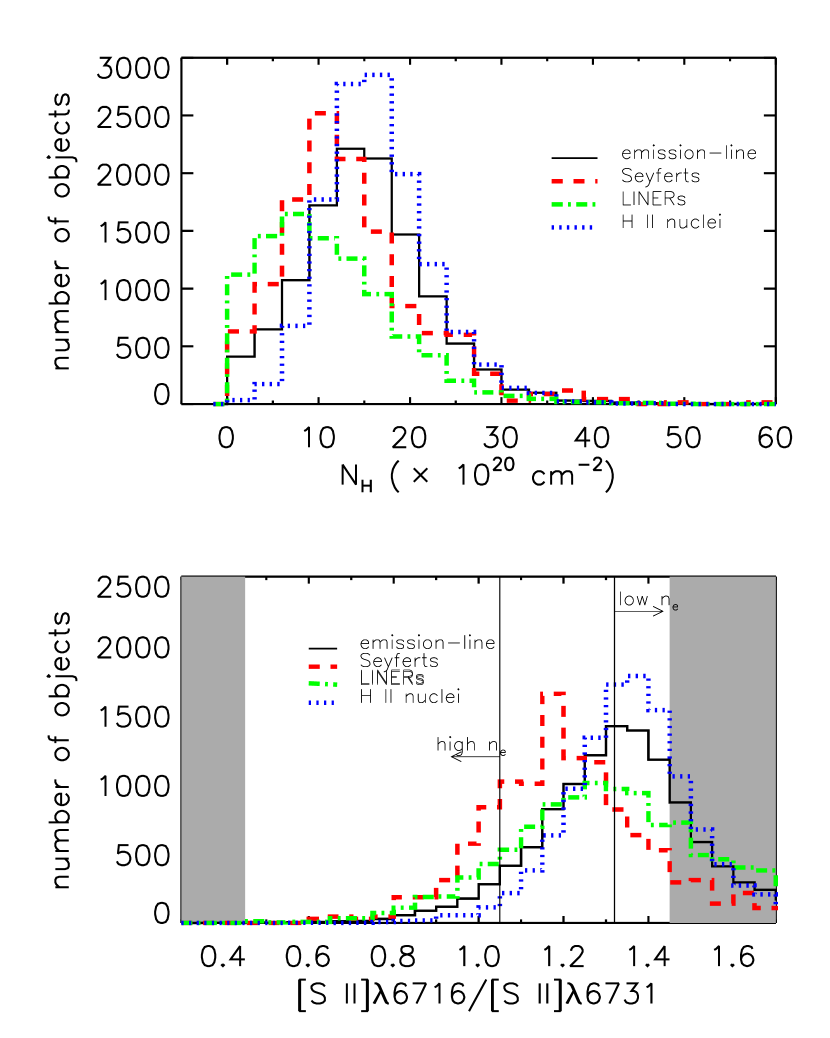
We find that the different spectral classes of objects exhibit distinct behavior in several physical characteristics. Figure 6 shows the distributions in log and log , the intrinsic column density , and the electron density , separately for the Seyferts, LINERs, H ii galaxies, and the whole sample of 6-line emitting galaxies. Line luminosities and are calculated only for objects that show flux measurement uncertainties of % in these lines and in the Balmer decrement H/H, which is used to correct for intrinsic extinction. We assume a dust-free case-B recombination value of 2.86 for the standard, not absorbed H/H, and, for the sake of simplicity and to ease comparison with previous calculations by Kauffmann et al. (2003), an attenuation law of the form (Charlot & Fall, 2000). We use the same method for calculating the values. To estimate we employ the [S II]6716/6731 line-flux ratio (e.g., Osterbrock, 1989). The [O II]3729,3726 feature could also be used as a density indicator, as it is available in the majority of the SDSS galaxy spectra, and the emission-line catalog that we use here includes measurements of the individual components. However, the small separation of only 3Å between the two lines may cause large uncertainties in their fluxes, and therefore in the estimates as well.
Investigation of the -dependent behavior of different types of galaxies is important because this parameter is claimed to trace the AGN activity, at least for luminous systems with large [N II]/H ratios (Kauffmann et al., 2003). This work showed evidence for the fact that highly [O III] luminous objects are more likely to be powered by an accretion-type nucleus, suggesting that larger may correspond to larger accretion rates. A scrutiny of the role played by in distinguishing among different spectral types and in their spatial clustering properties is motivated by the strong capability of the [O I] feature to differentiate between thermal and non-thermal ionization sources. Given that [O I] arises preferentially in zones of partly ionized hydrogen, that are extended only in objects photoionized by a spectrum containing a large fraction of high-energy photons, i.e., originating in accretion, and therefore nearly absent in galaxies photoionized by OB stars, one might expect that is also be a good indicator of the strength of the accretion activity. Such expectations are supported by recent work of Constantin et al. (2006) who indicate that the presence and strength of the [O I] emission may be linked to the presence and strength of the broad H emission, and thus to the dominance of the accretion-type ionization in the nuclear spectra of nearby emission-line galaxies.
Interestingly, in terms of both and , LINERs and Seyferts show a strongly antagonistic behavior. LINERs stand out as the objects with the lowest and relative to other spectral classes, rarely exhibiting values of log , with in units of erg s-1. Seyferts, on the other hand, are the galaxies that are most likely to be luminous in these emission lines; the median values for log are 38.6 for LINERs, and 39.8 for Seyferts. Although the lack of LINERs with high can be explained by their definition as low ionization emission regions, which explicitly selects lower [O III] fluxes, the absence of high LINERs is intriguing. Because the redshift and magnitude distributions of Seyferts and LINERs are very similar, selection effects cannot be attributed to this trend, thus their low and low must be intrinsic to these systems.
Dust obscuration is another variable that could significantly affect the detection of AGN-like activity. In terms of intrinsic attenuation, as measured by , LINERs are again at one extreme, showing low levels of extinction relative to Seyferts and H ii’s, with the latter being the most obscured of the emission-line objects. These trends are to be expected, as star formation is generally accompanied by significant amount of obscuring dust. However, it may also be the case that in such a dusty star-forming environment, a potentially present weak AGN-like nuclear emission is suppressed, because it lies buried in surrounding H ii- like features.
Based on the [S II] line flux ratio estimates for the electron density, Seyferts show the highest , as expected for sources in which the dominant ionization mechanism is accretion of matter onto a black hole. The LINERs show lower densities, while the starforming systems clearly populate the lowest end in the distribution; the median is cm-3 , cm-3 , and cm-3 for the Seyferts, LINERs and H ii’s respectively. A Kolmogorov-Smirnov test indicates an almost null probability that any pair of these subsamples draw their distributions in [S II] ratio from the same parent distribution; the KS probability that Seyferts and the whole sample of emission-line emitters belong to the same parent population is KS, while for the comparison between the line emitters and the H ii’s, KS. There are roughly 3000 galaxies that manifest emission-line activity with cm-3, which is below the theoretical lower limit for which can be estimated based on [S II] emission; about half of these objects are H ii galaxies.
Median and average values of the parameters for which the distributions are compared among different spectral types of objects are recorded in Table 5.
3. The Correlation Function
To quantify clustering in the observed galaxy distribution we estimate the 2-point correlation function (CF) , which measures the excess probability over random to find an object pair separated by comoving distance . The separation is measured in redshift-space, thus it is important to note that the shape and amplitude of this measure of spatial clustering are determined not only by the spatial configuration but also by peculiar velocities. Small scale velocity dispersion, e.g., in cores of galaxy clusters, damps small scale clustering, while linear infall onto dense regions amplifies clustering on large scales.
Accurate estimation of the correlation function requires careful accounting for both angular and radial variation in the expected galaxy density. The former requires knowledge of the complicated geometry of the angular mask that describes the regions on the sky in which data were obtained and the sampling of galaxies in the observed regions, while the latter variation may depend on physical characteristics of the samples analysed, which can introduce important selection biases with distance.
To account for the survey geometry we employ random catalogs that describe the SDSS DR2 survey angular selection function. These random masks are generously made publicly available in the NYU Value-Added Galaxy Catalog and described in Blanton et al. (2004). The random samples we employ in all the measurements are at least 10 times as large as the datasets involved. As discussed in Section 2.1.1, the distributions for the volume limited samples of the different categories of objects are not uniform, and are different from sample to sample. We therefore build individual radial selection functions for the random masks corresponding to each sample to be studied; we randomly assign redshifts that follow distributions constructed based on 2nd order polynomial fits to the observed object distributions. We have explicitly tested the CF estimates for different parametrizations of the redshift distributions , and find that they do not significantly affect the results; the power-law fits, described below, show slopes and amplitudes that remain consistent within the value range bordered by uncertainties.
As discussed above, we do not account for the potential biases on small scales introduced by the fiber collisions, because we have no reasonable means of doing so. In other estimates of galaxy clustering properties, such biases have been corrected for by assigning each pair member whose redshift was not obtained because of the fiber collision the same as the pair member whose redshift was measured. However, for the purpose of studying the dependence of clustering on spectral characteristics we cannot apply such correction because there is no physical motivation for assigning to the unobserved pair member the spectral properties found to characterize the object whose spectrum is available. Therefore we treat the fiber collisions as a contribution to incompletness in the survey; this variation of the completeness with angular position of the is accounted for in the random catalogs described above. This procedure leaves a residual effect due to fiber collisions that is significant at very small scale, i.e., at comoving transverse separations of 0.14Mpc (the corresponding linear scale for 55, at the outer edge of our samples = 50,100 kms-1). We restrict our measurements to separations Mpc and note that the incompletness biases due to fiber collisions should similarly affect all of the subsamples we analyse, and thus are not a significant concern for this study because our focus is on the relative differences between the CF characteristics.
We calculate the correlation functions using the Landy & Szalay (1993) estimator,
| (2) |
using bins in pair separation that are logarithmically spaced with a width of 0.33 in log(Mpc), starting from 0.147Mpc. In this formula, and are the number of pairs in the data and random catalogs respectively, while is the number of pairs between the data and the random samples. Pair counts are estimated using the computationally efficient “npt” algorithm described in Moore et al. (2000). We estimate the covariance matrices of the uncertainties using the statistical jackknife method (e.g., Lupton, 1993), for which we divide our samples into 75 separate regions on the sky, of approximately equal area, , and estimate the CF 75 times, each time leaving out one of these regions (see Zehavi et al. (2002) for a more detailed description of this method and for a discussion on its robustness in estimating the uncertainties).
We quantify the clustering properties of a given sample by fitting the measured CF with a power law of the form
| (3) |
where denotes the comoving separation between the object pairs, is the correlation length used to express the amplitude of clustering, and the slope quantifies the ratio of small to large scale clustering. In the fitting process we employ separations Mpc Mpc, in order to avoid separations on which the CFs are derived from fewer than 20 data-data pairs.
The CF of the full volume limited “Best” galaxy sample is characterized by a correlation amplitude Mpc, and a slope . These values are consistent with previous calculations of the redshift-space clustering of the SDSS main galaxy sample, both for magnitude and volume limited samples similarly bounded in luminosity (Zehavi et al., 2002, 2005).
3.1. Clustering Dependence on Spectral Properties
We examine here the redshift-space CF for various subsamples constructed based on sets of properties that reflect differences in the dominant ionization mechanism, i.e., accretion vs. star-forming type, or provide clues to the physical conditions of the line-emitting regions. We compare correlation functions of different spectral classes, and investigate the degree to which other emission-line related parameters, e.g., [O III] and [O I] luminosities, intrinsic neutral hydrogen column densities (), and electron densities , may influence the results.
The results of power-law fits to the CFs estimated for various subsamples of the parent “Best” absolute magnitude limited galaxy sample considered in this analysis are recorded in Table 2, together with results for the CF of all galaxies in the sample. Object sample definitions as a function of and are described in Tables 3, and 4. It is clear that the clustering properties of subsamples of objects governed by distinct spectroscopic characteristics are different. In the following subsections we discuss these results in detail.
3.1.1 Spectral Class
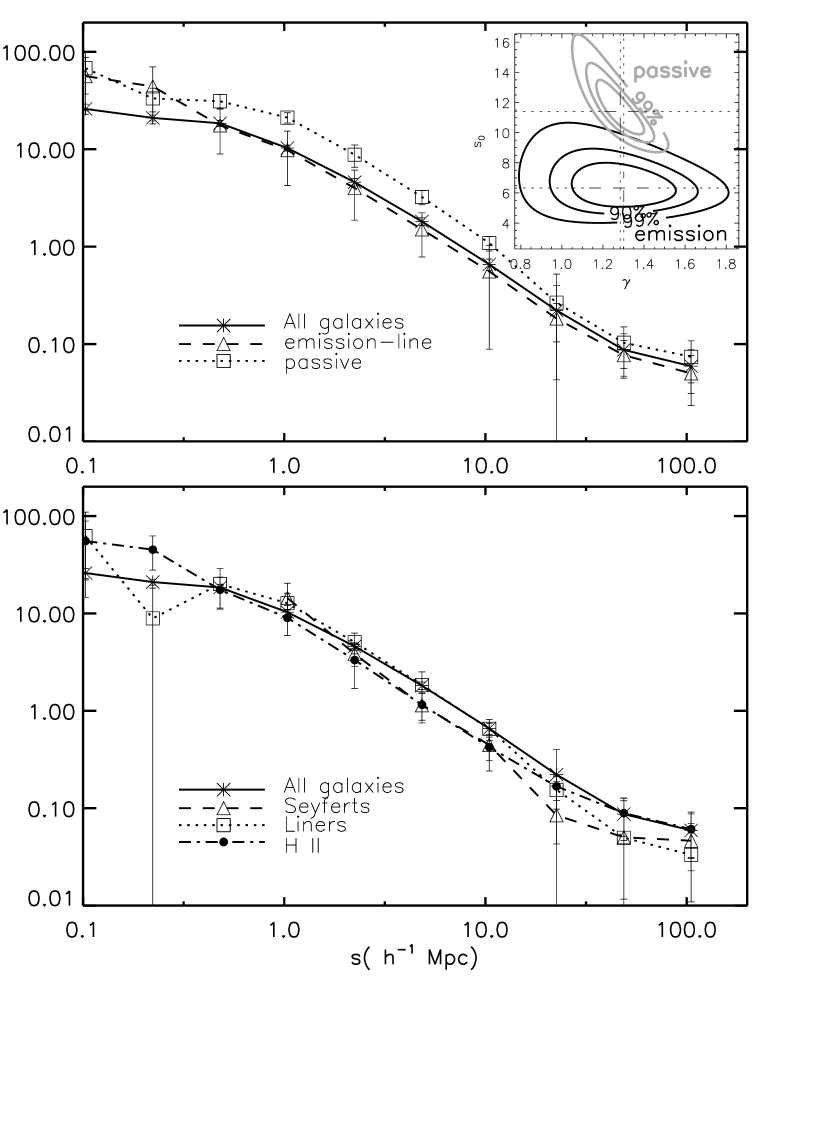
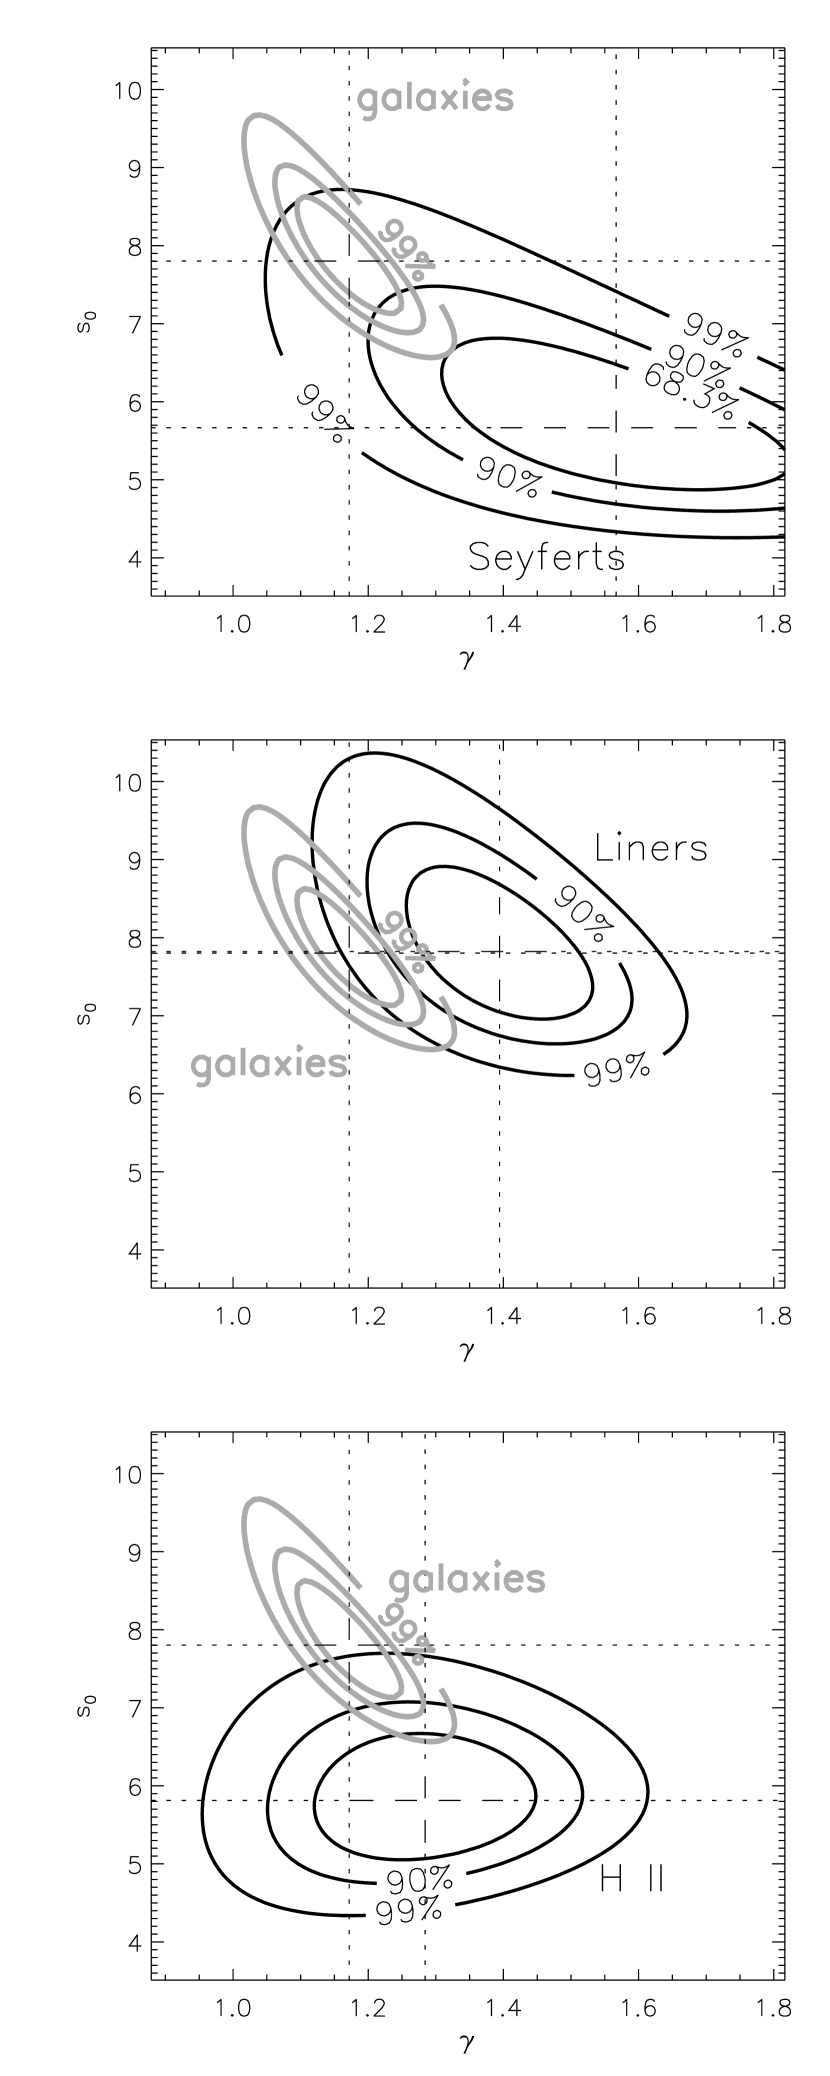
The CFs estimated for emission-line objects, passive objects, and the three distinct line-emitting subsets of Seyferts, LINERs and H ii’s, are illustrated in the upper and lower panels of Figure 7. We present and compare the shape and amplitude of power-law fits to the CFs for samples whose definition both include and exclude constraints on [O I] and [O I]/H, in the right and left panels respectively. The CF of the volume limited sample of all galaxies is also shown for comparison in all panels. The error bars denote the 1-sigma uncertainties. The upper panels include insets that compare the 1-sigma, 90%, and 99% confidence contour levels for the likelihood functions obtained by fitting power-law models to the correlation functions of actively line-emitting galaxies and the passive ones.
The passive galaxies have a substantially higher amplitude and steeper than the emission-line galaxies, with a correlation length Mpc, compared to Mpc for the actively line-emitting sources. This trend is clearly present whether or not the selection of these objects employ the [O I] feature, although the datasets are smaller when [O I] is required in defining the sample and, therefore, the uncertainties are correspondingly larger.
Among the emission-line sources, LINERs exhibit the highest clustering amplitude, while H ii’s show the weakest clustering, at both small and large scales (see lower panels of Figure 7). Seyferts distinguish themselves from the other emission-line galaxies by the relatively steep slope of their correlation function, . This effect might arise if the environment of Seyferts causes an excess (relative to a flatter power law) of AGN activity on a scale larger than clusters or groups; the power-law fits are over separations Mpc, so the excess small-scale clustering is not caused by very close pairs of Seyferts. Overall, Seyferts’ clustering amplitude remains intermediate between that of LINERs and H ii’s.
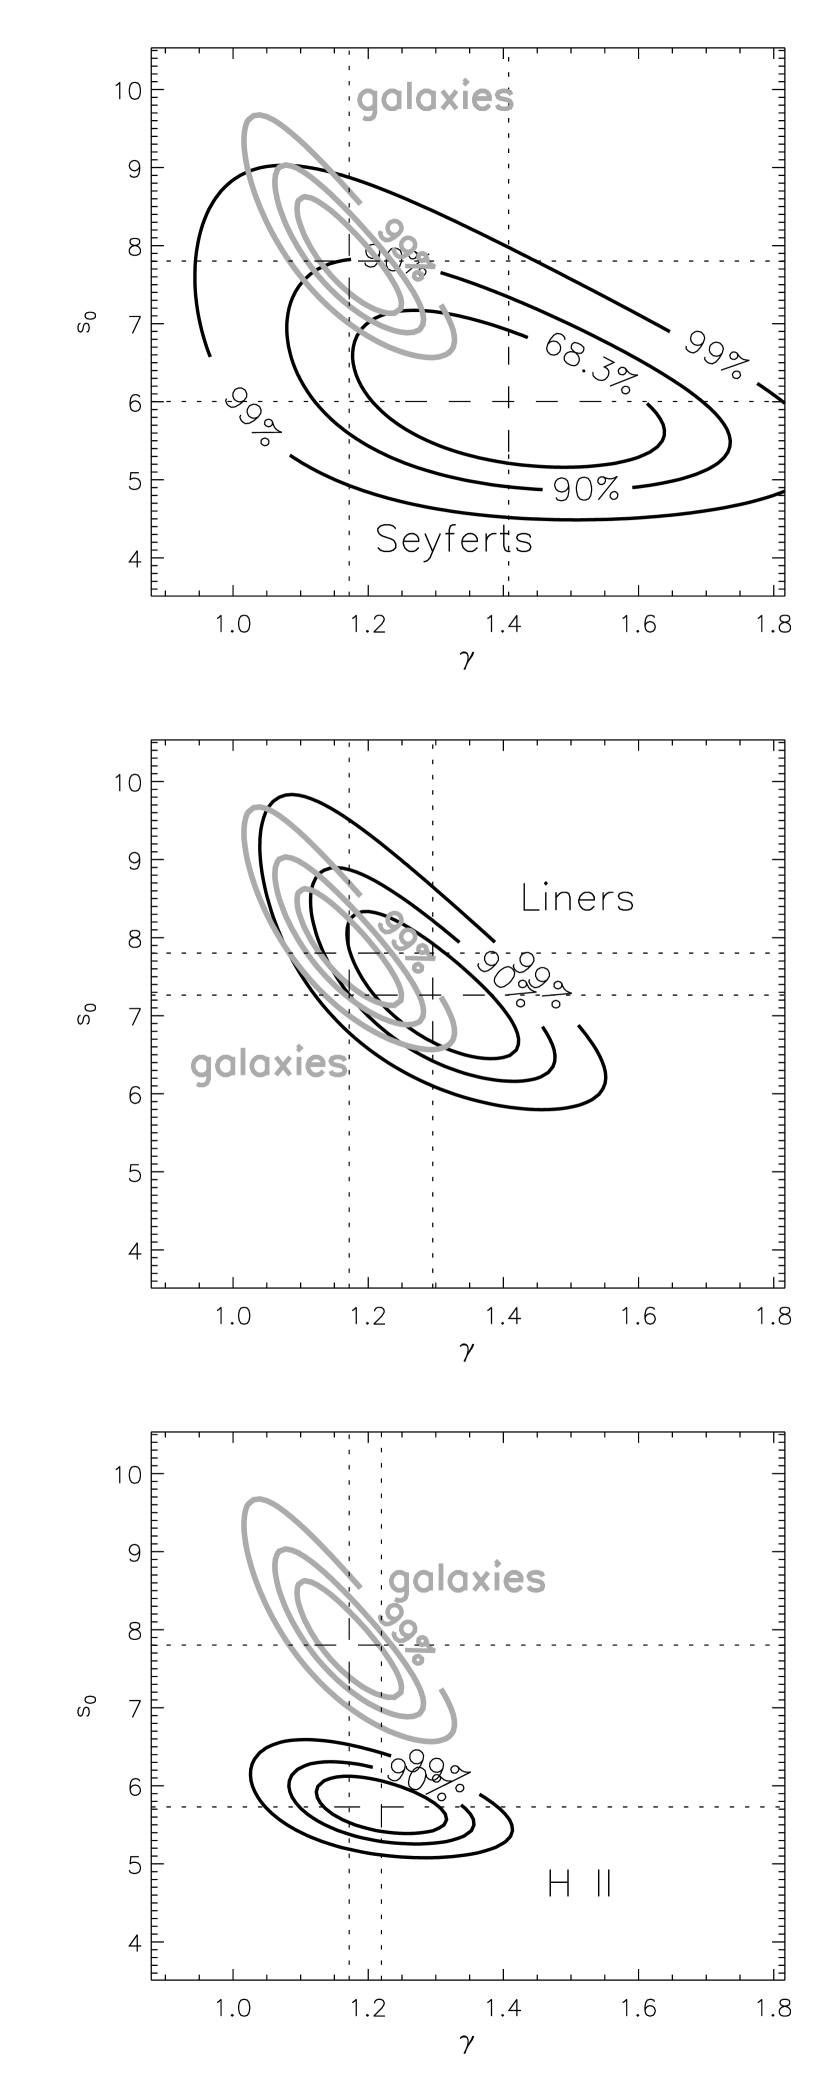
A more quantitative comparison between the clustering properties of Seyferts, LINERs, H ii’s, and of the whole galaxy sample is presented in Figure 8. From top to bottom, we see that the clustering amplitude of Seyferts is significantly smaller than that of the full galaxy sample, LINERS are clustered similarly to the parent galaxy sample, and HII’s are less clustered than all galaxies. The left and right sets of panels are for AGN sub-samples defined without employing [OI] and with [OI], respectively. Because this criterion changes the number of objects in the sub-samples, as well as changing the intrinsic luminosity necessary for this line to be detected at fixed distance, we find slight variation in the statistical significance of these comparisons.
That Seyferts are found to be less clustered than the average galaxies is an important result, and its statistical significance requires some comment. Table 2 shows that the clustering amplitudes for Seyferts and for all galaxies in the main sample are and respectively, which translates into a difference of order 3. In the upper panel of Figure 8 one sees that the 2-dimensional ”1-” limits just touch, and the 90% contours overlap. This overlap arises because the 2-dimensional contours enclose the labeled percentage of the probability in the joint distribution of both and , and these elliptical contours extend beyond the confidence limits that are computed in one parameter at a time (by marginalizing over the other parameter). The natural confidence regions in the 1-dimensional parameter space, say , are the projections of the 2-dimensional regions defined by fixed into this 1-dimensional space of interest. To enclose the same probability, i.e., fraction of points, say 68.3% (or ), as the two parameters and , the corresponding ellipse will correspond to as it must necessarily extend outside of both of them 111e.g., see discussion in Chapter 15 of Press et al. 1992, “Numerical Recipes in C,” http://www.library.cornell.edu/nr/bookcpdf.html. The resulting constraints on and are reported in Table 2.
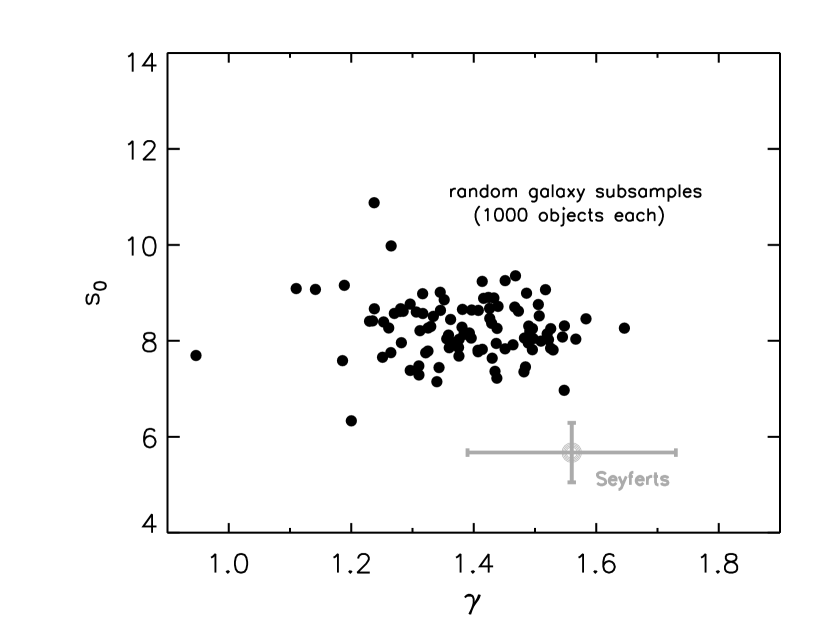
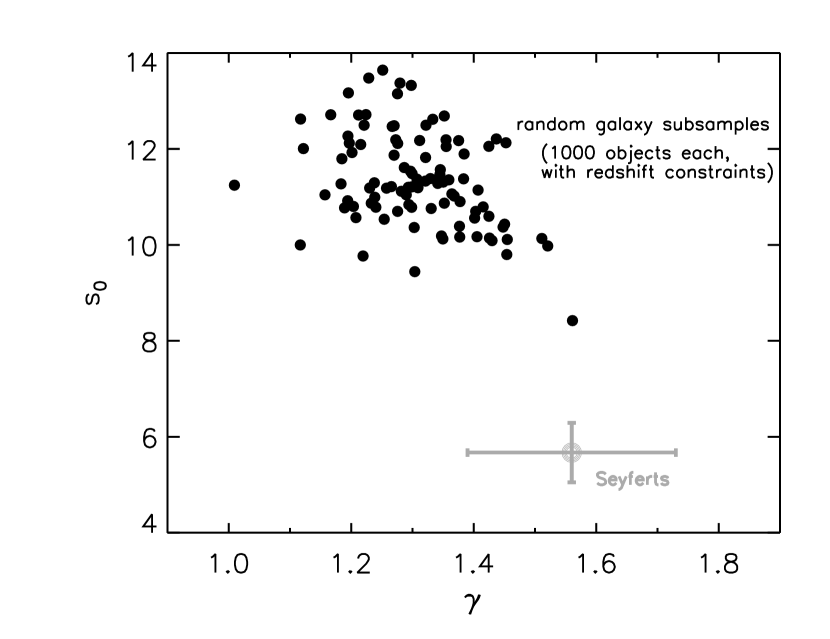
To clarify the statistical significance of the observed difference in clustering amplitude of Seyferts and the parent sample of galaxies, we conduct an additional test. Because the Seyferts are a sub-sample of the volume-limited sample of galaxies, a simple test of the validity of our results is to randomly select sub-samples of galaxies with the same number of objects as the Seyfert dataset, compute the best-fit CF parameters for each, and compare the results with the actual Seyfert CF. We form 100 such “mock Seyfert” samples for two separate cases: 1) by randomly selecting 1000 objects from the parent galaxy population, and 2) additionally constraining the mock Seyfert sample to have the same redshift distribution as the Seyferts. For each mock sub-sample we fit the correlation functions using the covariance matrix built from the variation among the 100 CFs. The results shown in Figure 9 indicate that the CF of the Seyfert sample is inconsistent at confidence with being drawn from a parent population of CF’s of randomly selected galaxies. In both cases, not a single random sample of galaxies has a clustering amplitude as low as observed in the actual Seyfert sample.
It is interesting to note that, while for the samples of Seyferts and LINERs that use [O I] in their definitions the error bars are larger than in the case when this feature is not used, the differences in and become more pronounced, and more statistically significant: LINERs’ is in this case indistinguishable from that of the whole sample of galaxies, while Seyferts’ is much lower and the 1- contours do not touch anymore. On the other hand, of the star-forming galaxies does not actually change between samples that use [O I] or not in their definition. This is yet another clue to the fact that the [O I] emission is not an important characteristic of the H ii galaxies, while it certainly makes a difference in defining more strictly AGN, i.e., Seyferts and LINERs.
Interestingly, regarding the CF characteristics of the data samples of different spectral types we find a slight tendency toward steeper slopes, as compared to that of the galaxies’ CF. Note also that the correlation functions of the sub-samples do not necessarily average to the correlation function of the whole sample; the CF of the whole sample is a weighted sum over the correlations of the sub-samples and the cross-correlations between the sub-samples. It could be the case that the CFs of the sub-samples are steeper because certain environments favor the formation of particular species of AGN. In an extreme example, if Seyferts, LINERs, and H ii galaxies came in clumps of one type only, they would be strongly clustered on small scales, still clustered on larger scales, but have a relatively steeper correlation function because of the extra small-scale clustering. In contrast, the cross-correlations between sub-samples, e.g. between Seyferts and H ii galaxies, would have very little small scale clustering because they would be mutually exclusive on the scale of the clumps, thus the cross-correlation functions would be shallower than that of the whole sample.
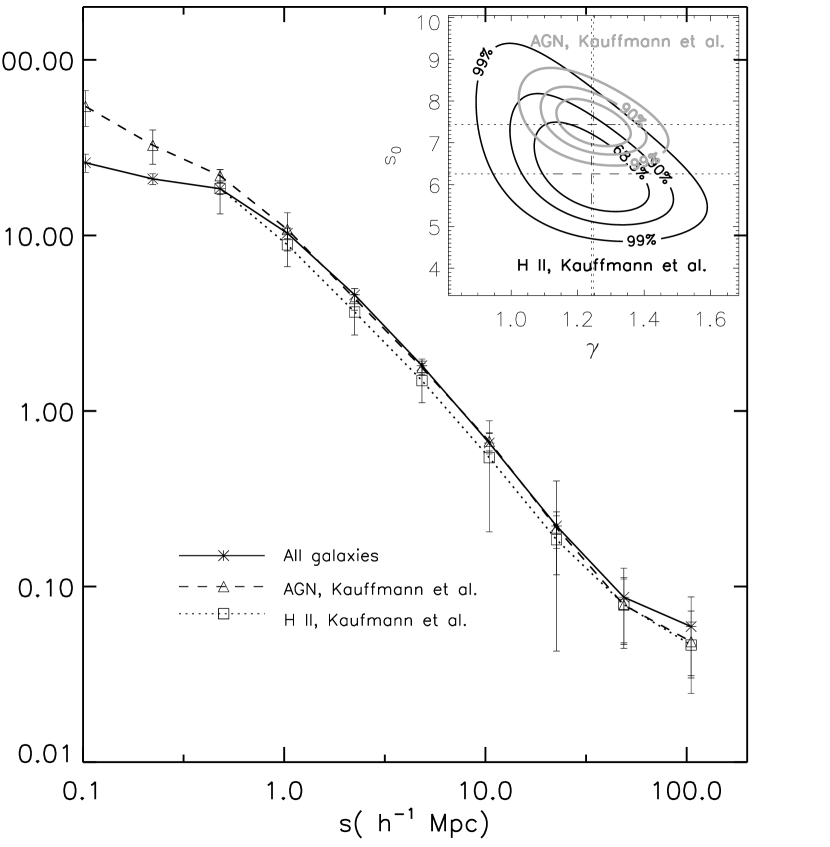
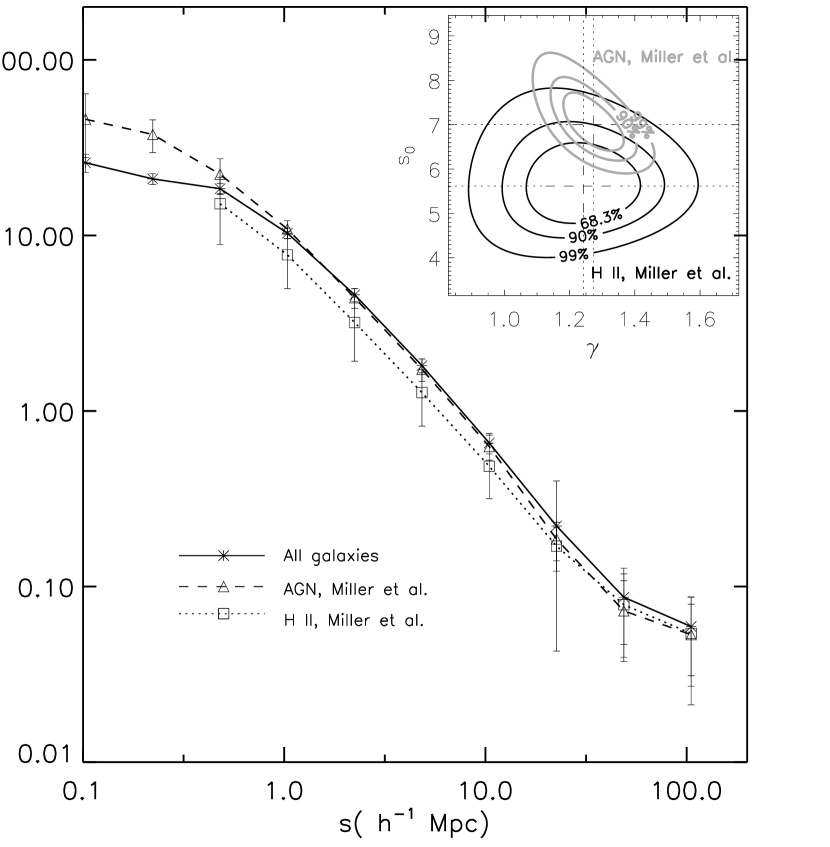
In order to examine our results in the context of previous work on clustering of AGN observed by the SDSS, we also examine the CF of the narrow-line AGN vs. non-AGN (i.e., star-forming sources) using the classifications employed by Kauffmann et al., and Miller et al. Figure 10 shows the CFs estimated for such subsamples of the “Best” volume limited galaxy sample and comparisons of the confidence contours of power-law fits to these CFs. The galaxy CF is also shown for comparison. The fitted power-law parameters and number of objects in each sample are also listed in Table 2. Here we find that AGN samples selected using the criteria applied by Kaufmann et al. and Miller et al. show very similar clustering amplitudes to that of all galaxies, as claimed in previous studies based on estimates of population fractions in cores of galaxy clusters and intra-cluster fields (Miller et al., 2003), or measurements of CFs (Wake et al., 2004). This result is not surprising. We show in Section 2.1.1 that AGN samples selected using these criteria are dominated by LINERs. We also find that LINERs, as a spectroscopically-distinct population, are indeed clustered similarly to normal galaxies. Thus, the resemblance between the spatial clustering properties of such AGN samples and normal galaxies reflects dominance of LINERs in these AGN definitions, and it does not apply to AGN in general, particularly not to Seyferts as a separate class. Similar trends were reported before by Kauffmann et al. (2004) who also note that the environmental effects in the Miller et al. sample are likely to be dominated by LINERs. We show here with great confidence that the environments and the large scale structure of weak and powerful AGN are distinct, and that if these systems are not carefully separated out, one can erroneously characterize the AGN population when instead refers to LINER-like objects only.
The results presented in this section indicate clearly that bona fide narrow-line low luminosity AGN, i.e., the Seyfert 2s, are less spatially clustered than typical galaxies. These findings have important implications for the environment of the host galaxies of AGN. The statistics of peaks in a Gaussian random field suggest (and results of fully non-linear N-body simulations demonstrate) that a large clustering amplitude is indicative of a population of objects that inhabit high peaks (dense regions) and, conversely, that a low clustering amplitude implies a sample that probes lower peaks of the field and less dense environments. Thus, we infer that Seyferts and H ii galaxies tend to prefer less crowded environments than typical galaxies, while LINERs seem to follow the galaxy spatial distribution, as their correlation function is, within the uncertainties, identical to that of the whole galaxy sample. The cause of the relatively steeper slope of the CF of Seyferts is unclear, but it may be further evidence of a special environment for promoting their activity. Our analyses seem to confirm the trends reported by Miller et al. (2003), which show a the predilection of the star-forming galaxies to reside in more sparsely populated regions, and of the passive, non-line-emitting galaxies to live in more dense environments.
3.1.2 [O III], [O I] line luminosities
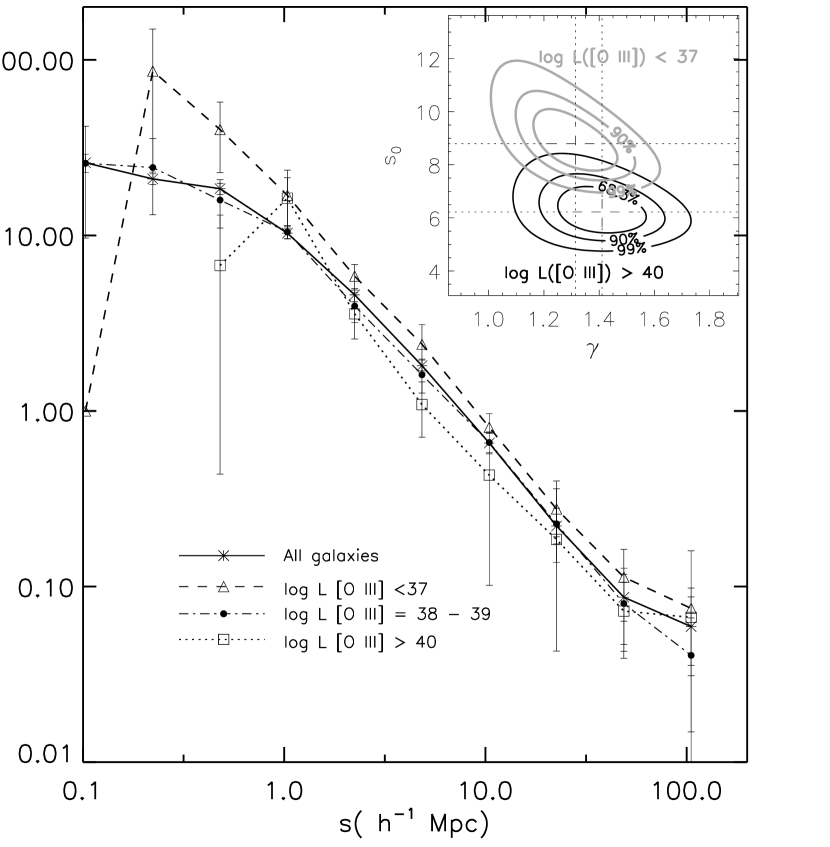
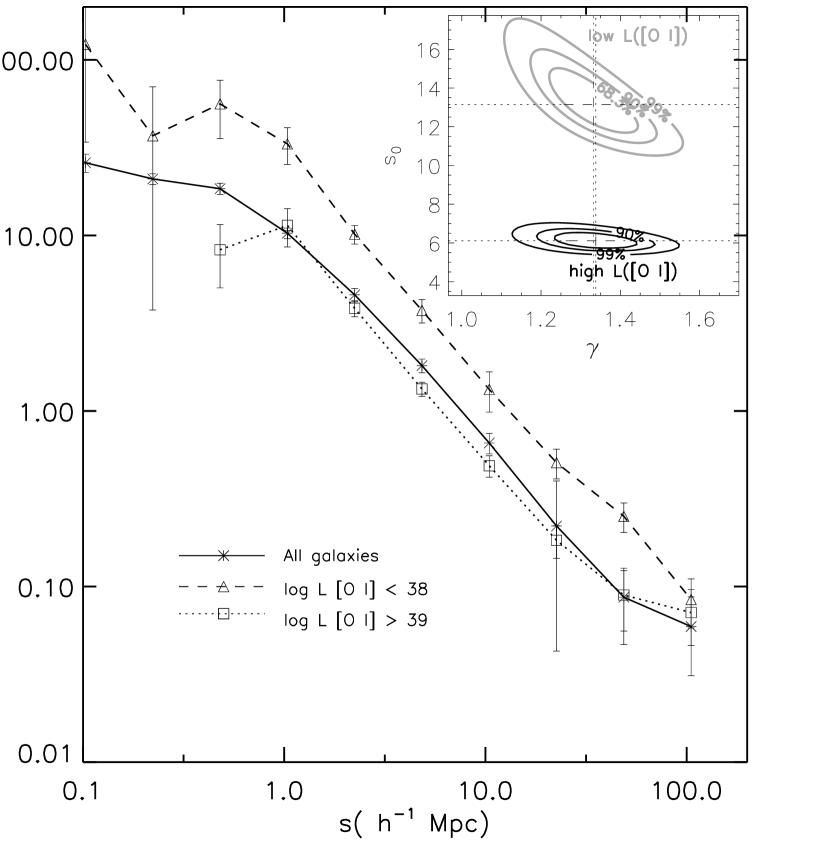
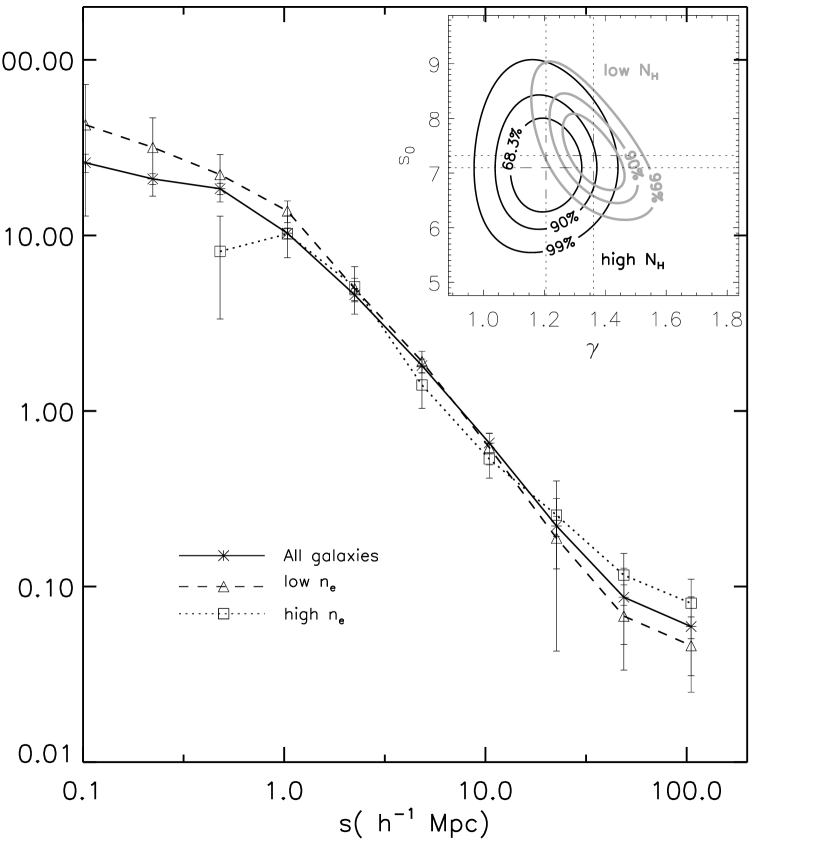
Figure 11 shows the CF of subsamples selected by luminosities of the forbidden narrow emission lines [O III] and [O I]. We refer to objects that have log and log as the high and low samples respectively. Line luminosities are in units of erg s-1. Conforming with the definitions listed in Table 2, a similar sample name designation is used for the low and high object samples. Our calculations show that objects that are bright in [O III] and/or [O I] are significantly less clustered than sources that are less luminous in these lines. We confirm the dependence of the clustering amplitude on , as seen by Wake et al. (2004). For the first time, we detect an even stronger variation of clustering with .
For objects with relatively high [N II]/H ratios (above the Kewely et al. curve), [O III] is, as discussed by Kauffmann et al. (2003), only weakly affected by residual star-formation, and therefore capable of distinguishing line emission activity due to accretion from that originating in star formation. As illustrated in Figure 6, using our spectral classification, the high objects include most of the Seyferts. Interestingly, the subset of luminous emission-line galaxies includes almost no LINERs, which clearly dominate the low luminosity end of the distribution. This trend supports and justifies further the physics behind the correlation found by Kauffmann et al. (2003) between the ionization state of the AGN, as expressed by their position angle in the [N II] diagnostic diagram, and the AGN [O III] luminosity. It is important to note that, because the number of Seyferts remains small in general, H ii’s remain the dominant type in the high subset, comprising % of these objects; the small fraction of H ii’s with high makes a large contribution to this subsample and so complicates interpretation of our estimates of the CFs. For the sake of comparison, note also that strictly among AGN classified based on Wake et al. (2004) definition, that implicitely exclude H ii’s, the highest third in remains still weakly represented by bona-fide AGN: the Seyferts make up only 30% of the objects, while the rest of them are either LINERs or unclassified emission-line objects.
The CF of the high systems shows a low clustering amplitude, as expected from the properties of the objects that comprise the sample. Both Seyferts and H ii’s are weakly clustered, with amplitudes that are similar, within the uncertainties. The steep slope of this CF, , suggests a strong influence in behavior from the Seyferts. The low sources exhibit a CF that is consistent in both the amplitude and the slope with what we measure for the LINER sample. Such strong correspondence may indicate that low levels of activity, either originating in star formation or accretion, is predominantly present in highly clustered hosts, and thus more probable in crowded environments.
The variation in the clustering amplitude between the samples of low and high is very strong, showing a difference of . As with selection by , the low objects have large clustering amplitudes, while the more active sources remain weakly clustered. The dominant majority of low objects are LINERs, suggesting again that galaxies that manifest the lowest level of activity are the ones that are strongly clustered. LINERs remain very rare (less than 5%) in the high sample. The high subset is highly populated by Hii’s (%), and, although this dataset includes the majority of Seyferts, such systems make up only % of the objects. Consequently, the clustering properties of the high objects are close to those of Seyferts and star-forming galaxies, revealing a relatively small clustering amplitude.
As discussed in Sections 2.1.1 and 2.2, a strong link is expected between the strength of the [O I] emission and that of the accretion process. Thus, the clustering dependence on may be another indication of the relationship between the level of AGN activity in galaxies and the properties of their host dark matter halos: the active nuclei that exhibit the lowest levels of activity due to accretion are the most clustered, and thus, the most massive ones. Any signature of star-formation activity is feeble, if present at all in these systems; although numerically dominant among the emission-line systems, the H ii-like galaxies are significantly underrepresented among the low luminosity objects (see Figure 6). On the other hand, the most active sources, whether in terms of star-formation or accretion, are weakly clustered, thus we infer that these sources are hosted by relatively less massive systems.
3.1.3 Gas Density & Intrinsic Extinction
As Figure 6 illustrates, LINERs stand out among line-emitting objects in other aspects as well. Their electron densities are lower than those of Seyferts but generally higher than in H iis, and they show little intrinsic obscuration. A clear segregation of LINERs and Seyferts as a function of these parameters, similar to that as a function of and , is possible only for very small subsamples, and thus CF estimates remain impractical. Nevertheless, an investigation of the degree to which the clustering amplitude depends on and remains of interest even if the subsamples characterized by low and high values of these parameters comprise a mix of spectral types. Such analysis offers additional insights into the origin of the clustering differences exhibited by sources with contrasting physical conditions, especially those that may characterize the availability of fuel for accretion or star-formation.
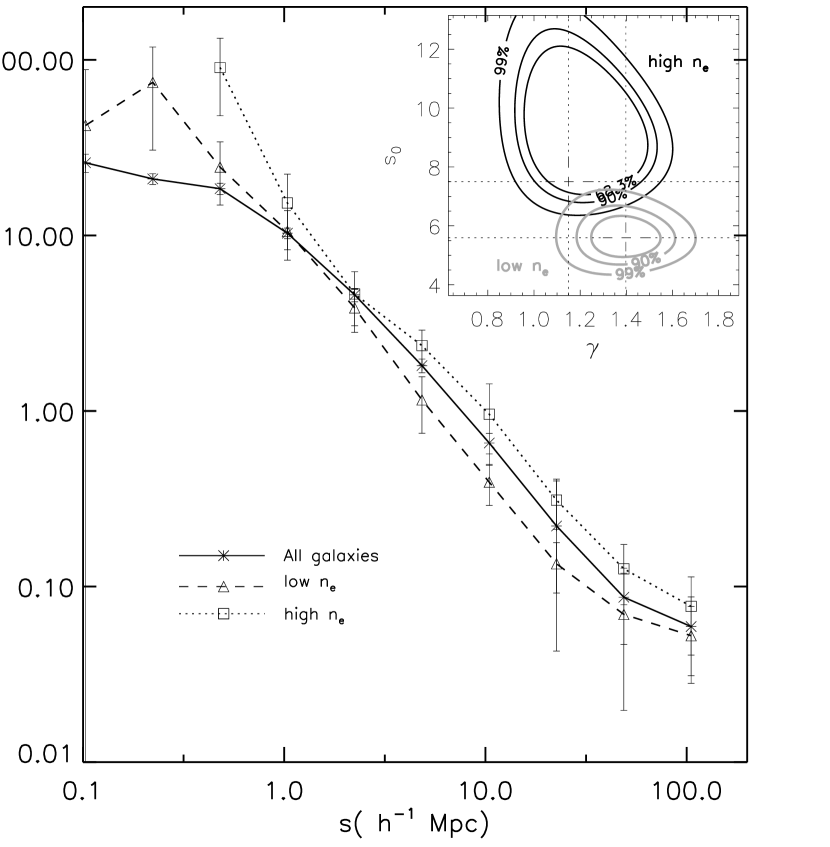
Figure 12 shows a comparison of the CFs estimated for subsamples characterized by low and high values of and , with the sample definitions given in Tables 3 and 4. Consistent with the trends found so far, the low subsample, in which 70% of the objects are H ii galaxies, has a significantly lower clustering amplitude. Interestingly, the high subsample shows a high clustering amplitude that is consistent with that of the LINERs and the average galaxy sample even though it comprises a generously mixed population of emission line systems: 40% LINERs, 18% Seyferts, 19% Hiis, and 23% unclassified line-emitters (that do not comply simultaneously with all the three diagnostic diagrams, see Section 2.1.1). It is striking that only a slight number dominance of the LINERs in this subsample of sources with relatively high leads to such results. This trend suggests that the moderately high unclassified emission-line objects have clustering properties more similar to LINERs than to Seyferts or Hiis.
The subsamples split on shows clustering trends that are consistent with the results presented so far. There is a slight suggestion that the less obscured sources ( cm-2), in which the LINERs are in majority, are more clustered, while the highly obscured systems, which are mostly star-forming objects, are less clustered. These differences reflect once more a potential link between the amount, nature, and availability of the fuel that powers the galactic activity and their clustering characteristics: the dusty spirals that usually live in less crowded environments are more likely to harbor H ii’s in their centers, while the nuclei of ellipticals would be generally dust-free due to ram-pressure stripping in their more crowded, cluster-like habitats, and thus would show LINER-like activity and physical properties.
3.2. CF Estimates and Host Galaxy Properties
Studies based on large redshift surveys, 2dF and SDSS in particular, have clearly shown that spatial clustering of galaxies depends on galaxy structure (or morphology), luminosity, and internal star formation history, as measured by spectral type or colors (Norberg et al., 2001, 2002; Zehavi et al., 2002, 2005; Budavari et al., 2003; Madgwick et al., 2003). The sense of this dependence is that more luminous, redder, and earlier type galaxies, which also harbor older stellar populations, are generally more clustered than the rest of the galaxies.
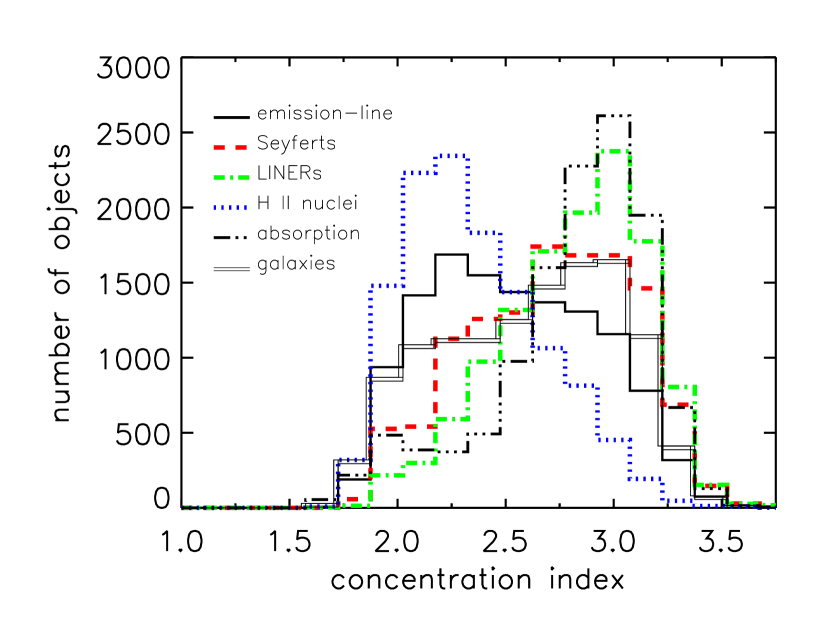
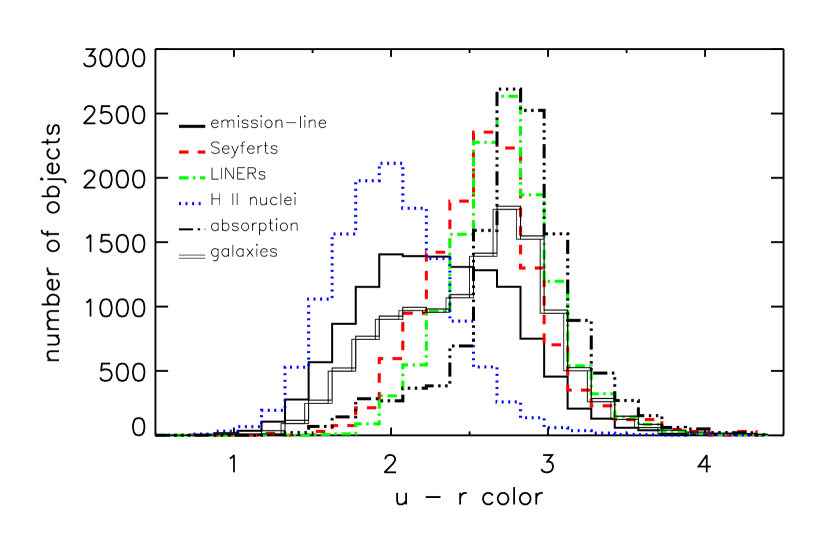
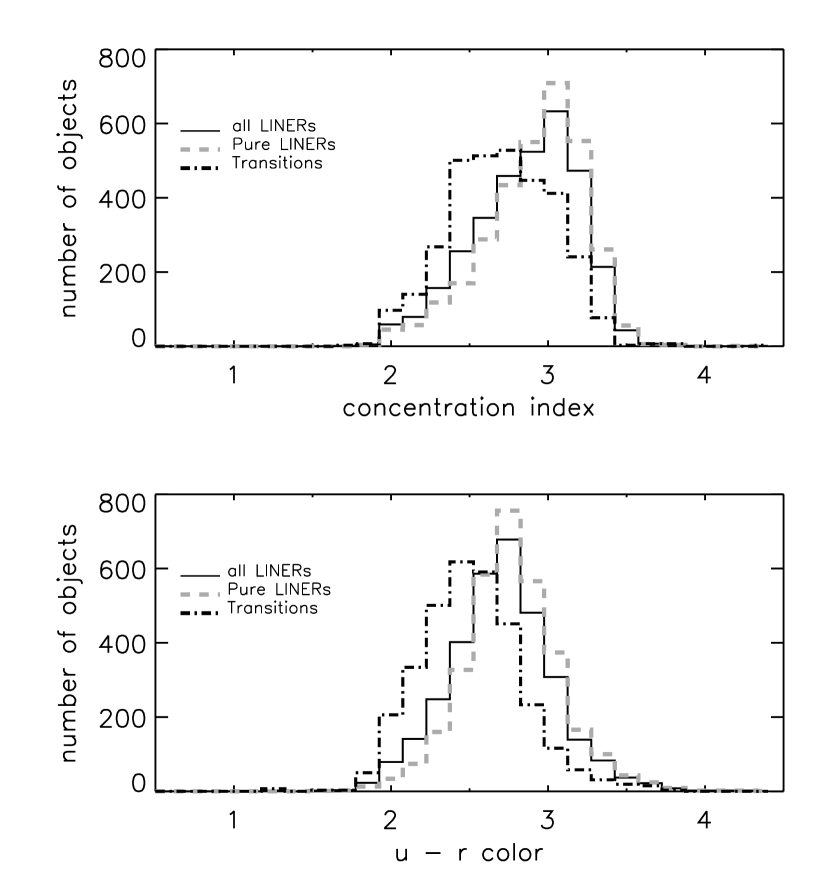
The well-described dependence of clustering on galaxy properties might explain some of the difference we see between the clustering amplitude of the H ii’s, which seem to prefer bluer, later-type hosts, and that of AGN-like objects (i.e., Seyferts and LINERs), which are more likely to be hosted by red, early type galaxies. As illustrated in Section 2.1.1, AGN samples defined based on simple classification schemes are dominated by LINER-like behavior and are therefore more clustered than the H ii systems (i.e., Figure 10). The median values of concentration indices, colors, and other parameters of the host galaxies of our spectroscopically-classified subsamples (see Figure 13, and Table 5) clearly illustrate the distinct preferences of the stellar and non-stellar photo-ionized emission-line activity for different host types.
The variation of clustering among Seyferts, LINERs, and H ii systems is not, however, so easily explained. When we use more detailed spectroscopic classification to separate Seyferts and LINERs, we find that they differ significantly in their clustering properties despite our finding, consistent with previous studies (e.g., Ho, Filippenko & Sargent, 1997b), that the large-scale, global properties of their hosts are quite similar. Although there is a slight shift of the Seyferts toward bluer and later type hosts than LINERs, comparison using a Kolmogorov-Smirnov (KS) test shows that their distributions in concentration index, , and color are consistent with being withdrawn from the same parent population (KS = 0.104, KS = 0.617). LINERs’ host morphology () and color () distributions are quite different from those of the whole galaxy sample, both in the shapes and median values of these distributions (KS = 4.8e-14, KS = 5.6e-11). Yet, the clustering amplitudes of LINERs and typical galaxies are very similar. Likewise, Seyferts and the passive galaxies are close to sharing the same parent distributions in host properties (KS = 0.108, KS = 4.2e-4), although their clustering properties are markedly different. Furthermore, the clustering amplitudes of Seyferts and H ii’s are quite similar, but their galactic hosts are, beyond any doubt, very different in type.
To summarize, using broad photometric morphological measures (e.g., concentration index and color), we find no evidence that the difference in clustering amplitudes of different spectral classes of galaxies, and in particular Seyferts and LINERs, is driven by the density-morphology relation.
In the light of the effects the host characteristics have on clustering, the differences in exhibited by the low and high and samples merit further attention as well. As it can be seen from Figure 14, these datasets are clearly distinguishable in their median concentration indices and colors, with which the clustering amplitudes seem to correlate. The sources with low [O I] and [O III] luminosities are also the reddest and generally early in their morphological type, as revealed by their high median value of , and present strong clustering. The most luminous sources in [O I] and [O III] are bluer () and of later type morphologies (), and are weakly clustered. Thus, it may be apparent that the different clustering amplitudes for the high and low luminosity objects is at least partially driven by the morphology-density relation that galaxies usually obey. However, based on exhaustive studies of the color and host type dependence of the correlation function, Zehavi et al. (2002, 2005) reveal differences in of only Mpc, which are smaller than those between our low and high systems, and especially those we observed between the objects with high and low (see Table 2). Moreover, our subsamples span a significantly reduced range of values in their median and than those employed in the Zehavi et al. comparisons, suggesting that, the morphology-color effect on the discrepancy in measured in our samples should be even smaller. We thus conclude that the differences in the clustering amplitudes of objects that differentiate themselves through their [O I] and [O III] luminosities are primarily constrained by these parameters, and only secondarily by their host properties. In the following section we discuss various scenarios that may explain such effects.
4. Discussion
4.1. AGN Fueling & Life Cycle
Under simple assumptions, the amplitude of the correlation function can be used to estimate the typical mass of the dark matter halos in which the objects reside (e.g., Kaiser, 1984; Grazian et al., 2004; Magliocchetti et al., 2004), and for AGN in particular, to estimate their typical lifetime (Martini & Weinberg, 2001). If, as expected in the hierarchical picture of structure formation, the most massive systems are more clustered, our results suggest that Seyferts live in less massive halos than those that host LINERs. The empirical relation between black hole mass and galaxy mass (Ferrarese, 2002; Baes et al., 2003), that is based on the relation which seems to hold similarly for both inactive galaxies (Gebhardt et al., 2000a; Ferrarese & Merritt, 2000) and AGN hosts (Gebhardt et al., 2000b; Ferrarese et al., 2001; Nelson et al., 2004; Onken et al., 2004; Greene & Ho, 2005), implies that the black holes harbored by these galaxies must scale in the same manner. Thus, Seyferts’ black holes must be smaller than those that live within LINERs. Via direct comparisons of 2PCF for simulated dark matter and for observed SDSS galaxies, Wake et al. (2004) reached similar conclusions regarding the masses of the black holes.
Together with the different trends we see in the physical properties of active galaxies with distinct spectral classification, this possible distinction in their BH mass offers the missing link in our understanding of their intrinsic nature. The high and of Seyferts suggest that their smaller BHs are accreting at relatively higher rates or maybe more efficient than the larger BHs whose activity is classified as LINER-like. The low activity level of LINERs’ massive BHs may well be a consequence of the fact that these systems have less fuel available for accretion. Both the electron density and column density of surrounding (dusty) material are significantly lower in these objects, suggesting a scarcity of matter supply. Seyferts, on the other hand, show the highest values of and a relatively large range in suggesting that in these sources fuel can easily be provided at levels sufficient to sustain accretion at modest levels.
In this scenario, Seyferts grow their BHs at a relatively fast pace, and this activity would be expected to last for short periods of time. Such a highly active phase would end with the exhaustion of surrounding accretion fuel, when the BH mass reaches levels similar to those of LINERs, after which weak (or inefficient) accretion can continue for much longer time. This picture is consistent with the relative numbers of Seyferts and LINERs. If Seyferts are simply the manifestation of the stronger but short accretion phase, then their numbers must be small, especially when compared to those of LINERs that subsist much longer at low activity levels and thus are more common among active galaxies. The results of our AGN classification, together with other previous studies discussed above (see section 2.1.1) indicate indeed that LINERs numerically dominate the AGN samples, as the LINER-type emission is found in at least three times more galaxies than Seyfert-like activity.
If LINERs harbor more massive black holes then, as suggested by the close connection between BH mass and bulge size in their host galaxies (e.g., Magorrian et al., 1998; Graham et al., 2001), LINERs’ hosts must be more bulge-dominated than those of Seyferts. Although we have seen that the Seyfert and LINER overall distributions in and color are very similar, the median values show small differences (see Table 5) indicating slightly higher and redder colors for LINERs, consistent with the expected trend. Future larger SDSS samples, together with more successful morphology classification schemes (Park & Choi, 2005) should allow more detailed investigations of such feature.
4.2. The H ii & the Transition Systems
Further, we may extrapolate this picture to galaxies whose nuclear activity is dominated by star-formation, the H ii systems. Assuming that the same scaling relations hold for these sources, the weak clustering of H ii’s implies that they harbor relatively small black holes in their centers. In general, they show moderately low, quiescent [O I] and [O III] luminosities. However, because they are very numerous, the high luminosity tail of their line-emission distribution dominates the statistics of the sub-sample of luminous actively line-emitting galaxies. There is a generally high level of obscuration in these objects, as shown by their large column densities . The overall low values that characterize the emitting gas in H ii’s suggest that fuel for eventual accretion is tenuous in these galaxies. Thus, if their BHs are accreting, the rates must not be high or, if the BHs are actively accreting, the the resulting radiation is highly obscured. In other words, even if the kinetic energy output from the central few tens of parsecs is as strong as that of the Seyferts, there is only a very small fraction that gets transferred to the thermal plasma to produce the enhancement in the optically collisionally excited lines, at the level seen in the accretion-powered Seyferts or LINERs. Consequently, any accretion signature due to robust activity would be sub-dominant in the H ii’s spectra because it would be buried in the surrounding emission originating in stellar heating.
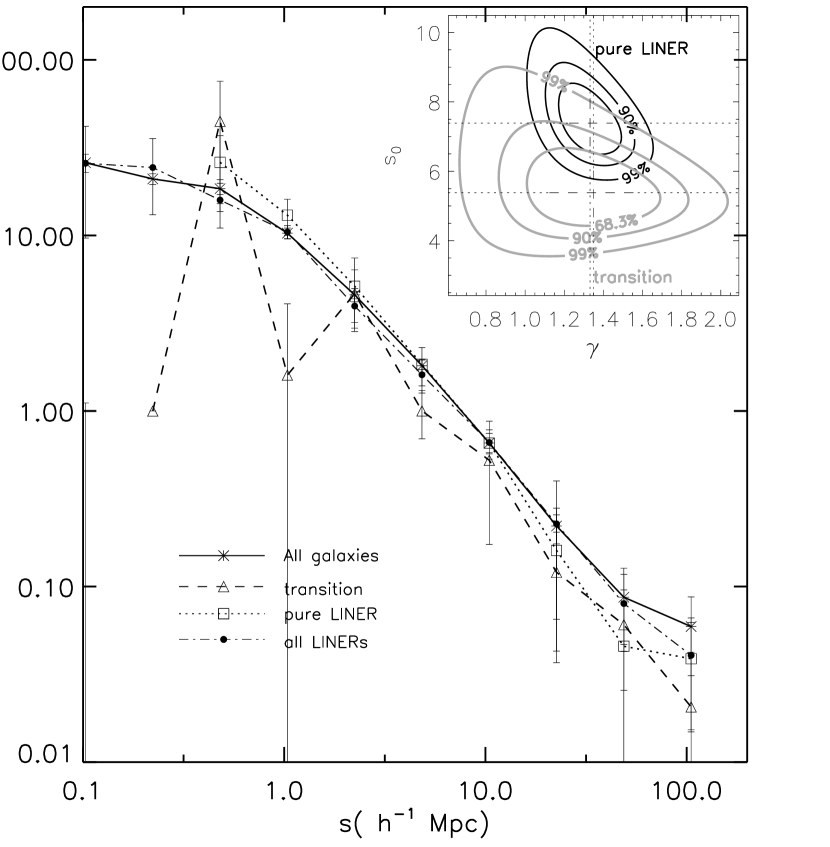
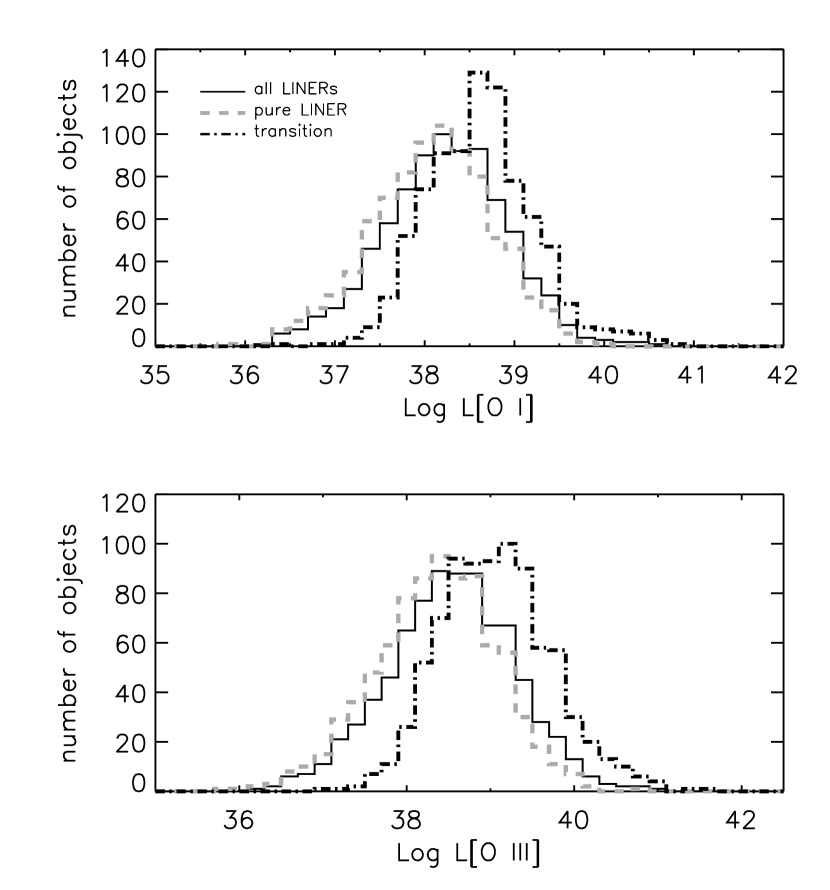
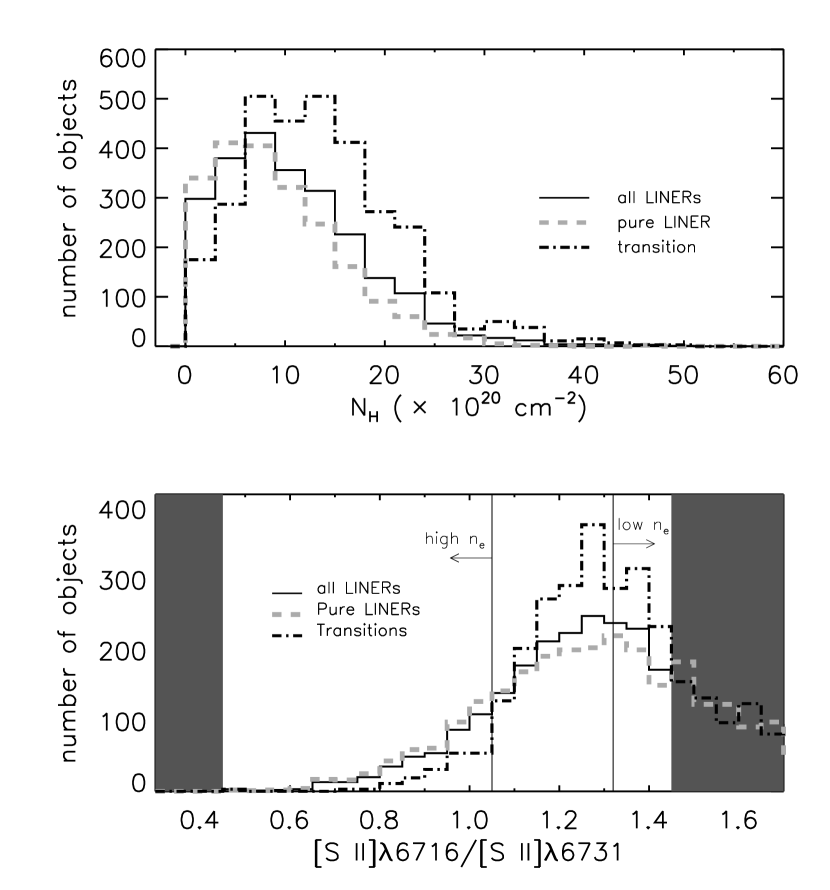
We now turn to consider the Transition objects using similar arguments. Figure 15 illustrates the CFs estimated for the Transition and Pure LINER samples (see definition in Table 1) along with a comparison of the distributions in and the color for these samples. Figure 16 illustrates how Transition systems and the Pure LINERs compare in terms of , , , and . The results of the power-law fitting of the correlation functions, that are also recorded in Table 2, show a great discrepancy in the clustering amplitudes of these two sub-categories of LINERs. The Pure LINERs, which constitute the majority of the LINER sample, remain strongly clustered with an amplitude similar to that measured for the whole LINER sample and consistent with that of the whole galaxy sample. The Transition objects are clearly less clustered than the Pure LINERs, and are comparable in their clustering amplitude to Seyferts and/or H ii’s.
As expected, the intrinsic properties of the Transition objects suggest a tendency toward a more Seyfert or H ii-like behavior. These systems show systematically larger and , and higher than the Pure LINERs. However, the nature of the Transition objects continues to remain ambiguous. Their lower makes them more similar to the star-forming systems than to Seyferts, while their host galaxies remain in general of early-type, in the range of those that usually harbor Seyferts, not H ii’s. Their clustering amplitude is significantly lower than that of the typical red, early type galaxies. Thus, a possibility for the power source in these objects is a small black hole that is accreting at rates that are higher than those in LINERs but still low, seemingly due to the general fuel deficiency. Given that the obscuration remains relatively low in these sources, moderate activity originating from such a source could explain their intermediate behavior between that of traditional AGN and H ii systems.
Our own Milky Way seems to provide the most nearby example of a typical H ii or H ii/LINER transition object, as outlined above. There is compelling evidence for the presence of a relatively low mass Galactic black hole (e.g., Sch del et al., 2003; Ghez, 2004) that is accreting, as shown by radio (Sgr A∗ source, Balick & Brown 1974) and X-ray (Baganoff et al., 2003) emission, and which exhibits large circumnuclear extinction ( 31 mag; Rieke, Rieke & Paul 1989). In terms of its nebular luminosity, surface brightness distribution, and ionization, Shields et al. (2005) reason that the Galaxy may be a typical example of a H ii or maybe a transition system, although its Sbc Hubble type is most consistent with the former type of emission-line object.
4.3. Environment & AGN Activity
The importance of the role that interactions with other galaxies plays in triggering efficient gas fueling in AGN remains a matter of debate. Although there is some evidence that the frequency of occurrence of Seyferts in pairs and groups is higher than among isolated galaxies (Kelm et al., 1998, 2004), no clear relationships are found between the presence of AGN and detailed morphological properties that are signatures strong interactions (e.g., bars, see Keel 1996, Ho et al. 1997).
A problem with many previous investigations of the environments of AGN is that their definition as a class relies on relaxed definitions of such objects which result, as illustrated in Section 2.1.1, in samples dominated by LINERs. The influence of Seyfert-like behavior remains negligible in such studies due to the small fraction of such objects. For this reason, results that infer that AGN environments are undistinguishable from those of the normal, inactive galaxies (Miller et al., 2003; Wake et al., 2004) apply for LINERs, but not necessarily for Seyferts. We find that LINERs and Seyferts differ not only in their intrinsic physical characteristics (ionization level, obscuration, density of their line-emitting gas) but also in their clustering properties. It is also important to understand that environmental properties may vary with spatial scale. For instance, the unusually steep slope of the Seyferts’ CF suggests that these sources may present extra clustering at small scales, despite a generally low clustering amplitude at scales Mpc. Thus, it is possible that LINERs and Seyferts share similar small scale habitats, while their large scale environments are quite different.
To compare the small-scale environments of different classes of AGN, we examine local galaxy density on a scale Mpc. For the spectroscopic samples we built and analyzed in this study, we employ Blanton et al. (2005) galaxy overdensities estimated by counting all galaxies around each object in cylinders Mpc in radius and 1,600 km/s long (in the redshift direction) centered on the source. The tracer galaxies are a volume-limited sample with , and M. We find that the median overdensities for Seyferts, LINERs and H ii’s are 6.15, 6.13, and 4.17, respectively, suggesting more crowded environments for accretion-powered AGN than for objects with line emission dominated by star formation. The passive galaxies show the largest median overdensity, 9.39. For comparison, the median overdensity for the whole galaxy sample is 6.34. These results support our inferences from estimates of the CF that suggest a higher density environment for passive galaxies and a relatively lower local density around the H ii’s,. The similarity in galaxy densities around Seyferts and LINERs on this small scale may be a consequence of the Seyferts’ extra clustering at small scales; the density estimates characterize the environment only at scales Mpc, while the clustering amplitudes, which show LINERs to be more strongly clustered, are obtained by fitting the CFs at scales Mpc.
If the typical environments of LINERs are no different than those of galaxies, then major mergers, harassment (Lake, Katz & Moore, 1998), or other cluster-related mechanisms are unlikely to be the trigger for fueling nuclear activity in these objects. As discussed by Waskett et al. (2005), because the number of close companions of modest luminosity AGN (i.e., LINERs) is very similar to that of non-active galaxies (Waskett et al., 2005; Grogin et al., 2003), and because their spatial distribution is unbiased relative to that of the normal galaxy population (Miller et al. 2003, Wake et al. 2004, Section 3.1.1 of this study), a possible cause of activity in these AGN may be minor mergers.
Seyferts, on the other hand, might still be caused by, e.g., galaxy harassment, with these more luminous AGN being relatively recent additions to clusters, and thus situated either at the periphery or in the process of falling into dense regions. A clumpy small-scale spatial distribution would then be a natural consequence of such environments. Such migrants are also more likely to have large gas reservoirs and only slightly disturbed morphologies. We have shown that Seyferts are distinct from other emission-line systems in their high electron densities. So far, morphological studies of Seyfert hosts reach no clear, statistically significant conclusion on the degree of harassment in comparison with those of the normal galaxies: Seyferts’ hosts exhibit similar morphologies with those of field galaxies (de Robertis et al., 1998a, b), do not particularly show evidence for bars (e.g., Regan & Mulcheay, 1999; Laine et al, 2002) or for galaxy-galaxy interactions (e.g., Malkan et al., 1998), while results of pair counting in both optical and IR, remain inconclusive, some studies finding possible excess of companions (Dahari, 1984; Rafanelli et al., 1995), while others not (Fuentes-Williams & Stocke, 1988; Laurikainen & Salo, 1995; Schmitt, 2001). Minor mergers that leave no or very little optical trace (e.g., Corbin, 2000) might however explain fueling that would originate from a canibalized secondary, less massive galaxy that thus causes only minor perturbations to the primary galaxy. Such events might as well happen at the galaxy clusters’ peripheries.
5. Summary & Conclusions
We investigate the spatial clustering of low-luminosity AGN in the nearby universe, using spectroscopic classification and measurement of related physical parameters to examine this clustering as a function of their nuclear emission properties. We estimate and compare the CFs for sub-samples selected on these various properties, and analyze these results in light of the well-known dependence of clustering on halo mass, as well as the empirical relation between black hole mass and galaxy mass. This study reveals a strong connection between the galaxy clustering amplitudes, hence the properties of their dark matter halos, and the intrinsic physical properties of these objects’ line-emitting regions. A brief overview of our main results is given in Table 6, and we list our conclusions as follows.
(i) The amplitude of the two-point correlation function is strongly dependent on galactic nuclear emission properties. By employing detailed spectroscopic classification schemes we find that, contrary to previous claims, bona fide low luminosity AGN, spectroscopically classified as Seyfert galaxies, are clearly less clustered than the average galaxies, and therefore do not tracing the same underlying structures. LINERs, on the other hand, exhibit a clustering amplitude higher than that of Seyferts, and consistent with that of the whole galaxy sample.
(ii) AGN defined using only the [N II]/H vs. [O III]/H diagnostic diagram are dominated by the LINER-like objects, and include a significant fraction of objects with conspicuously strong nuclear star-formation activity. Two, or better, three-dimensional diagnostic diagrams that employ forbidden lines whose emissivity is less sensitive to abundance effects, like [S II] and/or [O I], are necessary to accurately separate sources powered by accretion from those in which star-forming activity is dominant.
It is, therefore, important to emphasize that more lenient AGN definitions are strongly biased toward LINER-like behavior, and consequently, do not represent the traditional AGN activity and physical characteristics. LINERs differ from Seyferts in many of their intrinsic characteristics. In LINERs, the emitting gas density is lower than in Seyferts, and the obscuration is generally at very low levels. As suggested by the large differences we observe in the [O I] and [O III] line luminosities, the accretion activity is significantly reduced in LINERs while in Seyferts is generally high.
(iii) Emission parameters such as and, in particular, , which are sensitive to the level of nuclear accretion activity, play an important role in differentiating systems of different clustering properties. Highly luminous and, therefore, more active objects are significantly less clustered than faint, less active ones; the latter types are strongly represented by LINERs.
(iv) The amount and nature of the fuel available for nuclear activity, whether accretion or star-formation, is also connected to the spatial clustering characteristics. The less obscured systems and the galaxies with moderately high emitting gas densities are more clustered. Such sources are highly represented by LINERs.
(v) Host galaxy properties and, consequently, the morphology-density relation, do not strongly influence the difference in the spatial clustering found between Seyferts and LINERs, and play only a secondary role in the large differences between the clustering amplitudes of the low and high and/or subsets.
(vi) Based on the strong relationship between host halo mass, as given by the clustering amplitude, and the spectral properties of the line-emitting galaxies, we speculate that: 1) Seyfert activity arises from active accretion onto small BHs that is abundantly fueled, while 2) LINERs’ emission-line properties originate from ionization by slowly accreting massive BHs whose circumnuclear material supply is generally low. In this scenario, H ii systems may be interpreted as harboring relatively small, weakly accreting BHs whose activity remains enshrouded within the surrounding star-forming activity. The similarity of the Milky Way nuclear system to that of a typical H ii galaxy in this picture provides a means of integrating the Galactic Center into the larger context of galaxy nuclei.
References
- DR2; Abazajian et al. (2004) Abazajian, K., et al., 2004, AJ, 128, 502
- Baes et al. (2003) Baes, M., Buyle, P., Hau, G. K. T., & Dejonghe, H., 2003, MNRAS, 341, 44
- Baganoff et al. (2003) Baganoff, F.K., et al., 2003, ApJ, 591, 891
- e.g., Baldwin, Phillips, & Terlevich (1981) Baldwin, J. A. Phillips, M. M, & Terlevich, R., 1981, PASP, 93, 5
- Balick & Brown (1974) Balick, B., & Brown, R.L., 1974, ApJ, 194, 265
- e.g., Barnes & Hernquist (1992) Barnes, J. E., & Hernquist, L., 1992, Nature, 360, 715
- Blanton et al. (2003a) Blanton, M.R., et al., 2003, AJ, 592, 819
- Blanton et al. (2003b) Blanton, M.R., et al., 2003, AJ, 594, 186
- Blanton et al. (2004) Blanton, M.R., et al., 2004, AJ, 129, 2562
- Blanton et al. (2005) Blanton, M.R., et al., AJ, 129, 2562
- Brinchmann et al. (2004) Brinchmann, J., Charlot, S., Heckman, T. M., Kauffmann, G., Tremonti, C., & White, S.D.M., 2004, astro-ph/0406220
- Budavari et al. (2003) Budavari, T., et al., 2003, ApJ, 595, 59
- Charlot & Fall (2000) Charlot, S., & Fall, S.M., 2000, ApJ,539, 718
- Constantin et al. (2006) Constantin, A., et al., 2006, ApJ, submitted.
- e.g., Corbin (2000) Corbin, M. R., 2000, ApJ, 119, 1062
- Dahari (1984) Dahari, O., 1984, AJ, 89, 966
- de Robertis et al. (1998a) de Robertis, M. M., Hayhoe, K., & Yee, H. K. C., 1998, ApJS, 115, 163
- de Robertis et al. (1998b) de Robertis, M. M., Yee, H. K. C., & Hayhoe, K., 1998, ApJ, 496, 93
- Di Matteo et al. (2003) Di Matteo, T., Croft, R. A. C., Springel, V., & Hernquist, L., 2003, ApJ, 593, 56
- Di Matteo, Springel & Hernquist (2005) Di Matteo, T., Springel, V., & Hernquist, L, 2005, Nature, 433, 604
- Ferrarese & Merritt (2000) Ferrarese, L., & Merrit, D., 2000, ApJ, 539L, 9
- Ferrarese et al. (2001) Ferrarese, L., Pogge, R., W., Peterson, B. M., Merritt, D., Wandel, A., & Joseph, C. L. 2001, ApJ, 555, 79
- Ferrarese (2002) Ferrarese, L., 2002, ApJ, 578, 90
- Filho et al. (2004) Filho, M., Fraternali, F., Markoff, S., Nagar, N. M., Barthel, P. D., Ho, L. C., & Yuan, F., 2004, A&A, 418, 429
- Fuentes-Williams & Stocke (1988) Fuentes-Williams, T., & Stocke, J. T., 1988, AJ, 96, 1235
- Gebhardt et al. (2000a) Gebhardt, K., et al., 2000a, ApJ, 539, 13
- Gebhardt et al. (2000b) Gebhardt, K., et al., 2000b, ApJ, 543, 5
- Ghez (2004) Ghez, A.M., 2004, in Carnegie Observatories Astrophysics Series, Vol. 1: Coevolution of Black Holes and Galaxies, ed. L.C. Ho, (Cambridge: Cambridge University Press), 53
- Graham et al. (2001) Graham, A. W., Erwin, P., Caon, N., & Trujillo, I., 2001, ApJ, 563, 11
- Grazian et al. (2004) Grazian, A., Negrello, M., Moscardini, L., Cristiani, S., Haehnelt, M. G., Matarrese, S., Omizzolo, A., & Vanzella, E., 2004, AJ, 127, 592
- Greene & Ho (2005) Greene, J.E., & Ho, L.C., 2005, ApJ, in press, astro-ph/0512461
- Grogin et al. (2003) Grogin, N. A. et al. 2003, ApJ, 595, 685
- Haiman & Hui (2001) Haiman Z., & Hui, L., 2001, ApJ, 547, 27
- Hao et al. (2005) Hao, L., et al. 2005, AJ, 129, 1783
- Ho (1999) Ho, L. C. 1999, Adv. Space Res., 23, 813
- Ho, Filippenko & Sargent (1997a) Ho, L. C., Filippenko, A. V., & Sargent, W. L. W., 1997, ApJS, 112, 315
- e.g., Ho, Filippenko & Sargent (1997b) Ho, L. C., Filippenko, A. V., & Sargent, W. L. W., 1997, ApJ, 487, 568
- Ho, Filippenko & Sargent (2003) Ho, L. C., Filippenko, A. V., & Sargent, W. L. W., 2003, ApJS, 583, 159
- e.g., Kaiser (1984) Kaiser, N., 1984, ApJ, 284, 9
- Kauffmann & Haehnelt (2000) Kauffmann, G., & Haehnelt, M., 2000, MNRAS, 311, 576
- Kauffmann et al. (2003) Kauffmann, G., et al., 2003, MNRAS, 346, 1055
- Kauffmann et al. (2004) Kauffmann, G., et al., 2004, MNRAS, 353, 713
- Kelm et al. (1998) Kelm, B., Focardi, P., & Palumbo, G. G. C., 1998, A&A, 335, 912
- Kelm et al. (2004) Kelm, B., Focardi, P., & Zitelli, V., 2004, A&A, 418, 25
- Kewley et al. (2001) Kewley, L., Dopita, M. A., Sutherland, R. S., Heisler, C. A., & Trevena, J., 2001, ApJ, 556, 121
- Laine et al (2002) Laine, S., Shlosman, I., Knapen, J. H., Peletier, R. F., 2002, ApJ, 567, 97
- Landy & Szalay (1993) Landy, S.D., & Szalay, A.S., 1993, ApJ, 412, 64
- Laurikainen & Salo (1995) Laurikainen, E., & Salo, H., 1995, A&A, 293, 683
- Lake, Katz & Moore (1998) Lake, G., Katz, N., & Moore, B., 1998, ApJ, 495, 152
- e.g., Lupton (1993) Lupton, R.H., 1993, Statistics in Theory and Practice, Princeton: Princeton University Press
- Madgwick et al. (2003) Madgwick, D. S., et al., 2003, MNRAS, 344, 847
- Magliocchetti et al. (2004) Magliocchetti, M., et al., 2004, MNRAS, 350, 1485
- e.g., Magorrian et al. (1998) Magorrian, J. et al., 1998, AJ, 115, 2285
- e.g., Malkan et al. (1998) Malkan, M. A., Gorjian, V., & Tam, R., 1998, ApJS, 117, 25
- Maoz et al. (2005) Maoz, D., Nagar, N. M., Falcke, H., & Wilson, A. S., 2005, ApJ, 625,699
- Martini & Weinberg (2001) Martini, P., & Weinberg, D.H., 2001, ApJ, 547, 12
- Miller et al. (2003) Miller, C. J., Nichol, R. C., Gómez, P. L., Hopkins, A. M., & Bernardi, M., 2003, ApJ, 597, 142
- Moore et al. (2000) Moore et al. 2000, Mining the Sky, astro-ph/0012333
- Nelson et al. (2004) Nelson, C. H., Green, R. F., Bower, G., Gebhardt, K., & Weistrop, D., 2004, ApJ, 615, 652
- Norberg et al. (2001) Norberg, P., et al., 2001, MNRAS, 328, 64
- Norberg et al. (2002) Norberg, P., et al., 2002, MNRAS, 332, 827
- Onken et al. (2004) Onken, C. A., Ferrarese, L., Merritt, D., Peterson, B. M., Pogge, R. W., Vestergaard, M., & Wandel, A., 2004, ApJ, 615, 645
- e.g., Osterbrock (1989) Osterbrock, D. E., 1989, Astrophysics of Gaseous Nebulae and Active Galactic Nuclei, University Science Books
- Park et al. (2005) Park, C., et al., 2005, ApJ, 633, 11
- Park & Choi (2005) Park, C., & Choi, Y., 2005, ApJ, 635, 29
- Press et al. (1992) Press, W.H., Teukolsky, S.A., Vetterling, W.T., & Flannery, B.P., 1992, Numerical Recipes in C (Second ed.; Cambridge: Cambridge Univ. Press)
- Rafanelli et al. (1995) Rafanelli, P., Violato, M., & Baruffolo, A., 1995, AJ, 109, 1546
- e.g., Regan & Mulcheay (1999) Regan, Michael W., & Mulchaey, John S., 1999, AJ, 117, 2676
- Richards et al. (2002) Richards, G.T., et al., 2002, AJ, 123, 2945
- Rieke, Rieke & Paul (1989) Rieke, G.H., Rieke M.J., & Paul, A.E., 1989, ApJ, 336, 752
- e.g., Sch del et al. (2003) Sch del, R., Ott, T., Genzel, R., Eckart, A., Mouawad, N., & Alexander, T., 2003, ApJ, 596, 1015
- Schlegel, Finkbeiner & Davis (1998) Schlegel, D. J., Finkbeiner, D. P., & Davis, M., 1998, ApJ, 500, 525
- Schneider et al. (2002) Schneider, D.P., et al., 2002, AJ, 123, 567
- Schmitt (2001) Schmitt, H. R., 2001, AJ, 122, 2243
- Schneider et al. (2003) Schneider, D.P., et al., 2003, AJ, 126, 2579
- Shields et al. (2005) Shields, J.C., et al., 2005, ApJ, submitted.
- Storchi-Bergmann & Pastoriza (1989) Storchi-Bergmann, T., & Pastoriza, M.G., 1989, ApJ, 347, 195
- Storchi-Bergmann & Pastoriza (1990) Storchi-Bergmann, T., & Pastoriza, M.G., 1990, PASP, 102, 1359
- Strateva et al. (2001) Strateva, I., et al., 2001, AJ, 122, 1861
- Strauss et al. (2002) Strauss, M., et al., 2002, AJ, 124, 1810
- Tegmark et al. (2004) Tegmark, M., et al., 2004, ApJ, 606, 702
- Thomas & Maraston (2003) Thomas, D., & Maraston, C., 2003, A&A, 401, 429
- Tremonti et al. (2004) Tremonti, C.A., et al., 2004, ApJ, 613, 898
- Veilleux & Osterbrock (1987) Veilleux, S., & Osterbrock, D. E., 1987, ApJS, 63, 295
- Wake et al. (2004) Wake, D., et al., 2004, ApJ, 610, 85
- Waskett et al. (2005) Waskett, T. J., Eales, S. A., Gear, W. K., McCracken, H. J., Lilly, S., & Brodwin, M., 2005, MNRAS, 363, 801
- Zehavi et al. (2002) Zehavi, I., et al., 2002, ApJ, 571, 172
- Zehavi et al. (2005) Zehavi, I., et al., 2005, ApJ, 630, 1
- York et al. (2000) York, D. G., et al., 2000, AJ, 120,1579
| Sample | [O III]/H | [N II]/H | [S II]/H | [O I]/H | |
|---|---|---|---|---|---|
| (1) | (2) | (3) | (4) | (5) | (6) |
| Emission-line | 54,410 | ||||
| Seyferts | 2,392 | ||||
| LINERs | 7,468 | ||||
| …pure liners | 5,313 | ||||
| …transition | 2,155 | , | |||
| H II’s | 34,781 |
Note. — Columns (3) to (6) indicate the range of values in the line flux ratios.
| Sample | ||||
|---|---|---|---|---|
| all galaxies | 45,303 | 7.800.49 | 1.170.05 | –0.82 |
| passive | 6,383 | 11.421.17 | 1.280.07 | –0.82 |
| Emission-lineaadefinition criteria include [O I], [O I]/H | 12,676 | 6.330.94 | 1.300.16 | –0.15 |
| Seyfertsaadefinition criteria include [O I], [O I]/H | 829 | 5.670.62 | 1.560.17 | –0.58 |
| LINERsaadefinition criteria include [O I], [O I]/H | 3,263 | 7.820.64 | 1.390.09 | –0.53 |
| …pure LINERs | 2,424 | 7.390.67 | 1.330.11 | –0.46 |
| …transition | 839 | 5.380.71 | 1.350.23 | –0.18 |
| H II’saadefinition criteria include [O I], [O I]/H | 6,622 | 5.810.53 | 1.280.11 | 0.08 |
| Emission-linebbdefinition criteria exclude [O I], [O I]/H | 21,497 | 6.450.24 | 1.240.04 | –0.67 |
| Seyfertsbbdefinition criteria exclude [O I], [O I]/H | 1,018 | 6.000.64 | 1.410.15 | –0.48 |
| LINERsbbdefinition criteria exclude [O I], [O I]/H | 5,326 | 7.260.61 | 1.290.08 | –0.73 |
| H II’sbbdefinition criteria exclude [O I], [O I]/H | 12,649 | 5.730.24 | 1.220.06 | –0.46 |
| AGN (Kauffmann et al.) | 14,421 | 7.440.37 | 1.250.07 | –0.44 |
| non-AGN (Kauffmann et al.) | 13,630 | 6.260.69 | 1.240.11 | –0.52 |
| AGN (Miller et al.) | 9,846 | 7.010.43 | 1.270.06 | –0.63 |
| non-AGN (Miller et al.) | 15,178 | 5.620.59 | 1.240.12 | 0.03 |
| log ccthe line luminosities are in units of erg s-1 40 | 2,041 | 6.220.57 | 1.410.11 | –0.24 |
| 38 log ccthe line luminosities are in units of erg s-1 39 | 10,464 | 7.170.44 | 1.210.05 | –0.63 |
| log ccthe line luminosities are in units of erg s-1 37 | 1,580 | 8.790.75 | 1.310.10 | –0.54 |
| log ccthe line luminosities are in units of erg s-1 39 | 4,561 | 6.110.27 | 1.340.07 | –0.36 |
| log ccthe line luminosities are in units of erg s-1 38 | 2,153 | 13.151.09 | 1.330.07 | –0.77 |
| high | 2,575 | 6.910.57 | 1.250.09 | –0.19 |
| low | 2,921 | 7.380.51 | 1.350.07 | –0.68 |
| high | 788 | 7.500.98 | 1.150.13 | –0.98 |
| low | 3,435 | 5.510.45 | 1.430.11 | –0.11 |
Note. — All samples use , , and . is in units of Mpc. is the normalized correlation coefficient between and .
| Sample | [S II]6731 | (cm-3) | |
|---|---|---|---|
| high | 5,922 | ||
| low | 27,116 |
| Sample | |||
|---|---|---|---|
| low | 19,343 | cm-2 | |
| high | 8,573 | cm-2 |
| Sample | log | log | |||||
|---|---|---|---|---|---|---|---|
| (1) | (2) | (3) | (4) | (5) | (6) | (7) | (8) |
| emission-line | 12,676 | 2.61 | 2.31 | 38.80 | 39.26 | 13.44 | 1.7 |
| seyferts | 829 | 2.82 | 2.63 | 38.93 | 39.81 | 11.65 | 1.9 |
| liners | 3,263 | 2.93 | 2.73 | 38.34 | 38.65 | 9.64 | 1.2 |
| …pure LINERs | 2,424 | 2.99 | 2.79 | 38.22 | 38.48 | 8.19 | 1.2 |
| …transition | 839 | 2.73 | 2.53 | 38.70 | 39.15 | 12.81 | 1.0 |
| H II’s | 6,622 | 2.38 | 2.01 | 38.90 | 39.37 | 15.92 | 1.6 |
Note. — Col. (2): number of objects in the samples; Col. (3): concentration index; Col. (4): color for the host galaxies; Cols. (5) and (6): logarithmic values of [O I] and [O III] luminosities in erg s-1; Col. (7): neutral hydrogen column density in units of cm-2; Col. (8): electron density in cm-3
| H ii | Transition | Seyferts | Pure LINERs | |
|---|---|---|---|---|
| clustering | weak | weak | weak | strong |
| () | -like galaxies | |||
| fuelling rate | average | moderately low | relatively high | (very) low |
| (, ) | (not low!) | efficient? | inefficient? | |
| fuel available | low | low | high | moderately high |
| () | (wide range) | |||
| obscuration | high | low | wide range | low |
| host- | blue-ish | red-ish | red-ish | red-ish |
| -morphology | late type | earlier type | earlier type | earlier type |
| -like Seyferts | -like Seyferts | |||
| small | small | small | large | |
| life-time | ? | ? | short | long |