11email: jmarti@ujaen.es, dperez@ujaen.es, jlg@ujaen.es 22institutetext: Dpto. de Ing. Mecánica y Minera, EPS, Universidad de Jaén, Campus Las Lagunillas s/n, Edif. A3, 23071 Jaén, Spain
22email: peter@ujaen.es 33institutetext: Departament d’Astronomia i Meteorologia, Universitat de Barcelona, Av. Diagonal 647, 08028 Barcelona, Spain
33email: jmparedes@ub.edu 44institutetext: Grupo de Investigación FQM-322, Universidad de Jaén, Campus Las Lagunillas s/n, Edif. A3, 23071 Jaén, Spain
A radio and infrared exploration of the Cygnus X-3 environments
Abstract
Aims. To confirm, or rule out, the possible hot spot nature of two previously detected radio sources in the vicinity of the Cygnus X-3 microquasar.
Methods. We present the results of a radio and near infrared exploration of the several arc-minute field around the well known galactic relativistic jet source Cygnus X-3 using the Very Large Array and the Calar Alto 3.5 m telescope.
Results. The data this paper is based on do not presently support the hot spot hypothesis. Instead, our new observations suggest that these sources are most likely background or foreground objects. Actually, none of them appears to be even barely extended as would be expected if they were part of a bow shock structure. Our near infrared observations also include a search for extended emission in the Bracket (2.166 m) and (2.122 m) lines as possible tracers of shocked gas in the Cygnus X-3 surroundings. The results were similarly negative and the corresponding upper limits are reported.
Key Words.:
stars: individual: Cygnus X-3 – radio continuum: stars – X-rays: binaries1 Introduction
Cygnus X-3 is among the most intensively studied microquasars in the Galaxy. The system is a high-mass X-ray binary with a WN Wolf-Rayet companion star (see e.g. Fender et al. (1999) and references therein) seen through a high interstellar absorption (10 mag) that renders the optical counterpart undetectable in the visual domain. Cygnus X-3 has been observed to undergo strong radio flares with flux density increments by almost three orders or magnitude above the normal quiescent level of Jy at cm wavelengths. The first of them was the historic flare extensively described by Gregory et al. (1972) and subsequent papers. Relativistic jets from this microquasar have been reported soon after some of these events outflowing collimately in the North-South direction (see e.g. Martí et al. (2001), Miller-Jones et al. (2004)). The reader is referred to these papers for a more detailed account on the flaring and sub-arcsecond properties of the source.
In recent times, concerns have arised about the possible effects of continuate energy and momentum injection into the interstellar medium (ISM) during the flaring lifetime of microquasar systems. These effects appear to be far more important than previously thought. The recent report of a ‘dark jet’ in Cygnus X-1 by Gallo et al. (2005) illustrates a likely case of a black hole microquasar silently evacuating a significant fraction of its accretion power into its surroundings and affecting them on a several pc scale.
In a previous paper, Martí et al. (2005) have reported the existence of two possible hot spot candidates (HSCs) associated with Cygnus X-3, thus suggesting an analogy with Fanaroff-Riley type II radio galaxies. Hereafter and following their original designation, we will refer here to these objects as the hot spot candidate North and South (HSCN and HSCS), respectively. They appeared as faint radio sources with non-thermal spectrum at angular distances of 707 and 436 from Cygnus X-3. Moreover, the line joining them was within one degre of the almost North-South position angle of the inner arc-second radio jets as measured by Martí et al. (2001).
The Martí et al. (2005) results, however, were hampered by the fact that the HSCs were far from the phase centre of the interferometric array and consequently suffered from significant bandwidth smearing. Searches for near infrared counterparts provided also negative results within the sensitivity of Two Micron All Sky Survey (2MASS).
In this paper, we report new radio and near infrared observations of both the HSCs and the Cygnus X-3 nearby environments. The improved observational data do not confirm the proposed hot spot nature and indicate that they are most likely background or foreground objects. This fact leaves open again for Cygnus X-3 the issue of searching for signatures of energy deposition from its relativistic jets into the ISM. In the following sections we describe and discuss our recent observational work that finally leads us to such different conclusion.
2 Very Large Array radio observations
Very Large Array (VLA) observations were carried out with the antennae in B configuration on 2005 April 16 under clear sky conditions. The pointings were centered at the position of the northern and southern HSCs as reported in Martí et al. (2005). The targets were observed at both the 6 cm and 3.5 cm wavelengths, equivalent to frequencies of 4.8 and 8.4 GHz. The instrumental setup included two intermediate frequency (IF) pairs with 50 MHz bandwidth each. The amplitude calibrator used was 1331+305 (3C286) which is one of the two VLA primary calibrators. The strong compact source 2007+404, within a few degrees of Cygnus X-3, was observed as phase calibrator before and after each science pointing and always for a couple of minutes at both wavelengths. Its corresponding bootstrapped flux density of 2007+404 was found to be Jy and Jy at 6 and 3.5 cm, respectively. The data were edited processed using the AIPS software package of NRAO following the standard procedures for continuum calibration of interferometer data. The final maps were computed using the IMAGR task of AIPS based on the CLEAN deconvolution algorithm.
| HSC | , | Flux density |
|---|---|---|
| (mJy) | ||
| North | 268740001 | |
| 3302001 | ||
| South∗ | 2497002 | |
| 05902 |
∗ Position taken from Martí et al. (2005).
∗∗ Upper limits are given as from VLA data of this paper.

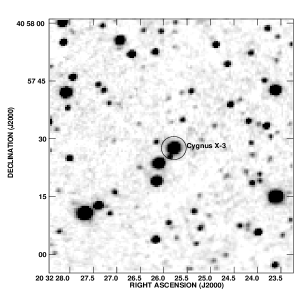
All radio information available is summarized in Table 1. Here we can see how the HSCN was very well detected at both wavelengths. A contour map of our source is shown in Fig. 1 at the 6 cm wavelength. Based on the measured flux densities, the corresponding spectral index is clearly non-thermal and can be estimated as . In contrast, only flux density upper limits were obtained at the position of the HSCS.
3 CAHA near infrared observations
The positions of the HSCs were observed with the 3.5 m telescope at the Centro Astronómico Hispano Alemán (CAHA) in Almería (Spain) on 2005 April 29th. The OMEGA2000 camera was used and the images were taken through the , , , Br and H2 filters. This instrument consists of a Rockwell HAWAII2 HgCdTe detector with pixels sensitive within the wavelength range from 0.8 to 2.5 m.
Data reduction was carried out using the IRAF package. Firstly, the sky was determined from the science frames themselves by median-combining all of them for each band in order to obtained a single image that was used for the sky background subtraction. Secondly, dome flats were obtained for each band in series of frames taken in pairs with lamps on and lamps off for eliminating the thermal emission of the screen and dome surroundings. The actual flatfield is then the difference image (lamp on - lamp off), thus allowing to remove at the same time any dark count signal from the detector. A flat field image for each band was then normalized and used for correcting the rest of frames for each specific wave band.
After background subtraction and flatfielding, the data was median-combined resulting in a deep image for each wave band. Astrometry on the final frames was determined by identifying about twenty stars in the field for which positions were retrieved using the 2MASS catalog. The plate solutions were established by means of the AIPS task XTRAN with a third order polinomial fit. The residuals were typically of 01 or less.
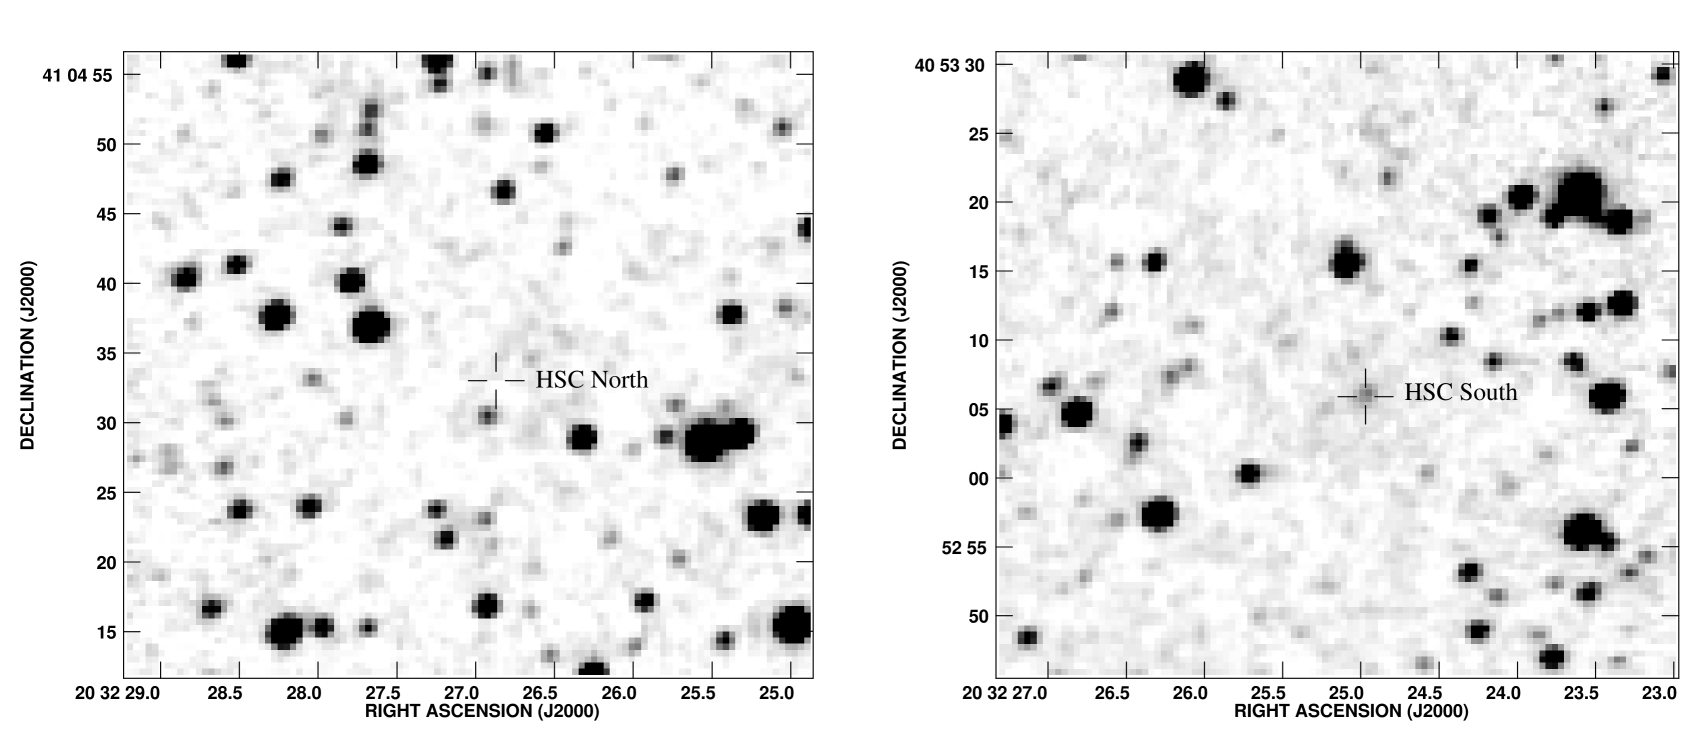
The resulting images are shown in Figs. 2 and 3 for both the HSCs and Cygnus X-3 itself in the band. They are significantly deeper than their 2MASS equivalents in Martí et al. (2005). The corresponding limiting magnitude is 18.7 mag, while for and -band images (not shown here) it is about 19.0 and 17.9, respectively.
Finally, we also produced narrow band images, namely in the Bracket (2.166 m) and (2.122 m) filters as possible tracers of extended emission. Their continuum was subtracted using the same -band image appropriately scaled following the Böker et al. (1999) procedure. Nothing was detected at the HSC positions and upper limits for any extended emission are given in the Discussion.
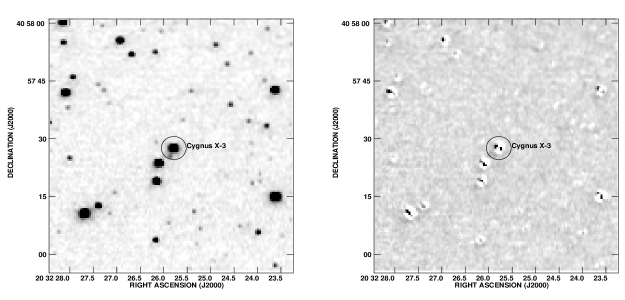
A representative sample of our line narrow band images in the close vicinity of Cygnus X-3 are presented in Fig. 4 for illustration purposes, corresponding to the H2 filter.
4 Discussion
4.1 The possible hot spots in Cygnus X-3 revisited
The observations presented in this paper were specially designed to test the possible hot spot nature of the two radio sources reported in Martí et al. (2005). They were observed exactly at the phase center of the VLA in order to avoid the smearing problems which affected the data in this previous work. Nevertheless, the integration time devoted now to the targets was half than in the former data.
As seen in Fig. 1, the HSCN appears perfectly unresolved at radio wavelengths with no trace of extended emission above a upper limit of 0.14 mJy beam-1. Observing at 6 cm with the VLA in B configuration would have allowed us to image radio features with angular scales as large as . The fact that no extended radio emission in the several arc-second range is detected above our sensitivity limit suggests, although does not strictly rule out, that HSCN is likely not a hot spot.
In the HSCS case, we did not detect this source possibly because of unsufficient integration time. The upper limit in Table 1 is roughly consistent with the flux density reported in the much more sensitive but smearing-affected observations of Martí et al. (2005). Therefore, we cannot make any statement based on its apparent angular size.
Our search for infrared counterparts with the 3.5 m CAHA telescope is deeper than the 2MASS images in Martí et al. (2005) by more than four magnitudes. The panels in Fig. 2 clearly show that the HSCN does not have an infrared counterpart within our improved sensitivity limits in any of the filters. In contrast, the HSCS does exhibit a faint infrared counterpart in almost perfect coincidence with the VLA radio position originally reported in Martí et al. (2005). This object is detected only in the band. The offset between the VLA and CAHA positions is 01 which is well within the residual errors of the astrometric solution for the OMEGA2000 frame based on 20 reference stars from the 2MASS survey.
The infrared counterpart of HSCS is clearly of stellar appearance and it is most likely a galactic star or an extragalactic background object. In any case, the fact of HSCS being a point-like source inmediately argues against its originally proposed hot spot nature.
4.2 The Cygnus X-3 environments in Br and H2 lines
In our attempts to search for a signature of interaction between the Cygnus X-3 relativistic outflows and the interstellar medium, we also imaged the field in line narrow bands. Using the traditional tools of star formation studies, the Br and H2 filters were chosen as likely tracers of shocked gas. The resulting images (see Fig. 4) do not display evidence of extended emission neither at the HSC positions nor in the vicinity of Cygnus X-3 itself. The corresponding upper limit corresponds to about 17.6 mag arcsec-2 in both filters.
These results stress again the dichotomy between collimated outflows from young stellar objects (YSOs) and microquasars concerning the difficulty in detecting signatures of jet-environment interaction. YSOs being born in dense molecular clouds comparatively exhibit more often evidences of jet shocked gas around them (Heinz (2002)).
4.3 The arc-second close vicinity of Cygnus X-3
We also devoted our attention to the very close surroundings of Cygnus X-3 in our deep CAHA infrared observations. In particular, we tried to look for indications of any elongation of Cygnus X-3 with respect to the stellar profiles of the nearby stars. It has been reported by Ogley et al. (1997) that Cyg X-3 could be represented by two stellar-type profiles 056 apart in -band, which may be interpreted as an extended emission feature. In order to characterize the tridimensional profiles of Cyg X-3 and neighbour stars in the field, we have obtained four bidimensional profiles in the main directions for each of the sources by using the SLICE task in AIPS. These profiles exhibits always a typical Gaussian behaviour and no evidence of extended infrared emission have been found for Cyg X-3. Given that the seeing in our images is estimated as 107, we should be able to separate only arc-second extended components if present at the time of our observations and this was actually not the case. Nevertheless, this result does not exclude that a faint elongation due to an infrared jet could be detected soon after a strong outburst in analogy with the case of GRS1915+105 as observed by Sams et al. (1996).
5 Conclusions
After conducting intensive radio and near infrared observations of Cygnus X-3 and its surroundings, our conclusions can be summarized as follows:
-
1.
The previously proposed hot spot nature of two nearby radio sources in almost perfect alignment with the relativistic jets of this microquasar has not been possible to be confirmed. The absence of clear indications for these objects being hot spots, such as extended emission and no stellar-like counterpart for both of them, leads us to be very cautious about our former hypothesis.
-
2.
We have also presented deep line narrow band images of the Cygnus X-3 field and provided strong upper limits for the brightness of extended emission due to possible shocked gas.
-
3.
The observational data collected and reported in the present paper clearly show that searching for signatures of jet-ISM interaction is a very difficult task which would require a more sensitive sampling on a wide range of angular scales.
-
4.
Finally, a comparison of the Cygnus X-3 stellar profile to that of other stars in the field does not indicate evidences of additional components within 1′′ at near infrared wavelegths.
Acknowledgements.
The authors acknowledge support by DGI of the Ministerio de Educación y Ciencia (Spain) under grants AYA2004-07171-C02-02 and AYA2004-07171-C02-01, FEDER funds and Plan Andaluz de Investigación of Junta de Andalucía as research group FQM322. The National Radio Astronomy Observatory is a facility of the National Science Foundation operated under cooperative agreement by Associated Universities, Inc. in the USA. This paper is also based on observations collected at the Centro Astronómico Hispano Alemán (CAHA) at Calar Alto, operated jointly by the Max-Planck Institut für Astronomie and the Instituto de Astrofísica de Andalucía (CSIC). This research has made use of the SIMBAD database, operated at CDS, Strasbourg, France. This publication makes use of data products from the Two Micron All Sky Survey, which is a joint project of the University of Massachusetts and the Infrared Processing and Analysis Center/California Institute of Technology, funded by the National Aeronautics and Space Administration and the National Science Foundation in the USA. The research of DPR has been supported by the Education Council of Junta de Andalucía (Spain).References
- Bailer-Jones et al. (2000) Bailer-Jones C., Bizenberger, P. Storz, C. 2000, Proc. SPIE, 4008, 1305
- Böker et al. (1999) Böker, T., Calzetti, D., Sparks, W., et al. 1999, ApJS, 124, 95
- Fender et al. (1999) Fender, R. P., Hanson, M. M., Pooley, G. G., 1999, MNRAS, 308, 473
- Gallo et al. (2005) Gallo, E., Fender, R. P., Kaiser, Ch., et al., 2005, Nat, 436, 819
- Gregory et al. (1972) Gregory, P.C., Kronberg, P.P., Seaquist, E.R., et al., 1972, Nat Phys Sci, 239, 114
- Heinz (2002) Heinz, S., 2002, A&A, 388, L40
- Martí et al. (2001) Martí, J., Paredes, J. M., Peracaula, M., 2001, A&A, 375, 476
- Martí et al. (2005) Martí, J., Pérez-Ramírez, D., Garrido, J. L., Luque-Escamilla, P., Paredes, J. M., 2005, A&A, 439, 279
- Miller-Jones et al. (2004) Miller-Jones, J. C. A., Blundell, K. M., Rupen, M. P., et al., 2004, ApJ, 600, 368
- Ogley et al. (1997) Ogley, R. N., Bell Burnell, S. J., Fender, R. P., 1997, Vistas in Astronomy, 41, 65
- Sams et al. (1996) Sams, B. J., Eckart, A., Sunyaev, R., 1996, Nat, 382, 47