XMM-Newton observations of the brightest Ultraluminous X-ray sources
Abstract
We present an analysis of 13 of the best quality Ultraluminous X-ray source (ULX) datasets available from XMM-Newton European Photon Imaging Camera (EPIC) observations. We utilise the high signal-to-noise in these ULX spectra to investigate the best descriptions of their spectral shape in the 0.3–10 keV range. Simple models of an absorbed power-law or multicolour disc blackbody prove inadequate at describing the spectra. Better fits are found using a combination of these two components, with both variants of this model - a cool ( keV) disc blackbody plus hard power-law continuum, and a soft power-law continuum, dominant at low energies, plus a warm ( keV) disc blackbody - providing good fits to 8/13 ULX spectra. However, by examining the data above 2 keV, we find evidence for curvature in the majority of datasets (8/13 with at least marginal detections), inconsistent with the dominance of a power-law in this regime. In fact, the most successful empirical description of the spectra proved to be a combination of a cool ( keV) classic blackbody spectrum, plus a warm disc blackbody, that fits acceptably to 10/13 ULXs. The best overall fits are provided by a physically self-consistent accretion disc plus Comptonised corona model (diskpn + eqpair), which fits acceptably to 11/13 ULXs. This model provides a physical explanation for the spectral curvature, namely that it originates in an optically-thick corona, though the accretion disc photons seeding this corona still originate in an apparently cool disc. We note similarities between this fit and models of Galactic black hole binaries at high accretion rates, most notably the model of Done & Kubota (2005). In this scenario the inner-disc and corona become energetically-coupled at high accretion rates, resulting in a cooled accretion disc and optically-thick corona. We conclude that this analysis of the best spectral data for ULXs shows it to be plausible that the majority of the population are high accretion rate stellar-mass (perhaps up to 80-) black holes, though we cannot categorically rule out the presence of larger, - intermediate-mass black holes (IMBHs) in individual sources with the current X-ray data.
keywords:
accretion, accretion discs – black hole physics – X-rays: binaries – X-rays: galaxies1 Introduction
Einstein X-ray observations were the first to reveal point-like, extranuclear sources in some nearby galaxies with luminosities in excess of (Fabbiano, 1989). Subsequently, many of these so-called Ultraluminous X-ray sources (ULXs) have displayed short and long term variability, which suggests they are predominantly accreting objects (see Miller & Colbert 2004 and references therein). However, the observed luminosities of most ULXs exceed the Eddington limit for spherical accretion onto a stellar-mass (10-) black hole (BH). In fact, their luminosites are intermediate between those of normal stellar mass BH X-ray Binaries (BHBs) and Active Galactic Nuclei (AGN). Therefore, the accretion of matter onto intermediate-mass black holes (IMBHs, of – ) provide an attractive explanation for ULXs, and could represent the long sought-after ‘missing link’ between stellar mass BHs and the supermassive BHs in the nuclei of galaxies. However, the large populations of ULXs associated with sites of active star formation (e.g., in the Cartwheel galaxy, Gao et al. 2003) demand rather too high formation rates of IMBHs if they are to explain the ULX class as a whole (King, 2004). An alternative to accreting IMBHs is that ULXs may be a type of stellar-mass BHB with geometrically (King et al., 2001) or relativistically (Körding, Falcke, & Markoff, 2002) beamed emission, such that their intrinsic X-ray luminosity does not exceed the Eddington limit. Another possibility is that they are stellar-mass BHBs that can achieve truly super Eddington luminosities via slim (Ebisawa et al., 2003) or radiation pressure dominated (Begelman, 2002) accretion discs.
As ULXs are probably the brightest class of X-ray binary fueled by the accretion of matter onto a BH111Although the most likely reservoir of fuel for an ULX is a companion star, others have been suggested, for example the direct accretion of matter from molecular clouds (Krolik, 2004)., a knowledge of the properties of Galactic BHBs could be vital in interpreting their characteristics. Traditionally the X-ray spectra of BHBs have been fitted empirically with two components, namely a power-law continuum and a multicolour disc blackbody (MCD) component (Mitsuda et al. 1984; Makishima et al. 1986). In the standard picture, the power-law component is thought to represent inverse-Compton scattering of thermal photons from the accretion disc by hot electrons in a surrounding corona. As such, the power-law represents the hard tail of the X-ray emission while the MCD component models the soft X-ray emission from the accretion disc. The MCD model itself has been formulated based on the best known model for accretion onto BHs (i.e., the thin accretion disc model, Shakura & Sunyaev 1973).
It has long been recognised that Galactic BHBs demonstrate various X-ray spectral states which are defined by the balance of these two components (i.e., power-law and MCD) at any one time. The three most familiar X-ray bright states are the low/hard (LH), high/soft (HS, also described as ‘thermal dominated’) and the very high (VH, or ‘steep power-law’) states (see McClintock & Remillard 2003 for further details). At lower mass accretion rates, a BHB usually enters the LH state where their X-ray emission is dominated by a hard power-law component (1.7), thought to arise from Comptonisation of soft photons by a hot optically thin corona222However this is still a topic of debate, with the main alternative for the X-ray power-law emission being synchrotron emission from the radio jet that is associated with this state (e.g., Falcke & Biermann 1995; Markoff, Falcke, & Fender 2001).. In this state, the disc is either undetected (e.g., Belloni et al. 1999) or appears truncated at a much larger inner radius and hence cooler than the parameters derived for the soft state (Wilms et al. 1999, McClintock et al. 2001). The soft X-ray state is generally seen at a higher luminosity (i.e., the HS state) and is best explained as 1 keV thermal emission from a multi-temperature accretion disc (i.e., modelled with a MCD component). In this state, the spectrum may also display a hard tail that contributes a small percentage of the total flux. The VH state is in many cases the most luminous state and is characterised by an unbroken power-law spectrum extending out to a few hundred keV or more. The photon index is typically steeper () than found in the LH state and generally coincides with the onset of strong X-ray quasi-periodic oscillations (QPOs). A MCD component may also be present in the VH state and the EXOSAT era demonstrated that some of the QPOs occur when both disc and power-law components contribute substantial luminosity (van der Klis, 1995).
The idea of ULXs as analogues to Galactic BHBs in the HS state was supported by ASCA observations, which revealed that their 0.5–10 keV spectra were successfully fitted with the MCD model with relatively high disc temperatures (1.0–1.8 keV, Makishima et al. 2000). As such, the ULXs were considered to be mass-accreting BHs with the X-ray emission originating in an optically-thick accretion disc. In fact, the use of the MCD model to describe these spectra permits one to obtain an ‘X-ray–estimated’ BH mass, , from the following equation (cf. Makishima et al. 2000 equations (5)–(8)).
| (1) |
Where is the distance to the X-ray source, which has an inclination , a full bolometric luminosity (from the MCD model) of and an observed maximum disc colour temperature . In addition is the Stefan-Boltzmann constant, is the ratio of the colour temperature to the effective temperature (‘spectral hardening factor’), and is a correction factor reflecting the fact that occurs at a radius somewhat larger than (here, we assume that is at the last stable Keplerian orbit). Makishima et al. (2000) use values of and , though other work has found different values for the spectral hardening factor (e.g. for GRO J1655-40, Schrader & Titarchuk 2003). Finally, is a positive parameter with corresponding to a Schwarzschild BH. However, the masses inferred from the ASCA data and Equation (1) are far too low to be compatible with the large BH masses suggested by their luminosities (assuming Eddington-limited accretion), for standard accretion discs around Schwarzchild BHs. Makishima et al. (2000) suggested that this incompatibility could be explained if the BHs were in the Kerr metric (i.e., rapidly rotating objects), allowing smaller inner disc radii and hence higher disc temperatures.
Chandra observations have provided some support for the Makishima et al. (2000) results, with some ULX spectra being consistent with the MCD model (e.g., Roberts et al. 2002). However, Chandra also revealed that some ULX spectra showed a preference for a power-law continuum rather than the MCD model (e.g., Strickland et al. 2001; Roberts et al. 2004; Terashima & Wilson 2004). It has been suggested that this preference for a power-law spectrum could be interpreted in terms of the LH state seen in Galactic BHB candidates, relativistically beamed jets or emission from a Comptonised accretion disc in the VH state. As well as these single component models, ASCA and Chandra spectroscopy have also suggested the presence of two component spectra for some ULXs, comprising a MCD with a power-law component. For example, previous ASCA analyses hinted at evidence for IMBHs, i.e., cool accretion disc components (see below), but these observations were not sensitive enough to statistically require two component modelling (e.g., Colbert & Mushotzky 1999). Similar results have been obtained by Chandra, e.g., ULXs in NGC 5408 (Kaaret et al., 2003) and NGC 6946 (Roberts & Colbert, 2003). Conversely, Chandra spectra of the Antennae ULXs (Zezas et al. 2002a; Zezas et al. 2002b) revealed an accretion disc (MCD) component consistent with the high temperature ASCA results (i.e., 1 keV), together with a hard power-law component (1.2).
It is only recently, using high quality XMM-Newton/EPIC spectroscopy of ULXs, that it has been demonstrated that the addition of a soft thermal disc component to a power-law continuum spectrum provides a strong statistical improvement to the best fitting models to ULX data (e.g., Miller et al. 2003; Miller, Fabian, & Miller 2004a). These particular observations have provided strong support for the IMBH hypothesis by revealing disc temperatures in these sources up to 10 times lower than commonly measured in stellar mass BHBs, consistent with the expectation for the accretion disc around a 1000- IMBH333It is common for the generic range of masses for IMBHs to be quoted as 20– . The lower limit comes from a consideration of the measured masses of BHs in our own Galaxy (McClintock & Remillard, 2003), and a theoretical limit for the mass of a BH formed from a single massive star (Fryer & Kalogera, 2001). However, more recent population synthesis analyses show that BHs of up to - may be formed in young stellar populations (Belczynski et al., 2004). Hence, when we refer to IMBHs in this paper we refer specifically to the larger 1000- IMBHs implied by the cool accretion disc measurements. (cf. Equation (1)). However, in a few cases, XMM-Newton/EPIC observations have revealed a more unusual two-component X-ray spectrum. A detailed analysis of such a source is presented in Stobbart, Roberts, & Warwick (2004). In this case, the ULX is the brightest X-ray source in the nearby (1.78 Mpc) Magellanic-type galaxy NGC 55 and, although its X-ray luminosity only marginally exceeds , it represents one of the highest quality ULX datasets obtained to date. The initial low flux state data were best fitted with an absorbed power-law continuum (4), while a subsequent flux increase was almost entirely due to an additional contribution at energies keV, adequately modelled by a MCD component (0.9 keV).
Whilst this accretion disc component is reasonable for stellar-mass BHs, the dominance of the power-law continuum at soft X-ray energies is problematic. Such a soft power-law cannot represent Comptonised emission from a hot corona, as one would not expect to see the coronal component extend down below the peak emissivity of the accretion disc, where there would be insufficient photons to seed the corona. Alternative sources of seed photons for the corona are unlikely; for example, the incident photon flux of the secondary star at the inner regions of the accretion disc is too low to provide the seeding (cf. Roberts et al. 2005). It also seems unlikely that the power-law emission could arise from processes at the base of a jet, as these are typically represented by much harder photon indices than measured here (1.5–2; Markoff et al. 2005 and references therein). Indeed, with the possible exception of NGC 5408 X-1 (Kaaret et al., 2003), there is no evidence that ULXs do display bright radio jets, though this cannot be excluded by current observations (Körding et al., 2005). The possibility of the soft component resulting from an outflow of material from the accretion disc may also be discounted as this would produce a thermal spectrum rather than a power-law continuum.
Although this spectral description has not been seen in Galactic systems, a second case has been reported independently for the nearest persistent extragalactic ULX (M33 X-8) by Foschini et al. (2004). The non-standard model provided the best fit to this ULX with 2.5 and 1.2 keV. However, this source is also at the low luminosity end of the ULX regime with LX 2. A further possible case, in a more luminous ULX, has arisen from the XMM-Newton data analysis of NGC 5204 X-1 (Roberts et al., 2005). In this case the authors show that there is spectral ambiguity between the non-standard fit (3.3, 2.2 keV) and the IMBH model (2.0, 0.2 keV), with both providing statistically acceptable fits to the data. Even more recently, two additional examples of this spectral form have been uncovered in an XMM-Newton survey of ULXs by Feng & Kaaret (2005).
Although it is difficult to derive a literal physical interpretation from the non-standard model, it does provide an accurate empirical description of ULX spectra in some cases, and as such it has the potential to provide new insights into the nature of these sources. Therefore in this paper we re-evaluate current data in an attempt to determine the best spectral description for the shape of high quality ULX spectra, and ask what consequences this has for the idea of ULXs as accreting IMBHs. The paper is structured as follows: Sec. 2 – introduction to the ULX sample; Sec. 3 – details of the observations and data reduction; Sec. 4 – description of the spectral analysis; Sec. 5 – a comment on the luminosity and inner disc temperature relationship of these ULXs; Sec. 6 – a discussion of our results; and finally Sec. 7 – our conclusions.
2 The Sample
As our primary goal is to find the best description(s) of the shape of ULX spectra, only the highest quality datasets were chosen. The ULXs were initially selected from the ROSAT catalogues of Roberts & Warwick (2000) and Colbert & Ptak (2002) to provide a list of historically-bright ULXs that are resolved at a spatial resolution similar to XMM-Newton444The ROSAT lists were deemed appropriate as most bright ULXs are persistent and vary by factors of no more than 2–3 in flux over a baseline of years, cf. Roberts et al. (2004).. We applied a source selection criteria of observed count rates of 10 counts ks-1 in the ROSAT HRI camera, combined with 10 ks of XMM-Newton/EPIC data available in the archive by December 2004, to select ten ULXs with potentially sufficient counts for very detailed spectral analysis. In addition, we included three more high quality ULX datasets: proprietary data for Holmberg II X-1 (hereafter Ho II X-1), and two sources not quite bright enough in the ROSAT bandpass to be classified as ULXs, namely the ULX in NGC 55 and M33 X-8. Whilst some of the sources in this sample have been observed more than once, we have only selected the longest individual exposure in each case to provide the clearest single view of their spectra. Our final sample of 13 sources from 12 different galaxies is listed in Table 1. The selected ULXs are located at distances of between 800 kpc and 17.8 Mpc, possess XMM-Newton count rates between 0.1 and 8.9 and cover the full range of ULX luminosities (– few ). Hereafter we refer to the sources by their names as given in column (1) of Table 1.
| d | LX | |||||
|---|---|---|---|---|---|---|
| Source | Alternate names | R.A. (J2000) | DEC (J2000) | (1020cm-2) | (Mpc) | (10) |
| (1) | (2) | (3) | (4) | (5) | (6) | (7) |
| NGC 55 ULX 1 | XMMU J001528.9391319 a | 00 15 28.9 | 39 13 19.1 a | 1.74 | 1.78 b | 1.3 |
| NGC 55 6 c | ||||||
| Source 7 d | ||||||
| M33 X-8 2 | – | 01 33 50.9 | 30 39 37.2 e | 5.69 | 0.70 f | 1.0 |
| NGC 1313 X-1 3 | Source 6 g | 03 18 20.0 | 66 29 11.0 h | 3.96 | 3.70 i | 4.7 |
| IXO 7 j | ||||||
| NGC 1313 X-2 3 | Source 4 g | 03 18 22.3 | 66 36 03.8 k | 3.94 | 3.70 i | 1.7 |
| IXO 8 j | ||||||
| NGC 2403 X-1 4 | Source 21 l | 07 36 25.5 | 65 35 40.0 l | 4.17 | 4.20 f | 2.7 |
| Ho II X-1 5 | IXO 31 j | 08 19 29.0 | 70 42 19.3 m | 3.41 | 4.50 i | 17 |
| M81 X-9 6 | Holmberg IX X-1 n | 09 57 53.2 | 69 03 48.3 o | 4.25 | 3.55 p | 12 |
| IXO 34 j | ||||||
| NGC 3031 10 q | ||||||
| H 44 r | ||||||
| NGC 3628 X-1 4 | IXO 39 j | 11 20 15.8 | 13 35 13.6 s | 2.22 | 7.70 f | 5.2 |
| NGC 4395 X-1 4 | NGC 4395 X2 t | 12 26 01.5 | 33 31 30.5 u | 1.36 | 3.60 f | 0.6 |
| IXO 53 j | ||||||
| NGC 4559 X-1 4 | X-7 v | 12 35 51.7 | 27 56 04.1 w | 0.82 | 9.70 f | 9.1 |
| IXO 65 j | ||||||
| NGC 4861 ULX 1 | IXO 73 j | 12 59 01.9 | 34 51 13.5 x | 1.21 | 17.80 i | 8.8 |
| X1 y | ||||||
| NGC 5204 X-1 4 | IXO 77 j | 13 29 38.6 | 58 25 05.7 z | 1.38 | 4.80 f | 4.4 |
| HST 3 z | ||||||
| U1 aa | ||||||
| M83 ULX 1 | Source 13 bb | 13 37 19.8 | 29 53 48.9 cc | 3.69 | 4.70 i | 1.0 |
| IXO 82 j | ||||||
| H30 dd | ||||||
| H2 ee |
Notes: (1) Source designation; (2) Alternative names; (3–4) X-ray source position from XMM-Newton and Chandra data, or position of possible optical counterpart; (5) Galactic absorption column density from the ‘nh’ ftools program (based on the measurements of Dickey & Lockman 1990); (6) Distance to the host galaxy; (7) Observed X-ray luminosity (0.3–10 keV) based on the results of the physically self-consistent modelling (see later). References: 1 This paper, 2 Markert & Rallis (1983), 3 Colbert et al. (1995), 4 Roberts & Warwick (2000), 5 Dewangan et al. (2004), 6 Fabbiano (1988), a Stobbart et al. (2004), b Karachentsev et al. (2003), c Read, Ponman & Strickland (1997), d Schlegel, Barrett & Singh (1997), e Foschini et al. (2004), f Ho, Filippenko, & Sargent (1997), g Schlegel et al. (2000), h Miller et al. (2003), i Tully (1988), j Colbert & Ptak (2002), k Zampieri et al. (2004), l Schlegel & Pannuti (2003), m Kaaret, Ward, & Zezas (2004), n Miller et al. (2004a), o Ramsey et al. (2006), p Paturel et al. (2002), q Radecke (1997), r Immler & Wang (2001), s Strickland et al. (2001), t Lira, Lawrence, & Johnson (2000), u Sourcelist (Obs.Id 5302) via Chandra X-ray Centre: http://cxc.harvard.edu/chaser, v Vogler, Pietsch, & Bertoldi (1997), w Cropper et al. (2004), x Sourcelist (Obs.Id 014115010) via XMM-Newton Science Archive: http://xmm.vilspa.esa.es/external/xmm_data_acc/xsa/index.shtml, y Liu & Bregman (2005), z Goad et al. (2002), aa Liu, Bregman, & Seitzer (2004), bb Ehle et al. (1998), cc Soria & Wu (2002), dd Immler et al. (1999), ee Trinchieri, Fabbiano, & Paulumbo (1985).
| Source | Obs.ID | Date | Duration (s) | Net exp. (s) | Rate (ct s-1) | MOS-1 | MOS-2 | pn | Position | Ref |
|---|---|---|---|---|---|---|---|---|---|---|
| (1) | (2) | (3) | (4) | (5) | (6) | (7) | (8) | (9) | (10) | (11) |
| NGC 55 ULX | 0028740201 | 2001-11-14 | 34025 | 30410 | 2.08 | FF | FF | FF | on-axis | 1 |
| M33 X-8 | 0102640101 | 2000-08-04 | 18672 | 6850 | 8.55 | SW | SW | FF | on-axis | 2,3,4 |
| NGC 1313 X-1 | 0106860101 | 2000-10-17 | 42769 | 18490 | 1.15 | FF | FF | FF | on-axis | 4,5,6 |
| NGC 1313 X-2 | 0106860101 | 2000-10-17 | 42769 | 18490 | 0.39 | FF | FF | FF | off-axisa | 4,5,6 |
| NGC 2403 X-1 | 0164560901 | 2004-09-12 | 84600 | 57063 | 0.47 | FF | FF | FF | on-axis | 4 |
| Ho II X-1 | 0200470101 | 2004-04-15 | 111999 | 47260 | 4.52 | LW | LW | FF | on-axis | 7 |
| M81 X-9 | 0112521101 | 2002-04-16 | 11935 | 8440 | 3.25 | FF | FF | FF | on-axis | 4,5 |
| NGC 3628 X-1 | 0110980101 | 2000-11-27 | 60745 | 45260 | 0.20 | FF | FF | FF | on-axis | 4,5 |
| NGC 4395 X-1 | 0142830101 | 2003-11-30 | 118900 | 98900 | 0.18 | FF | FF | FF | on-axis | 4,8 |
| NGC 4559 X-1 | 0152170501 | 2003-05-27 | 43290 | 37660 | 0.48 | SW | SW | FF | on-axis | 4,9 |
| NGC 4861 ULX | 0141150101 | 2003-06-14 | 29600 | 14590 | 0.11 | FF | FF | FF | on-axis | – |
| NGC 5204 X-1 | 0142770101 | 2003-01-06 | 32999 | 17048 | 0.87 | FF | FF | FF | on-axis | 4,10 |
| M83 ULX | 0110910201 | 2003-01-27 | 31722 | 21130 | 0.21 | FF | FF | EFF | off-axisb | 4 |
Notes: (1) Source designation; (2) Observation identifier; (3) Observation date (yyyy-mm-dd); (4) Observation duration (NB. this does include calibration observations in some cases); (5) Useful exposure after correcting for flaring episodes and ensuring simultaneous operation of the EPIC cameras; (6) Combined EPIC count rates derived from the combined X-ray light curves (0.3–10 keV); (7–9) Observing mode of each EPIC detector (SW : Small Window, LW : Large Window, FF : Full Frame, EFF : Extended Full Frame); (10) Source position with respect to the centre of the pn field of view: a–7 ′ offset; b– 6.5 ′ offset; (11) References for previous analyses of these datasets (although not all references contain a complete analysis of the ULX): 1–Stobbart et al. (2004), 2–Foschini et al. (2004), 3–Pietsch et al. (2004), 4–Feng & Kaaret (2005), 5–Wang et al. (2004), 6–Miller et al. (2003), 7–Goad et al. (2006), 8–Vaughan et al. (2005), 9–Cropper et al. (2004), 10–Roberts et al. (2005).
3 Observations and data analysis
In this work we have utilised data from the EPIC cameras on board XMM-Newton (Turner et al. 2001; Strüder et al. 2001). The datasets were obtained through the XMM-Newton public data archive (excluding proprietary Ho II X-1 data) and details of the observations are shown in Table 2. The data were processed and reduced using the standard tools of xmm-sas software v.6.0.0. In some cases the observations were affected by soft proton flaring for which preliminary cleaning was necessary. For these observations we extracted full field X-ray (0.3–10 keV) light curves and screened for flaring using Good Time Interval (GTI) files based on either a time or count rate criterion. The NGC 55 ULX and NGC 5204 X-1 observations were not affected by flaring episodes. The NGC 2403 X-1 observation was only affected by flaring at the end of the exposure (the last 20 ks), therefore we used a time selection to exclude this flaring event. For the remaining sources we used a count rate cut-off criterion to produce a GTI file. The exact value of the cut-off was allowed to vary from field-to-field, to provide the best compromise in each case between excluding high background periods and facilitating the longest available exposure on the ULX. In practise the actual cut-off values varied in the 6.5–17.5 (0.3–10 keV) range. In all cases we used only those data recorded when the MOS and pn cameras were in simultaneous operation (see Table 2 for the net good exposure times).
For each ULX, events were extracted in a circular aperture centred on the source position given in Table 1. The background was taken from a circular region, near to the source in the pn camera and at the same distance from the readout node. The chosen background regions were the same in all three detectors where observations were taken using the full-frame observing mode. However, in three cases the MOS cameras were operated in either the large-window or small-window mode, so here we used a background region closest to the one used for the pn extraction. The size of the source and background spectral extraction regions are listed in Table 3.
For the pn camera the spectra were extracted using event patterns 0–4, which allows ‘single’ and ‘double’ pixel events. We also set ‘FLAG=0’ to exclude all events at the edge of the CCD and events from bad pixels. For the MOS detectors we used event patterns 0–12 which allows ‘single’, ‘double’, ‘triple’ and ‘quadruple’ pixel events. We employed a less conservative screening criterion for the MOS data by using the flag expression #xmmea_em to exclude hot pixels and events outside of the field of view. The sas task especget was used to produce source and background spectra for each ULX, together with the appropriate Redistribution Matrix File (RMF) and Ancilliary Response File (ARF). Spectral files were grouped to require at least 20 counts bin-1 before fitting, to ensure Gaussian statistics.
Model spectra were fitted to the data using the HEAsoft X-ray spectral fitting package xspec (v.11.3.0). The pn, MOS-1 and MOS-2 spectra for each object were fitted simultaneously, but we included constant multiplicative factors in each model to allow for calibration differences between the cameras. This value was frozen at unity for the pn data and allowed to vary for the MOS detectors, with the values typically agreeing within 20 per cent. Quoted fluxes are an average of the three measurements.
Spectra were initially fitted in the 0.3–10 keV band. However, in several cases we found that the data below 0.5 keV did not agree with any of the models we tried, leaving large residuals (particularly with respect to the pn data) to the best fits. We note that the datasets with this problem – NGC 55 ULX, NGC 1313 X-1 & X-2 and NGC 3628 X-1 – were all obtained in the years 2000–2001 (in fact M33 X-8 is the only observation from this epoch without these fitting residuals). At first glance this would appear to be a problem with the calibration at early mission times; however the pn calibration at least has remained remarkably static in orbit (EPIC team, priv. comm.). As we cannot explain this variation we conservatively excluded these data in all EPIC cameras, such that spectral fitting was restricted to the 0.5–10 keV range in these four cases. Also, in the case of Ho II X-1 there is a possible pn calibration feature that is particularly prominent at low energies (Goad et al., 2006), therefore we followed the method of these authors and excluded the pn data below 0.7 keV to account for this, whilst retaining MOS data down to 0.3 keV.
The X-ray spectra were modified for absorption following Balucinska-Church & McCammon (1992), assuming the solar abundances of Anders & Grevesse (1989) (i.e., the wabs component in xspec). We used two absorption components, one of which was fixed for each source to represent the appropriate foreground column density through our Galaxy (Dickey & Lockman 1990 – see Table 1), and the second component was left free to fit the data to represent additional absorption within the host galaxy and/or intrinsic to the ULX. The errors quoted in this work are at the 90% confidence level for one interesting parameter. Throughout this analysis we distinguish statistically acceptable fits from unacceptable fits using a fixed criterion of per cent, where is the probability of rejection derived directly from the statistic for the spectral fit.
| Extraction radius | ||
|---|---|---|
| Source | Source | Background |
| (1) | (2) | (3) |
| NGC 55 ULX | 60 | 75 |
| M33 X-8 | 35 | 120 |
| NGC 1313 X-1 | 35 | 70 |
| NGC 1313 X-2 | 35 | 70 |
| NGC 2403 X-1 | 45 | 45 |
| Ho II X-1 | 45 | 60 |
| M81 X-9 | 30 | 45 |
| NGC 3628 X-1 | 35 | 70 |
| NGC 4395 X-1 | 40 | 40 |
| NGC 4559 X-1 | 40 | 80 |
| NGC 4861 ULX | 15 | 45 |
| NGC 5204 X-1 | 40 | 50 |
| M83 ULX | 35 | 50 |
Notes: (1) Source designation; (2)–(3) Aperture radii in arcseconds
4 Spectral properties
4.1 Simple models
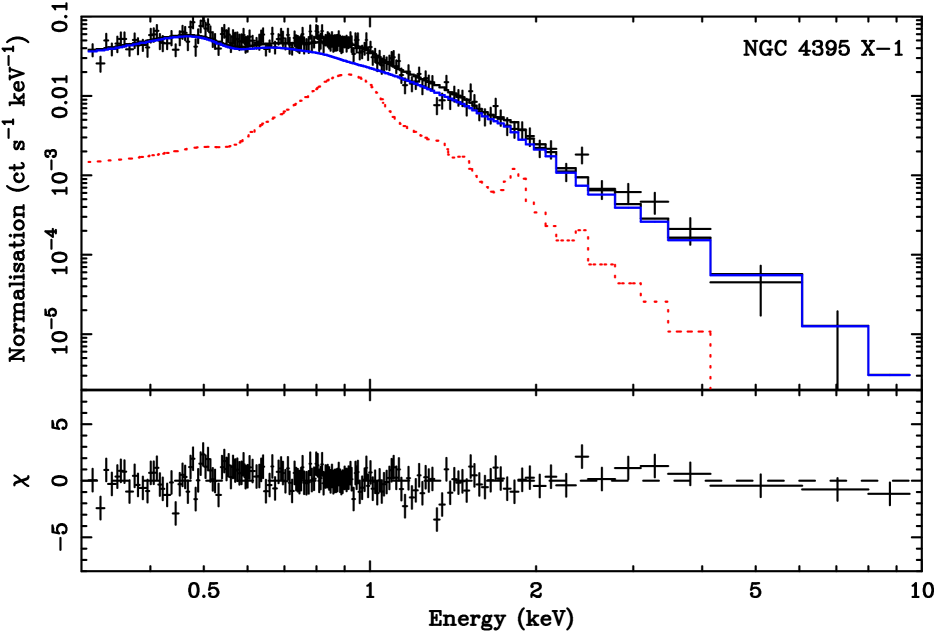
The X-ray spectra appeared relatively smooth and featureless in each case, hence we began by fitting simple continuum models to the data. We tried the two models most often used in the past as single-component descriptions of ULX spectra, namely a power-law continuum model and the canonical MCD model. The details of these fits are given in Table 4 and the quality of the X-ray spectra is illustrated using the power-law fits in Figure 1. Due to the excellent spectral quality, we were able to reject the power-law model in 8 out of the 13 cases at 95% confidence. Interestingly, the five ULXs for which a power-law is an adequate description of the data (NGC 1313 X-1 & X-2, M83 ULX, NGC 4861 ULX, NGC 5204 X-1) include the three poorest quality datasets. Even more notably, the MCD model does not provide an acceptable fit to any of the spectra.


| wa*wa*po | a | b | APc | /dof |
|---|---|---|---|---|
| NGC 55 ULX | 3.50 | 3.38 | 3.09 | 1128.9/830 |
| M33 X-8 | 1.94 | 2.28 | 6.02 | 1790.1/1115 |
| NGC 1313 X-1 | 1.05 | 1.84 | 0.55 | 723.0/675 |
| NGC 1313 X-2 | 1.68 | 2.27 | 0.31 | 261.7/257 |
| NGC 2403 X-1 | 3.78 | 2.40 | 0.65 | 1130.2/851 |
| Ho II X-1 | 1.53 | 2.76 | 3.23 | 1690.6/1314 |
| M81 X-9 | 1.57 | 1.89 | 1.92 | 938.1/864 |
| NGC 3628 X-1 | 2.77 | 1.45 | 0.10 | 459.8/406 |
| NGC 4395 X-1 | 2.73 | 4.37 | 0.09 | 540.8/368 |
| NGC 4559 X-1 | 1.15 | 2.38 | 0.27 | 752/599 |
| NGC 4861 ULX | 1.24 | 2.49 | 0.09 | 94.0/74 |
| NGC 5204 X-1 | 0.50 | 2.10 | 0.39 | 572.3/529 |
| M83 ULX | 1.22 | 2.51 | 0.14 | 199.2/207 |
| wa*wa*diskbb | b | d | AMCDe | /dof |
| NGC 55 ULX | 0.37 | 0.60 | 1.62 | 1796.3/830 |
| M33 X-8 | 0 | 1.08 | 0.62 | 1538.7/1115 |
| NGC 1313 X-1 | 0 | 1.32 | 0.04 | 1409.6/675 |
| NGC 1313 X-2 | 0.93 | 0.05 | 443.3/257 | |
| NGC 2403 X-1 | 1.20 | 1.04 | 0.06 | 923.7/851 |
| Ho II X-1 | 0 | 0.59 | 2.74 | 8646.7/131 |
| M81 X-9 | 0 | 1.42 | 0.09 | 1758.6/864 |
| NGC 3628 X-1 | 1.04 | 2.27 | (1.38 | 466.6/406 |
| NGC 4395 X-1 | 0.13 | 0.32 | 0.81 | 693.0/368 |
| NGC 4559 X-1 | 0 | 0.69 | 0.15 | 1651.4/599 |
| NGC 4861 ULX | 0 | 0.64 | 0.06 | 166.9/74 |
| NGC 5204 X-1 | 0 | 0.66 | 0.33 | 1650.1/529 |
| M83 ULX | 0.64 | 0.11 | 310.7/207 |
Notes: Models are abbreviated to xspec syntax: wa–absorption components for the Galactic value and external absorption; po–power-law continuum; diskbb–MCD. a External absorption column (), b po photon index, c po normalisation ( at 1 keV ), d Inner disc temperature (keV). e diskbb normalisation (((Rin/km)/(D/10 kpc))2 ; where Rin–inner disc radius, D–distance to source, –inclination angle of the disc). Where the reduced value (i.e. ) exceeded 2, errors are not shown. Statistically acceptable fits are highlighted in bold.
4.2 Power-law + MCD model
| wa*wa*(po+diskbb)1 | a | b | APc | d | AMCDe() | /dof | ff | fg |
|---|---|---|---|---|---|---|---|---|
| NGC 55 ULX | 3.50 | 3.38 | 3.09 | 1128.8/828 | 99.9 | 0.1 | ||
| M33 X-8 | 4.43 | 2.52 | 8.51 | 0.09 | 3312 | 1527.0/1113 | 92.7 | 7.3 |
| NGC 1313 X-1 | 2.37 | 1.77 | 0.51 | 0.19 | 0.81 | 664.5/673 | 90.9 | 9.1 |
| NGC 1313 X-2 | 1.80 | 2.11 | 0.25 | 0.27 | 0.03 | 255.0/255 | 91.7 | 8.3 |
| NGC 2403 X-1 | 7.18 | 2.68 | 0.98 | 0.09 | 527 | 1028.5/849 | 93.6 | 6.4 |
| Ho II X-1 | 1.74 | 2.63 | 2.81 | 0.19 | 211 | 1453.1/1312 | 89.7 | 10.3 |
| M81 X-9 | 2.17 | 1.81 | 1.74 | 0.20 | 1.05 | 877.2/862 | 94.0 | 6.0 |
| NGC 3628 X-1 | 4.26 | 1.58 | 0.12 | 0.08 | 127 | 424.6/404 | 98.1 | 1.9 |
| NGC 4395 X-1 | 1.96 | 3.72 | 0.05 | 0.18 | 0.11 | 492.2/366 | 71.6 | 28.4 |
| NGC 4559 X-1 | 2.33 | 2.23 | 0.24 | 0.14 | 2.74 | 597.2/597 | 81.5 | 18.5 |
| NGC 4861 ULX | 1.75 | 2.24 | 0.07 | 0.18 | 0.13 | 84.4/72 | 82.4 | 17.6 |
| NGC 5204 X-1 | 0.68 | 1.91 | 0.31 | 0.22 | 0.12 | 529.9/527 | 88.2 | 11.8 |
| M83 ULX | 1.28 | 2.47 | 0.14 | 198.6/205 | 96.6 | 3.4 | ||
| wa*wa*(po+diskbb)2 | a | b | APc | d | AMCDe() | /dof | ff | fg |
| NGC 55 ULX | 4.32 | 4.31 | 3.29 | 0.86 | 170.47 | 957.6/828 | 67.6 | 32.4 |
| M33 X-8 | 1.42 | 2.49 | 3.15 | 1.18 | 264.55 | 1187.0/1113 | 48.8 | 51.2 |
| NGC 1313 X-1 | – | – | – | – | – | – | – | – |
| NGC 1313 X-2 | 2.52 | 2.93 | 0.36 | 2.65 | 2.19 | 255.9/255 | 64.4 | 35.6 |
| NGC 2403 X-1 | 4.77 | 4.05 | 0.55 | 1.16 | 36.93 | 847.7/849 | 27.3 | 72.7 |
| Ho II X-1 | 2.34 | 3.45 | 3.78 | 1.79 | 10.33 | 1508.8/1312 | 74.5 | 25.5 |
| M81 X-9 | – | – | – | – | – | – | – | – |
| NGC 3628 X-1 | 1.43 | 1.40 | 4.68 | 439.5/404 | 53.4 | 46.6 | ||
| NGC 4395 X-1 | – | – | – | – | – | – | – | – |
| NGC 4559 X-1 | 3.35 | 4.47 | 0.41 | 1.61 | 4.04 | 637.0/597 | 47.3 | 52.7 |
| NGC 4861 ULX | 3.33 | 4.36 | 0.13 | 1.60 | 1.09 | 85.6/72 | 51.9 | 48.1 |
| NGC 5204 X-1 | 1.64 | 3.33 | 0.44 | 2.23 | 1.96 | 525.5/527 | 50.3 | 49.7 |
| M83 ULX | 1.37 | 2.75 | 0.14 | 4.53 | 198.1/205 | 82.9 | 17.1 | |
| wa*wa*(bb+diskbb) | a | h | ABi | d | AMCDe() | /dof | fj | fg |
| NGC 55 ULX | 1.43 | 0.20 | 3.35 | 0.81 | 343 | 884.1/828 | 36.4 | 63.6 |
| M33 X-8 | 0.16 | 0.27 | 3.09 | 1.26 | 303 | 1216.7/1113 | 11.7 | 88.3 |
| NGC 1313 X-1 | 0.60 | 0.25 | 0.86 | 2.20 | 5.07 | 666.5/673 | 17.7 | 82.3 |
| NGC 1313 X-2 | 0.27 | 0.41 | 1.71 | 4.02 | 257.1/255 | 27.7 | 72.3 | |
| NGC 2403 X-1 | 2.02 | 0.21 | 0.38 | 1.12 | 46.63 | 830.0/849 | 8.7 | 91.3 |
| Ho II X-1 | 0.23 | 4.37 | 1.28 | 77.69 | 1677.9/1312 | 41.4 | 58.6 | |
| M81 X-9 | 0.64 | 0.27 | 2.56 | 2.21 | 15.93 | 922.3/862 | 17.5 | 82.5 |
| NGC 3628 X-1 | 0.71 | 0.60 | 0.16 | 4.32 | 0.13 | 429.4/404 | 17.7 | 82.3 |
| NGC 4395 X-1 | 0.34 | 0.17 | 0.15 | 0.61 | 17.66 | 464.5/366 | 65.5 | 34.5 |
| NGC 4559 X-1 | 0.80 | 0.17 | 0.61 | 1.33 | 9.94 | 604.9/597 | 30.6 | 69.4 |
| NGC 4861 ULX | 0.46 | 0.20 | 0.15 | 1.37 | 2.38 | 77.7/72 | 34.1 | 65.9 |
| NGC 5204 X-1 | 0.20 | 0.67 | 1.69 | 7.37 | 527.8/527 | 28.0 | 72.0 | |
| M83 ULX | 0.21 | 0.16 | 1.10 | 9.28 | 193.2/205 | 27.8 | 72.2 |
Notes: Models are abbreviated to xspec syntax: wa, po and diskbb as before, bb–blackbody continuum. Model fitted with a cool1 or hot2 diskbb component. a External absorption column (), b po photon index, c po normalisation ( at 1 keV), d inner disc temperature (keV). e diskbb normalisation as before (((Rin/km)/(D/10 kpc))2 ), f fraction of the total flux (0.3–10 keV) in the po component, g fraction of the total flux (0.3–10 keV) in the diskbb component, h blackbody temperature (keV), i blackbody normalisation, (L39/D; where L39–source luminosity in , D10–source distance in 10 kpc). j Fraction of the total flux (0.3–10 keV) in the bb component. k Unconstrained at the 90 per cent confidence level. In the three cases in the central portion of the table where no fit is shown, the -minimisation always found the minimum describing the IMBH model. Statistically acceptable fits are highlighted in bold. (NB. In cases where the spectral fitting was not performed over the 0.3–10 keV energy range, we created a dummy response matrix in xspec (see Sec. 4.5), to determine the fraction of the total flux in each spectral component over 0.3–10 keV, consistent with the other datasets).
As simple spectral models were inadequate, we proceeded to fit the data with the two component model generally employed for BHB systems, namely the combination of a power-law plus a MCD component. More specifically, we began by testing the standard IMBH model, i.e., a cool accretion disc plus power-law continuum model. This spectral description improved on the simple models by providing acceptable fits to 8 sources (NGC 1313 X-1 & X-2, M81 X-9, NGC 3628 X-1, NGC 4559 X-1, NGC 4861 ULX, NGC 5204 X-1, M83 ULX), with 0.1 keV keV and (Table 5). As with previously published work, these disc temperatures are broadly consistent with IMBHs of around 1000- in size, though the power-law slopes are puzzlingly shallow for what are supposed HS (or VH state) sources (see Roberts et al. 2005 for further discussion). In all cases the 0.3–10 keV flux is dominated by the power-law component.
We then attempted to fit the X-ray spectra with the non-standard model i.e., with the power-law component dominant at soft energies. This also provided statistically-acceptable fits to 8 ULXs (M33 X-8, NGC 1313 X-2, NGC 2403 X-1, NGC 3628 X-1, NGC 4559 X-1, NGC 4861 ULX, NGC 5204 X-1, M83 ULX), with disc temperatures of 1.2 keV keV (excluding M 83 for which the temperature is unconstrained below 4 keV) and (except NGC 3628 X-1, for which is unconstrained below 1.2) (Table 5). The balance in 0.3–10 keV flux between the two components was much more varied for this model, though most sources showed a relatively equitable balance (ratios of no more than 3:1 in either direction, and 1:1 in five cases).
In total, the power-law + MCD combination could not be rejected at 95 per cent confidence for 10/13 sources in the sample. Two of these sources were unambiguously best fitted with the IMBH model (NGC 1313 X-1, M81 X-9) while two more were best fitted by the non-standard model (M33 X-8, NGC 2403 X-1). Statistically acceptable fits existed for both models for the remaining six sources. Three sources in this sample (NGC 55 ULX, Ho II X-1 and NGC 4395) rejected both models at percent confidence, although a comparison of the fits show that the spectrum of the NGC 55 ULX appeared to fit much better to the non-standard model, whilst Ho II X-1 and NGC 4395 X-1 much preferred the IMBH model.
This sample of high quality ULX datasets demonstrates spectral ambiguity for six sources (NGC 1313 X-2, NGC 3628 X-1, NGC 4559 X-1, NGC 4861 ULX, NGC 5204 X-1, M83 ULX). As Roberts et al. (2005) suggest, a key discriminator between the models could be a test for spectral curvature at high energies ( keV). Curvature is not expected in the IMBH model where the power-law component is dominant above 2 keV, whereas sources best-fitted by the non-standard model have the curved MCD component dominant at these hard X-ray energies. We therefore attempted to fit the high energy (2–10 keV) ULX spectra with a broken power-law model. For comparison we also fitted the 2–10 keV ULX spectra with a single power-law component, as shown in Table 6. We did not include absorption in the fit in either case, as single- and two-component fits generally limit absorption to , which should not strongly affect the data above 2 keV. When we do include absorption in these fits we actually measure far higher columns in several cases, which is physically unrealistic (and may be a result of the absorption compensating for intrinsic curvature). The results of the broken power-law spectral fits, together with the statistical probability of the fit improvement over the single power-law fits (using the F-test) are shown in Table 7.
To demonstrate the validity of this method, the two sources with unambiguous non-standard fits (M33 X-8 and NGC 2403 X-1), plus NGC 55 ULX which clearly prefers this model, show unacceptable power-law fits that are made acceptable by the inclusion of a break. In these cases the improvement is highly statistically significant ( improvement over a simple power-law fit according to the F-test). However, these were the clearest-cut cases. Of the ambiguous spectra, three out of six showed evidence for curvature. This was marginal in the case of M83 ULX ( level), but more significant for NGC 4559 X-1 and NGC 5204 X-1 (), with the latter case having an unacceptable power-law fit. Most interestingly, though, one of the IMBH-fit sources (NGC 1313 X-1) shows evidence for curvature ( improvement), whilst Ho II X-1 also shows a significant break ( improvement). In total 8/13 sources show at least marginal evidence for curvature at the high energy end of their XMM-Newton spectrum. This is strongly suggestive that the majority of sources are not dominated by a power-law continuum at these energies, such as one might expect to see if the X-ray emission arises from the optically thin, hot corona assumed in the IMBH model.
| wa*wa*po | a | APb | /dof |
|---|---|---|---|
| NGC 55 ULX | 3.58 | 3.57 | 459.3/326 |
| M33 X-8 | 2.59 | 8.90 | 663.1/548 |
| NGC 1313 X-1 | 1.70 | 0.44 | 263.7/259 |
| NGC 1313 X-2 | 2.19 | 0.27 | 60.2/70 |
| NGC 2403 X-1 | 2.63 | 0.82 | 467.3/340 |
| Ho II X-1 | 2.61 | 2.65 | 805.7/824 |
| M81 X-9 | 1.78 | 1.59 | 360.4/355 |
| NGC 3628 X-1 | 1.50 | 0.10 | 219.5/211 |
| NGC 4395 X-1 | 4.48 | 0.12 | 33.1/28 |
| NGC 4559 X-1 | 2.28 | 0.24 | 171.3/155 |
| NGC 4861 ULX | 2.50 | 0.09 | 12.3/8 |
| NGC 5204 X-1 | 1.89 | 0.29 | 160.8/133 |
| M83 ULX | 2.67 | 0.17 | 45.5/39 |
Notes: Models are abbreviated to xspec syntax: po as before. a po photon index, b po normalisation ( at 1 keV). Statistically acceptable fits are highlighted in bold.
| wa*wa*bknpo | a | b | c | ABPd | /dof | e | 1-P(F-test)f |
|---|---|---|---|---|---|---|---|
| NGC 55 ULX | 3.08 | 3.90 | 5.34 | 2.32 | 341.0/324 | 118.3 | 99.9 |
| M33 X-8 | 2.17 | 3.94 | 3.32 | 6.07 | 516.1/546 | 147.0 | 99.9 |
| NGC 1313 X-1 | 1.55 | 4.93 | 2.16 | 0.37 | 250.9/257 | 12.9 | 99.8 |
| NGC 1313 X-2 | – | – | – | – | – | – | – |
| NGC 2403 X-1 | 2.07 | 4.00 | 4.05 | 0.49 | 325.4/338 | 141.9 | 99.9 |
| Ho II X-1 | 2.55 | 5.31 | 3.08 | 2.50 | 786.1/822 | 19.6 | 99.9 |
| M81 X-9 | – | – | – | – | – | – | – |
| NGC 3628 X-1 | – | – | – | – | – | – | – |
| NGC 4395 X-1 | 2.77 | 2.45 | 4.92 | 0.09 | 30.0/26 | 3.1 | 72.1 |
| NGC 4559 X-1 | 2.07 | 4.77 | 3.14 | 0.20 | 157.7/153 | 13.6 | 99.8 |
| NGC 4861 ULX | – | – | – | – | – | – | – |
| NGC 5204 X-1 | 1.65 | 4.92 | 2.99 | 0.23 | 138.3/131 | 22.5 | 99.9 |
| M83 ULX | 1.79 | 2.41 | 3.11 | 37.5/37 | 8.0 | 97.2 |
Notes: Models are abbreviated to xspec syntax:bknpo–broken power-law model. a Photon index below the break energy, b break point for the energy (keV), c photon index above the break energy, d bknpo normalisation ( at 1 keV), e improvement over a single po fit, for two extra degrees of freedom, f statistical probability (per cent) of the fit improvement over a single po fit. We only show the results where we could constrain fits that showed the requisite behaviour, i.e. and constrained in the 2–10 keV range.. Statistically acceptable fits are highlighted in bold.
4.3 Dual thermal models
In the above analysis we determine that there is (at least marginal) evidence of curvature above 2 keV in the majority of our sources, arguing that a power-law continuum is not an adequate description of this emission, while the hotter accretion disc present in the alternate model may be more appropriate. The situation below 2 keV is less clear cut. Though the alternate model uses a power-law continuum to describe the soft component, this is modified to appear curved by absorption. As this power-law emission is difficult to understand physically we have therefore explored a new variation of the alternate model in which the soft component is also intrinsically curved (i.e., it does not rely solely on absorption to produce the observed curvature). In this model we fitted a cool blackbody (BB) continuum to the soft component, and a MCD to the hard component. The physical motivation for the soft component comes from the suggestion that optically-thick outflowing winds from BHs accreting at or above the Eddington limit could explain ultrasoft components in ULXs (King & Pounds, 2003). Such winds would appear as BB continua with temperatures of 0.1–0.3 keV. One might then observe emission from both the accretion disc and the wind given a favourable accretion disc geometry and viewing angle (A. King, priv. comm.)555Miller et al. (2004a) argue that cool, optically-thick outflows cannot explain the soft excess in ULXs as it would be impossible to form powerful enough shocks to produce a luminous non-thermal power-law continuum component in such systems. If the hard component is not a power-law, but instead originates directly from the accretion disc, then the requirement for shocks to be present is removed and their argument is circumvented..
The results of applying this new model to the data are shown in Table 5. It proved to be the most successful empirical description of the data, providing statistically acceptable fits to 10 out of the 13 sources, with 0.15 keV keV and 0.8 keV keV (excluding NGC 3628 X-1 for which the temperatures are much higher than shown in the other sources, i.e., 0.6 keV and 4.3 keV). This model provided the only acceptable empirical fit to the ULX in NGC 55, and all six ambiguous sources are adequately described by this model. Curiously, this is also true for both IMBH sources (though it does provide a notably worse fit than the IMBH model for M 81 X-9), and for one of the two non-standard model sources (NGC 2403 X-1). However, this model could not provide statistically acceptable fits to the other non-standard source (M 33 X-8) or to the final two ULXs (Ho II X-1 & NGC 4395 X-1, which also do not fit well with the power-law + MCD combination).
4.4 Why do Ho II X-1 and NGC 4395 X-1 not conform?
| wa*wa*(mekal+po) | a | b | AMc | d | APe | /dof | ff | fg |
|---|---|---|---|---|---|---|---|---|
| Ho II X-1 | 1.420.04 | 0.660.03 | 15.73 | 2.670.02 | 2.900.05 | 1463.9/1312 | 96.7 | 3.3 |
| NGC 4395 X-1 | 1.730.13 | 0.750.04 | 1.320.15 | 3.88 | 5.38 | 397.5/366 | 84.4 | 15.6 |
| NGC 4559 X-1 | 1.26 | 0.250.02 | 7.23 | 2.25 | 0.240.01 | 612.1/597 | 92.8 | 7.2 |
Notes: Models are abbreviated to xspec syntax: wa and po as before, mekal–thermal plasma model. a External absorption column (), b plasma temperature (keV), c mekal normalisation ((, where D is the distance to the source (cm), is the electron density (cm-3), is the hydrogen density (cm-3)), d po photon index, e po normalisation ( at 1 keV), f fraction of the total flux (0.3–10 keV) in the po component, g fraction of the total flux (0.3–10 keV) in the mekal component. Statistically acceptable fits are highlighted in bold. (NB For Ho II X-1 we created a dummy response matrix over the 0.3–10 keV energy range, to determine the fractional flux in each spectral component (see Sec 4.5)).
As shown in the previous sections, statistically acceptable fits for Ho II X-1 and NGC 4395 X-1 cannot be found using the chosen two-component models. Interestingly, these are two of the softest sources in the sample which means that their X-ray spectra are relatively dominated by keV emission, where it is most sensitive to absorption characteristics (cf. Fig. 1). The analysis of an RGS spectrum of Ho II X-1 by Goad et al. (2006) revealed that its X-ray emission is subject to absorption by a medium with a sub-solar oxygen abundance. The mis-modelling of absorption, in combination with the exceptionally high signal to noise EPIC spectrum of Ho II X-1, may be responsible for the lack of a good fit to this ULX in our analysis. However, even after correcting for the sub-solar abundance absorption acting on Ho II X-1, Goad et al. (2006) still did not find acceptable fits using the canonical power-law + MCD model. Instead, a statistically acceptable solution to the spectrum was found through using a more physical model, namely the diskpn + comptt combination. We explore the utility of a similar model in describing our whole dataset in the next section.
In the case of NGC 4395 X-1, a further inspection of the residuals to a simple power-law fit does suggest some structure, notably including a smooth ‘hump’ at 1 keV, which is unlike the featureless X-ray spectra of the other ULXs. Therefore we tried a fit including a mekal component (nominally representing the emission spectrum from hot, collisionally-ionised gas) in addition to a power-law continuum to model this spectrum. The result is shown in Table 8. This model does indeed provide the best (and only statistically accceptable) fit to NGC 4395 X-1 with /dof = 397.5/366. The model fitted to the pn count rate spectrum is shown in Fig. 3, as well as the individual additive model components. From this figure, one can clearly see how the mekal component effectively models the emission hump at 1 keV. Using a fixed solar-abundance absorber, we find the temperature of the mekal component is 0.75 keV, while the photon index is quite steep at 4.
mekal components have been reported in the spectral fits of a small number of ULXs. In fact, two other ULXs within this sample have been described thus in previous analyses, namely Ho II X-1 based on joint ROSAT - ASCA fits (Miyaji, Lehmann & Hasinger, 2001), and NGC 4559 X-1 based on one of two Chandra observations (Roberts et al., 2004). We have investigated whether such mekal + power-law models can be applied to the current data for these sources, and show the results in Table 8. This model is again rejected for Ho II X-1, though it is notable that the quality of the fit is very close to that of the best empirical description of the source (cool MCD plus power-law). In this case the temperature of the mekal is again relatively high at 0.66 keV, but the contribution of this component is minimal ( 3 per cent of the 0.3–10 keV flux)666The contribution of the mekal is so small that its parameterisation is relatively insensitive to changes in metallicity. For example, setting a low abundance (as found by Miyaji et al. 2001) leaves the temperature of the mekal unchanged at 0.66 keV.. This is both far hotter and far fainter than the 0.3 keV thermal plasma that composed 20 - 30 per cent of the 0.5–2 keV emission modelled by Miyaji et al. (2001). On the other hand, the temperature of the best-fitting mekal to NGC 4559 X-1 is lower, at 0.25 keV, but it does constitute part of a statistically-acceptable fit to the data. This temperature is similar to the 0.18 keV plasma inferred by Roberts et al. (2004). We note that this latter result just adds to the spectral ambiguity already seen in the case of this ULX.
| wa*wa*(diskpn+eqpair) | a | b | ADc | lh/lsd | e | AEf | /dof |
|---|---|---|---|---|---|---|---|
| NGC 55 ULX | 2.12 | 0.240.01 | 1.37 | 4.54 | 0.96 | 889.3/827 | |
| M33 X-8 | 1.03 | 0.08 | 3.22 | 18.7 | 1083 | 1188.0/1112 | |
| NGC 1313 X-1 | 2.09 | 0.21 | 2.22 | 0.2 | 9.99 | 658.7/672 | |
| NGC 1313 X-2 | 1.44 | 0.26 | 1.83 | 9.2 | 0.72 | 254.1/254 | |
| NGC 2403 X-1 | 2.53 | 0.27 | 0.11 | 4.50 | 0.36 | 831.7/848 | |
| Ho II X-1 | 1.11 | 0.20 | 2.01 | 1.01 | 8.5 | 26.7 | 1414.8/1311 |
| M81 X-9 | 1.90 | 0.23 | 3.25 | 0.5 | 18.9 | 873.8/861 | |
| NGC 3628 X-1 | 4.28 | 0.07 | 167 | 26.9 | 47.8 | 424.9/403 | |
| NGC 4395 X-1 | 1.00 | 0.20 | 0.15 | 5.97 | 0.03 | 467.0/365 | |
| NGC 4559 X-1 | 1.97 | 0.16 | 2.21 | 2.23 | 13.9 | 4.12 | 577.5/596 |
| NGC 4861 ULX | 1.09 | 0.24 | 0.06 | 5.30 | 0.06 | 78.7/71 | |
| NGC 5204 X-1 | 0.24 | 0.29 | 0.09 | 4.32 | 26.3 | 0.25 | 505.8/526 |
| M83 ULX | 0.65 | 0.23 | 0.05 | 1.96 | 0.32 | 193.2/204 |
Notes: Models are abbreviated to xspec syntax: wa as before, diskpn–accretion disc model, eqpair–Comptonisation model, a External absorption column (), b maximum temperature in the accretion disc (keV), c diskpn normalisation (; where M–central mass (), D–distance to the source (kpc), i–inclination angle of the disc, –colour/effective temperature ratio), d ratio between the compactness of the electrons and the compactness of the seed photon distribution, e optical depth, f eqpair normalisation (corresponding to the disc component) i.e., , where is the covering factor. Statistically acceptable fits are highlighted in bold.
Finally, if NGC 4395 X-1 really does possess an X-ray line-emitting component, what is its physical origin? Several ideas have been put forward to explain such a component in the spectrum of an ULX. Miyaji et al. (2001) suggest the presence of a young supernova remnant coincident with Ho II X-1, a theme expanded on by Feng & Kaaret (2005). Indeed, these authors independently confirm the presence of the mekal component in the spectrum of NGC 4395 X-1, and find two further ULXs with similar characteristics. Alternately, as Roberts et al. (2004) find the mekal component in NGC 4559 X-1 to switch on between two Chandra observations separated by 5 months, they suggest that the plasma may originate in the collision of a jet or outflow from the ULX with a denser medium in the close proximity of the system. A second alternative is offered by Terashima & Wilson (2004), who suggest that emission lines in the spectrum of an ULX in M51 may originate from a photoionised stellar wind, similar to what is seen in some high-mass X-ray binaries in our own Galaxy. A final point of interest is that a broad 1 keV feature, similar to that driving the mekal fit in NGC 4395 X-1, has recently been seen in the XMM-Newton spectrum of GRS 1915+105 by Martocchia et al. (2005) (although see their paper for caveats). One intriguing possibility is that this feature could originate in a disc wind. Clearly ULXs possessing mekal components in their spectra are an interesting subject in their own right, and should be the subject of future attention.
4.5 Physical models
The success of the comptt model in describing the spectra of some ULXs (e.g. Miller et al. 2003, Goad et al. 2006) shows that a Comptonised spectrum is in principle another viable alternative. The comptt model however, is not fully self-consistent e.g., it allows spectra to have temperatures higher than expected when Compton cooling is taken into account. We therefore attempted to fit a more physical model to the ULX spectra, namely the eqpair model (Coppi, 1999), which allows thermal and non thermal electron distributions. In our modelling, we assume a purely thermal electron distribution, the temperature of which is computed self-consistently by balancing heating and cooling (the latter of which is mainly due to Compton cooling). A key parameter of this model is the ratio /, where and represent the compactness of the electrons and the compactness of the seed photon distribution respectively. This ratio depends on the geometry of the source as well as the internal mechanisms, and it provides the dominant influence on the spectral shape. The source geometry assumed is either spherical or a disc-corona (slab) geometry. Low energy (UV or X-ray) thermal photons from the accretion disc are assumed to be emitted uniformly inside the source region for the spherical models and enter from the base of the corona in the slab geometry. We take the seed photons to have an accretion disc spectrum as described with the diskpn model of Gierliński et al. (1999), with the inner edge of the disc at . This model assumes a proper general relativistic potential and has a characteristic temperature . To allow for a patchy Compton corona, we add a second diskpn component to the model, with the temperature coupled to that of the eqpair seed photons.
This model ultimately proved the best description of the ULX spectra in our sample, with statistically acceptable fits to 11/13 datasets, all with similar or improved goodness of fits compared to the best empirical modelling, for only one extra degree of freedom. Only Ho II X-1 and NGC 4395 X-1 were rejected at per cent confidence (see Table 9), although in the case of Ho II X-1 it does provide clearly the best fit of all that were attempted to the data, and is only marginally rejected ( per cent). Again the fit to NGC 4395 X-1 is poor, for reasons explained in the previous section.
The fits provide a uniformly low measurement of the disc temperature across the sample, in the range 0.07 0.29. Taken in isolation, this might be interpreted as strong support for the presence of IMBHs in ULXs. However, many of the fits show a second remakable characteristic, which is that the optical depth of the coronae appear to be very high, ranging from for Ho II X-1 up to depths well in excess of 30 (NGC 55 ULX, NGC 2403 X-1)777Indeed, the optical depth for four sources hit the artificial upper limit of 100 during spectral fitting, therefore we quote values as ‘lower limit’ in these cases.. Importantly, this result gives a physical explanation for the curvature noted to be present in the spectra in previous sections. This second characteristic appears irreconcilable with the main assumption behind the IMBH model, which is that they operate as simple scaled-up BHBs (see also Goad et al. 2006), as such sources typically do not possess very optically-thick coronae. This result must therefore strongly challenge the IMBH interpretation for the nine ULXs (including Ho II X-1) well-described by this model. However, three ULXs - NGC 1313 X-1, M81 X-9 and (possibly) NGC 3628 X-1 - may still possess optically-thin coronae, and as such remain viable IMBH candidates.
As this spectral model provides at least the same goodness of fit as the empirical models in all but one case, we used these fits to determine the observed X-ray flux. Due to uncertainties in the low energy spectrum of some ULXs, the spectral fitting was restricted to 0.5–10 keV (and in the case of Ho II X-1 the pn data was restricted to 0.7–10 keV) instead of the 0.3–10 keV range adopted for the other sources. Therefore to determine the absorbed X-ray flux of each ULX over the same energy range, we created a dummy response matrix in xspec over the 0.3–10 keV energy range for those cases with calibration uncertainties. This dummy response temporarily supersedes the response matrix used in the spectral fitting of those sources, allowing us to examine the behaviour of the diskpn+eqpair model over this energy range. The three EPIC cameras are consistent to within 20 per cent in 12/13 cases, therefore we derived an absorbed flux (0.3–10 keV) for each of these ULXs based on an average of the three measurements. We converted these fluxes to an observed X-ray luminosity for each source in the 0.3–10 keV band (assuming the appropriate distance) and tabulate the results in Table 1888Although the power-law + mekal spectral model statistically provided the best fit to NGC 4395 X-1, the measured source flux derived from this model and the diskpn+eqpair model were in close agreement. For consistency, we quote the value from the diskpn+eqpair model. However, as the ULX lay on a hot column in the pn data we simply use the average of the two MOS flux measurements to estimate its luminosity..
5 A comment on the relationship between X-ray luminosity and inner-disc temperature in ULXs.
Perhaps the most visually striking evidence for ULXs containing IMBHs was presented by Miller, Fabian, & Miller (2004b) (their Figures 1 & 2). These authors selected a sample of ULXs with published estimates of LX , that require a soft excess component (at least at the confidence level) in the low energy part of a two component X-ray spectrum. They then compared the inferred disc temperatures (taken from the soft component) and unabsorbed luminosities (0.5–10 keV) of their ULXs to those of a number of Galactic BHBs, and found that these ULXs and stellar mass BHBs occupy distinct regions of a LX – diagram. More specifically, the ULXs are more luminous but have cooler thermal disc components than standard stellar-mass BHBs, consistent with the ULXs harbouring IMBHs.
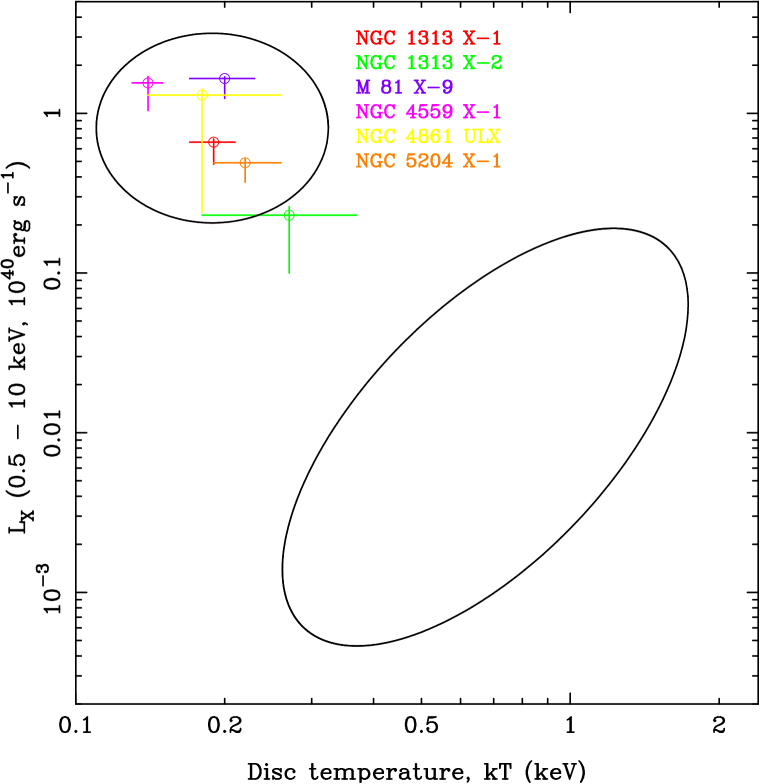
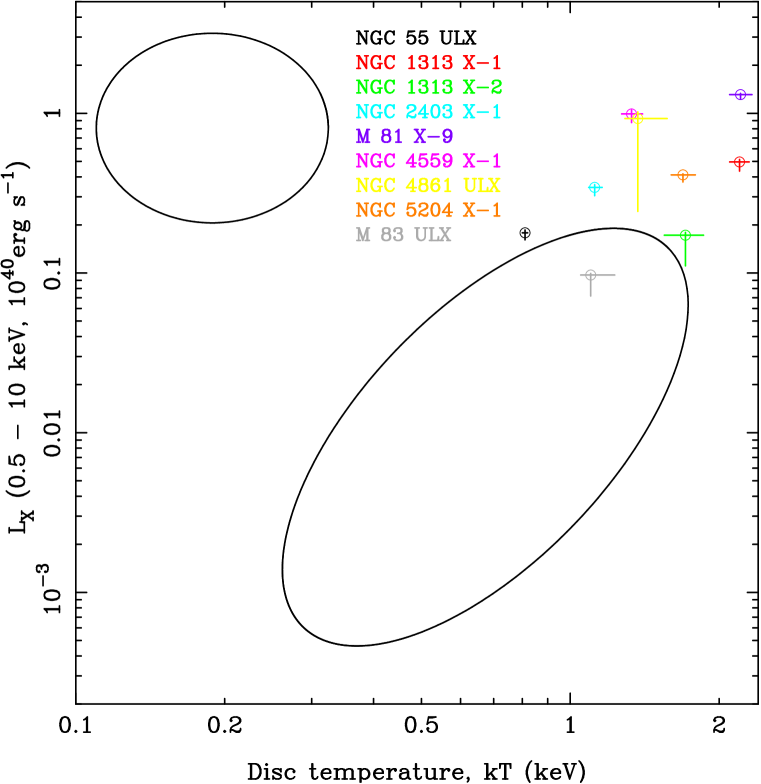
Following on from this work, we have reproduced LX – diagrams, based on the inferred unabsorbed 0.5–10 keV X-ray luminosities for ULXs in this sample (Fig. 4). However, we do this for two cases: (i) disc temperatures measured from the IMBH (cool disc + hard power-law) fits; and (ii) disc temperatures taken from the dual thermal (cool blackbody + warm disc) fits. In both cases we only show sources where the spectral fits are statistically acceptable, and the fit parameters are well constrained. For this reason, we excluded the values from the IMBH fit to M83 ULX, as the disc temperature is unconstrained in this case. Additionally, NGC 3628 X-1 does not appear on either plot as its unusual disc temperatures place it outside the range displayed in both cases. In each case the luminosity was derived from an average of the unabsorbed flux (0.5–10 keV) from each detector. The errors on the disc temperature are 90 per cent confidence errors, likewise the luminosity errors are based on the 90 per cent confidence errors in the average measured flux, as calculated by xspec. Finally, we illustrate the regions of parameter space occupied by the BHBs and ULXs in Miller et al. (2004b) by ellipses, with the ellipse representing IMBH-candidate ULXs at the upper-left.
The two LX – diagrams in Fig. 4 tell very different stories. As would be expected, our IMBH model results reproduce those of Miller et al. (2004b), i.e., the ULXs occupy a very different region of parameter space to the stellar-mass BHBs, consistent with larger black holes and hence more luminous, cooler accretion discs. However, the dual thermal model disc temperatures suggest an alternative interpretation. In this case, the ULXs appear to be a direct, high luminosity extension of the BHB class, and follow the LX trend one would expect from standard accretion discs. Obviously one cannot conclude which is the correct interpretation on the basis of these plots. However, it does demonstrate very clearly that it is the choice of empirical model used to determine the characteristics of ULX spectra that governs whether one concludes that some ULXs contain IMBHs, or whether they are more similar to stellar-mass BHBs.
6 Discussion
In this work we have analysed the X-ray spectra of a small sample of 13 ULXs, that constituted the highest quality (i.e. most photon-rich) datasets in the XMM-Newton data holdings as of December 2004. We demonstrate that the superior collecting area of XMM-Newton over its rivals leads to better spectral definition, primarily through the rejection of simple single-component spectral models (power-law, MCD) that have adequately described previous spectra of many of these ULXs. However, we are still photon-limited in many of these spectra, to the extent that in six cases we are unable to tell whether a combination of a MCD plus a power-law uniquely fits the data with the MCD component at the low or the high energy end of the X-ray spectrum. In each of these six ambiguous spectra, we accumulated no more than 18000 EPIC counts (pn and MOS combined). In each spectrum that we resolved this simple ambiguity, or excluded both cases as unacceptable fits, we had EPIC counts (excluding NGC 4395 X-1, as this had both an atypical spectrum and an underestimated pn count rate due to its location on a hot column). Even then, the introduction of a model composed of two thermal components adds an extra layer of ambiguity to many of the datasets. This suggests that one requires very photon-rich datasets to make progress in descriptive empirical XMM-Newton ULX spectroscopy, equivalent to at least 100-ks of flare-free data for a 0.2 on-axis ULX observed by the EPIC cameras, and spectral results from poorer quality data should be regarded with caution.
Issues of spectral ambiguity aside, perhaps our most interesting result is the probable detection of curvature in the high-energy part of the XMM-Newton EPIC spectrum in more than half of the sample. Though this has previously been detected in individual ULXs (Stobbart et al. 2004; Foschini et al. 2004), or as minority populations in ULX samples (Feng & Kaaret, 2005), this is the first suggestion that the majority of ULXs, across the whole range of ULX luminosity, might appear thus. Indeed, we demonstrate that the most successful empirical modelling of our sample is achieved using a model in which the high-energy portion of the spectrum is described by the MCD model, with a soft excess modelled as a cool blackbody emitter.
This obviously adds to the challenges in modelling ULXs as IMBHs. Indeed, though 8/13 ULXs present acceptable fits to the simple IMBH model of a cool disc plus a hard power-law continuum, we are again faced with the problem noted by Roberts et al. (2005). Namely we detect a very dominant power-law ( per cent of the observed 0.3–10 keV flux) that appears too hard for what should be a HS (or perhaps VH) source, if we are to believe that the inner-disc temperature can provide an estimate of the BH mass ( for the IMBH candidates in our sample, compared to approximately for the HS, and for the VH state - McClintock & Remillard 2003). Curvature above 2 keV compounds these problems further, as the IMBH model assumes that whilst the bigger black hole results in a cooler accretion disc, the corona remains similar to that observed in Galactic BHBs, i.e. optically-thin and hence modelled with a power-law. In fact, there is no reason to suppose that increasing the mass of the BH should alter the state of the corona - timing measurements at least appear to scale linearly with BH mass for given spectral states, implying the properties of the states themselves are invariant with mass (cf. Done & Gierliński 2005). But the detection of curvature implies that either the state of the coronae is changing as the BH becomes more massive, or a different physical process is responsible for the emission above 2 keV.
The dual thermal model uses a MCD to model this curvature, with inner disc temperatures in the range 1.1–2.2 keV. As Fig 4 shows, this provides a natural explanation of ULXs as a simple extension of the behaviour of Galactic BHBs, with more luminous and slightly hotter discs. In this case, assuming one can exceed the Eddington limit, there is no obvious requirement for IMBHs. However, even this simple empirical model has limitations; for instance, in order to see both the inner regions of the accretion disc and an optically-thick outflow simultaneously, one requires a very specific geometry and viewing angle. One may therefore have to consider further explanations for the origin of the soft excess component; we note that one interesting suggestion, that has recently been found to work in some AGN X-ray spectra, is that the soft excess could arise in relativistically-blurred atomic features found in the reflection spectrum of a photoionised accretion disc (Crummy et al., 2006). A further concern for this model is that similar spectral shapes have not been commonly found in Galactic BHBs, with the exception of slight soft excesses (modelled by the extension of the power-law component below the MCD) seen in the spectra in LMC X-1 and LMC X-3 (Haardt et al., 2001). One explanation could be that soft excesses, below the MCD component in Galactic BHB spectra, are not seen due to a combination of high absorption columns and lack of detector sensitivity at low X-ray energies. However, the columns to a significant minority of BHBs are not much in excess of the cm-2 columns inferred for our ULXs (McClintock & Remillard, 2003), and many have now been observed by XMM-Newton and Chandra without such soft excesses being reported. Perhaps this is simply telling us that this spectral shape is unique to the very high accretion rates required if ULXs contain stellar-mass BHs.
The model that did best in terms of providing acceptable fits to the data was also the only physically self-consistent model we used in the analysis, namely the diskpn+eqpair spectral model. The best fits provided by this model show, without exception, that the accretion disc photons seeding the corona are cool. In fact they are cool enough, at keV, to be consistent with the accretion disc around an IMBH. However, this model also provides a physical explanation for the curvature above 2 keV: unlike in conventional BHBs, it originates in an optically-thick corona. This combination of a cool disc and optically-thick corona has already been observed in Ho II X-1; Goad et al. (2006) note the cosmetic similarities between this spectral model and the model of Zhang et al. (2000) of a three-layered atmospheric structure in the accretion discs around BHBs. More specifically, their model includes a warm layer (1–1.5 keV, 10) between the cool optically-thick accretion disc (0.2–0.5 keV) and the hot optically-thin corona (100 keV, 1) of BHBs, which is responsible for the dominant component below 10 keV (see also Nayakshin & Melia 1997, Misra et al. 1998). The warm layer appears relatively stable and hence unconnected to the hot corona, which can be highly dynamic and even disappear completely (Misra et al., 1998). In this picture, the cool disc seeds the warm optically thick scattering medium, and as such may explain both components seen in our modelling.
This model has been successful in describing the X-ray spectrum of GRS 1915+105 (Zhang et al., 2000), and so Goad et al. (2006) speculate that this modelling, combined with an upper limit on the mass of the BH in Ho II X-1 of - derived from timing properties, implies that Ho II X-1 behaves in an analogous manner to GRS 1915+105 in its -class. We speculate, by extension, that many of the ULXs in our sample that are well fitted by this spectral model could also be GRS 1915+105 analogues, i.e. stellar-mass BHs accreting at around and in excess of the Eddington limit. We note that if individual BHs with mass up to 80- can form from stellar processes as suggested by Belczynski et al. (2004), and these larger stellar-mass BHs exist in ULXs, then the factors by which the Eddington limit are exceeded need not be large for even the brighter ULXs (factors only). One piece of additional, encouraging evidence in this respect is that, similarly to Ho II X-1 and GRS 1915+105 in its analogous -class of behaviour, the light curves of the ULXs in this sample show little or no intrinsic variability on timescales of minutes to hours, with the fractional variability (in excess of counting noise) limited to per cent in all cases999Excepting the NGC 55 ULX, which shows prominent dips in its XMM-Newton light curve (Stobbart et al., 2004)..
Recently a second, very plausible explanation for our physically self-consistent spectral modelling has come to light. Done & Kubota (2005) describe spectral modelling of the Galactic BHB XTE J1550-564 in its high-luminosity VH state, using a model in which the energetics of the inner regions of the accretion disc are coupled to a surrounding corona. This results in a cooler apparent disc temperature, as the corona drains energy from the inner disc, and an optically-thick corona, that are both part of the accretion flow. Done & Kubota (2005) note that this may provide an explanation for the low disc temperatures observed in ULXs not reliant upon the presence of an IMBH. As we also provide evidence that the corona itself is indeed optically-thick in such sources, this model must constitute a very serious physical alternative to IMBHs for the majority of ULXs. However, even here there are caveats, for instance Feng & Kaaret (2005) note that optically-thick coronae should show deep Fe K absorption edges, unless the accreting material has a very low metallicity. We do not detect such features in our analysis.
Our empirical spectral fitting has posed new challenges for the IMBH model fits to ULX spectra, and our physical modelling describes scenarios in which the bulk of ULXs could be stellar-mass BHs accreting at around the Eddington limit. This is perhaps not surprising, as many strands of recent evidence have pointed away from an IMBH model for most ULXs. In fact, excepting the somewhat unique case for M82 X-1 as an IMBH, possibly formed in the dense MGG-11 cluster or captured as the nucleus of an accreted dwarf galaxy (e.g. Strohmayer & Mushotzky 2003; Portegies Zwart et al. 2004; King & Dehnen 2005; Mucciarelli et al. 2006), and the cool disc detections (shown to be somewhat ambiguous in this paper), observational results have tended to argue in the opposite sense. For example, the probable breaking of the Eddington limit seen in some - perhaps most (see Jonker & Nelemans 2004) - Galactic BHBs, and especially GRS 1915+105, argues that we cannot exclude stellar-mass BHs from producing ULXs on this trivial basis (McClintock & Remillard, 2003). Also, the shape of the universal X-ray Luminosity Function (XLF) for high-mass X-ray binaries, derived by Grimm et al. (2003), is somewhat puzzling if IMBHs constitute a significant part of the ULX population. In particular, why does the XLF appear to cut-off at ?101010A near identical cut-off is found from a large sample of ULXs studied by Swartz et al. (2004). Independent support for this cut-off comes from the empirical star formation rate relationship of Grimm et al. (2003), which can only have its linear form above yr-1 if the cut-off is real (see also Gilfanov et al. 2004). Surely no such cut-off would be present if - IMBHs constitute a large fraction of the ULX population (we are certainly unaware of any other source population that cuts off at Eddington rate). We therefore conclude that, on current evidence, it is unlikely that accreting IMBHs constitute a large proportion of the total ULX population.
7 Conclusions
We have conducted a detailed examination of the X-ray spectral shapes in a sample of the highest quality XMM-Newton EPIC ULX datasets available to us. Most notably, more than half of the ULXs show at least marginal evidence for curvature in their 2–10 keV spectra, which is somewhat unexpected if they are to be interpreted as the accreting - IMBHs suggested by modelling the soft spectral components as accretion discs. Physical modelling shows that this curvature is likely to originate in optically-thick coronae, which in turn leads to interpretations of the ULXs in terms of high accretion-rate stellar-mass (or slightly larger) BHs operating at around the Eddington limit. However, while we conclude that it is likely that the general ULX population does not have a large contribution from IMBHs, we obviously cannot rule out the possibility that some ULXs do possess IMBHs. Perhaps the best candidate on the basis of our spectral fitting is M81 X-9, which is well fitted by cool disc plus power-law/optically-thin corona models, and does not show explicit curvature in its 2–10 keV spectrum, though even this ULX may be fitted using a hot ( keV) accretion disc plus soft excess model. Clearly, it is difficult to find unique solutions for these sources even with high quality XMM-Newton EPIC data. Ultimately, we may perhaps have to wait for radial velocity measurements from the optical counterpart of an ULX, leading to dynamical mass measurements of the compact accretor, before we have conclusive evidence whether any individual ULX does harbour an IMBH.
Acknowledgments
We thank an anonymous referee for their help in improving this paper. AMS and TPR gratefully acknowledge funding from PPARC. We thank Mike Goad for allowing us access to the Ho II X-1 data while still proprietary, and for providing helpful comments on this manuscript. This work is based on observations obtained with XMM-Newton an ESA Science Mission with instruments and contributions directly funded by ESA member states and the USA (National Aeronautics and Space Administration).
References
- Anders & Grevesse (1989) Anders E., Grevesse N., 1989, GeCoA, 53, 197
- Balucinska-Church & McCammon (1992) Balucinska-Church M., McCammon D., 1992, ApJ, 400, 699
- Begelman (2002) Begelman M. C., 2002, ApJ, 568, L97
- Belczynski et al. (2004) Belczynski K., Sadowski A., Rasio F.A., 2004, ApJ, 611, 1068
- Belloni et al. (1999) Belloni T., Méndez M., van der Klis M., Lewin W. H. G., Dieters S., 1999, ApJ, 519, L159
- Colbert & Mushotzky (1999) Colbert E. J. M., Mushotzky R. F., 1999, ApJ, 519, 89
- Colbert & Ptak (2002) Colbert E. J. M., Ptak A. F., 2002, ApJS, 143, 25
- Colbert et al. (1995) Colbert E. J. M., Petre R., Schlegel E. M., Ryder S. D., 1995, ApJ, 446, 177
- Coppi (1999) Coppi P. S., 1999, ASPC, 161, 375
- Cropper et al. (2004) Cropper M., Soria R., Mushotzky R. F., Wu K., Markwardt C. B., Pakull M., 2004, MNRAS, 349, 39
- Crummy et al. (2006) Crummy J., Fabian A.C., Gallo L., Ross R.R., 2006, MNRAS, 365, 1067
- Dewangan et al. (2004) Dewangan G. C., Miyaji T., Griffiths R. E., Lehmann I., 2004, ApJ, 608, L57
- Dickey & Lockman (1990) Dickey J. M., Lockman F. J., 1990, ARA&A, 28, 215
- Done & Gierliński (2005) Done C., Gierliński M., 2005, MNRAS, 364, 208
- Done & Kubota (2005) Done C., Kubota A., 2005, MNRAS, submitted (astro-ph/0511030)
- Ebisawa et al. (2003) Ebisawa K., Życki P., Kubota A., Mizuno T., Watarai K., 2003, ApJ, 597, 780
- Ehle et al. (1998) Ehle M., Pietsch W., Beck R., Klein U., 1998, A&A, 329, 39
- Fabbiano (1988) Fabbiano G., 1988, ApJ, 325, 544
- Fabbiano (1989) Fabbiano G., 1989, ARA&A, 27, 87
- Falcke & Biermann (1995) Falcke H., Biermann P. L., 1995, A&A, 293, 665
- Feng & Kaaret (2005) Feng H., Kaaret P., 2005, ApJ, 633, 1052
- Foschini et al. (2004) Foschini, L., Rodriguez, J., Fuchs, Y., Ho, L. C., Dadina, M., Di Cocco, G., Courvoisier, T. J.-L., & Malaguti, G. 2004, A&A, 416, 529
- Fryer & Kalogera (2001) Fryer C.L., Kalogera V., 2001, ApJ, 554, 548
- Gao et al. (2003) Gao Y., Wang Q. D., Appleton P. N., Lucas R. A., 2003, ApJ, 596, L171
- Gierliński et al. (1999) Gierliński M., Zdziarski A. A., Poutanen J., Coppi P. S., Ebisawa K., Johnson W. N., 1999, MNRAS, 309, 496
- Gilfanov et al. (2004) Gilfanov M., Grimm H.-J., Sunyaev R., 2004, NuPhS, 132, 369
- Goad et al. (2002) Goad M. R., Roberts T. P., Knigge C., Lira P., 2002, MNRAS, 335, L67
- Goad et al. (2006) Goad M. R., Roberts T. P., Reeves J., Uttley P., 2006, MNRAS, 365, 191
- Grimm et al. (2003) Grimm H.-J., Gilfanov M., Sunyaev R., 2003, MNRAS, 339, 793
- Haardt et al. (2001) Haardt F., et al., 2001, ApJS, 133, 187
- Ho et al. (1997) Ho L. C., Filippenko A. V., Sargent W. L. W., 1997, ApJS, 112, 315
- Immler et al. (1999) Immler S., Vogler A., Ehle M., Pietsch W., 1999, A&A, 352, 415
- Immler & Wang (2001) Immler S., Wang Q. D., 2001, ApJ, 554, 202
- Jonker & Nelemans (2004) Jonker P.G., Nelemans G., 2004, MNRAS, 354, 355
- Kaaret et al. (2003) Kaaret P., Corbel S., Prestwich A. H., Zezas A., 2003, Science, 299, 365
- Kaaret et al. (2004) Kaaret P., Ward M. J., Zezas A., 2004, MNRAS, 351, L83
- Karachentsev et al. (2003) Karachentsev I. D. et al., 2003, A&A, 404, 93
- King (2004) King A. R., 2004, MNRAS, 347, L18
- King et al. (2001) King A. R., Davies M. B., Ward M. J., Fabbiano G., Elvis M., 2001, ApJ, 552, L109
- King & Dehnen (2005) King A.R., Dehnen W., 2005, MNRAS, 357, 275
- King & Pounds (2003) King A. R., Pounds K. A., 2003, MNRAS, 345, 657
- Körding et al. (2002) Körding E., Falcke H., Markoff S., 2002, A&A, 382, L13
- Körding et al. (2005) Körding E., Colbert E., Falcke H., 2005, A&A, 436, 427
- Krolik (2004) Krolik J. H., 2004, ApJ, 615, 383
- Lira et al. (2000) Lira P., Lawrence A., Johnson R. A., 2000, MNRAS, 319, 17
- Liu at al. (2004) Liu J., Bregman J. N., Seitzer P., 2004, ApJ, 602, 249
- Liu & Bregman (2005) Liu J., Bregman J. N., 2005, ApJS, 157, 59
- Makishima et al. (1986) Makishima K., Maejima Y., Mitsuda K., Bradt H. V., Remillard R. A., Tuohy I. R., Hoshi R., Nakagawa M., 1986, ApJ, 308, 635
- Makishima et al. (2000) Makishima K., et al., 2000, ApJ, 535, 632
- Markert & Rallis (1983) Markert T. H., Rallis A. D., 1983, ApJ, 275, 571
- Markoff et al. (2001) Markoff S., Falcke H., Fender R., 2001, A&A, 372, L25
- Markoff et al. (2005) Markoff S., Nowak M.A., Wilms J., 2005, ApJ, 635, 1203
- Martocchia et al. (2005) Martocchia A., Matt G., Belloni T., Feroci M., Karas V., Ponti G., 2005, A&A, in press (astro-ph/0510651)
- McClintock et al. (2001) McClintock J. E., et al., 2001, ApJ, 555, 477
- McClintock & Remillard (2003) McClintock J. E., Remillard R. A., 2003, in Lewin W. H. G., van der Klis M., eds, Compact Stellar X-ray Sources. Cambridge Univ. Press, Cambridge, in press (astro-ph/0306213)
- Miller et al. (2003) Miller J. M., Fabbiano G., Miller M. C., Fabian A. C., 2003, ApJ, 585, L37
- Miller et al. (2004a) Miller J. M., Fabian A. C., Miller M. C., 2004a, ApJ, 607, 931
- Miller et al. (2004b) Miller J. M., Fabian A. C., Miller M. C., 2004b, ApJ, 614, L117
- Miller & Colbert (2004) Miller M. C., Colbert E. J. M., 2004, IJMPD, 13, 1
- Misra et al. (1998) Misra R., Chitnis V. R., Melia F., 1998, ApJ, 495, 407
- Mitsuda et al. (1984) Mitsuda K., et al., 1984, PASJ, 36, 741
- Miyaji et al. (2001) Miyaji T., Lehmann I., Hasinger G., 2001, AJ, 121, 3041
- Mucciarelli et al. (2006) Mucciarelli P., Casella P., Belloni T., Zampieri L., Ranalli P., 2006, MNRAS, 365, 1123
- Nayakshin & Melia (1997) Nayakshin S., Melia F., 1997, ApJ, 490, L13
- Paturel et al. (2002) Paturel G., Theureau G., Fouqué P., Terry J. N., Musella I., Ekholm T., 2002, A&A, 383, 398
- Pietsch et al. (2004) Pietsch W., Mochejska B. J., Misanovic Z., Haberl F., Ehle M., Trinchieri G., 2004, A&A, 413, 879
- Portegies Zwart et al. (2004) Portegies Zwart S.F., Baumgardt H., Hut P., Makino J., McMillan S.L.W., 2004, Nature, 428, 724
- Radecke (1997) Radecke H.-D., 1997, A&A, 319, 18
- Ramsey et al. (2006) Ramsey C.J., Williams R.M., Gruendl R.A., Chen C.-H.R., Chu Y.-H., Wang Q.D., 2006, ApJ, in press (astro-ph/0511540)
- Read et al. (1997) Read A. M., Ponman T. J., Strickland D. K., 1997, MNRAS, 286, 626
- Roberts & Warwick (2000) Roberts T. P., Warwick R. S., 2000, MNRAS, 315, 98
- Roberts et al. (2002) Roberts T. P., Warwick R. S., Ward M. J., Murray S. S., 2002, MNRAS, 337, 677
- Roberts & Colbert (2003) Roberts T. P., Colbert E. J. M., 2003, MNRAS, 341, L49
- Roberts et al. (2004) Roberts T. P., Warwick R. S., Ward M. J., Goad M. R., 2004, MNRAS, 349, 1193
- Roberts et al. (2005) Roberts T. P., Warwick R. S., Ward M. J., Goad M. R., Jenkins L. P., 2005, MNRAS, 357, 1363
- Schlegel et al. (2000) Schlegel E. M., Petre R., Colbert E. J. M., Miller S., 2000, AJ, 120, 2373
- Schlegel et al. (1997) Schlegel E. M., Barrett P., Singh K. P., 1997, AJ, 113, 1296
- Schlegel & Pannuti (2003) Schlegel E. M., Pannuti T. G., 2003, AJ, 125, 3025
- Shakura & Sunyaev (1973) Shakura N. I., Sunyaev R. A., 1973, A&A, 24, 337
- Schrader & Titarchuk (2003) Shrader C.R., Titarchuk L., 2003, ApJ, 598, 168
- Soria & Wu (2002) Soria R., Wu K., 2002, A&A, 384, 99
- Stobbart et al. (2004) Stobbart A.-M., Roberts T. P., Warwick R. S., 2004, MNRAS, 351, 1063
- Strickland et al. (2001) Strickland D. K., Colbert E. J. M., Heckman T. M., Weaver K. A., Dahlem M., Stevens I. R., 2001, ApJ, 560, 707
- Strohmayer & Mushotzky (2003) Strohmayer T.E., Mushotzky R.F., 2003, ApJ, 568, L61
- Strüder et al. (2001) Strüder L. et al., 2001, A&A, 365, L18
- Swartz et al. (2004) Swartz D.A., Ghosh K.K., Tennant A.F., Wu K., 2004, ApJS, 154, 519
- Terashima & Wilson (2004) Terashima Y., Wilson A. S., 2004, ApJ, 601, 735
- Trinchieri et al. (1985) Trinchieri G., Fabbiano G., Paulumbo G. G. C., 1985, ApJ, 290, 96
- Tully (1988) Tully R. B., 1988, Nearby Galaxies Catalog (Cambridge University Press, Cambridge)
- Turner et al. (2001) Turner M. J. L. et al., 2001, A&A, 365, L27
- van der Klis (1995) van der Klis M., 1995, in X-ray binaries, ed. W. H. G. Lewin, J. van Paradijs, & E. P. J. van den Heuvel (Cambridge: Cambridge University Press), 252
- Vaughan et al. (2005) Vaughan S., Iwasawa K., Fabian A. C.,Hayashida K., 2005, MNRAS, 356, 524
- Vogler et al. (1997) Vogler A., Pietsch W., Bertoldi F., 1997, A&A, 318, 768
- Wang et al. (2004) Wang Q. D., Yao Y., Fukui W., Zhang S. N., Williams R., 2004, ApJ, 609, 113
- Wilms et al. (1999) Wilms J., Nowak M. A., Dove J. B., Fender R. P., di Matteo T., 1999, ApJ, 522, 460
- Zampieri et al. (2004) Zampieri L., Mucciarelli P., Falomo R., Kaaret P., Di Stefano R., Turolla R., Chieregato M., Treves A., 2004, ApJ, 603, 523
- Zhang et al. (2000) Zhang S. N., Cui W., Chen W., Yao Y., Zhang X., Sun X., Wu X., Xu H., 2000, Sci, 287, 1239
- Zezas et al. (2002a) Zezas A., Fabbiano G., Rots A. H., Murray S. S., 2002a, ApJS, 142, 239
- Zezas et al. (2002b) Zezas A., Fabbiano G., Rots A. H., Murray S. S., 2002b, ApJ, 577, 710