Near-infrared observations of water-ice in OH/IR stars
A search for the near-infrared water-ice absorption band was made in a number of very red OH/IR stars which are known to exhibit the 10m silicate absorption. As a by-product, accurate positions of these highly reddened objects are obtained. We derived a dust mass loss rate for each object by modelling the spectral energy distribution and the gas mass loss rate by solving the equation of motion for the dust drag wind. The derived mass loss rates show a strong correlation with the silicate optical depth as well as that of the water-ice. The stars have a high mass loss rate ( M⊙ yr-1) with an average gas-to-dust mass ratio of 110. In objects which show the 3.1m water-ice absorption, the near-IR slope is much steeper than those with no water-ice. Comparison between our calculated mass loss rates and those derived from OH and CO observations indicates that these stars have recently increased their mass loss rates.
Key Words.:
Stars: AGB and post-AGB – Stars: circumstellar matter – Stars: evolution – Stars: late-type – Stars: mass-loss – Infrared: stars1 Introduction
In order to estimate the dust mass loss rate in O-rich Asymptotic Giant Branch (AGB) stars, it is common to use the strength of the 10m silicate emission. There seems to be a direct correlation between the 10m excess emission and the derived mass loss rate estimated by CO (Skinner & Whitmore skinner (1998)). However, this does not apply when the silicate feature becomes self-absorbed or in absorption as mass loss rate increases. On the contrary, it has been known that extreme OH/IR stars with strong silicate absorption show a very weak CO line strength which indicates low derived gas mass loss rate (Heske et al. heske (1990)). Justtanont et al. (kay96 (1996)) investigated one such star, OH26.5+0.6 and found that the discrepancy can be explained by the fact that the star has recently undergone a superwind where the mass loss rate increases by two orders of magnitude. The low rotational transitions of CO mainly trace the cool gas mass loss rate in the outer part of the envelope, which has not been affected by this mass loss increase. The interferometric CO J=1-0 map using BIMA confirms the envelope size is marginally resolved (Fong et al. fong (2002)), consistent with a compact CO envelope due to the superwind.
Accompanied by the deep 10m silicate absorption, the near-infrared spectrum of some extreme OH/IR stars shows the absorption at 3.1m due to water-ice. Meyer et al. (meyer (1998)) suggested a correlation between the mass loss rate and the column density of water-ice in a few sample of stars observed. So far, there has not been a systematic search for the 3.1m absorption in these stars as a long integration is needed in order to detect the absorption band when the infrared flux is already very low. A medium resolution spectrum is needed in order to discriminate between the type of ice condensed, i.e., amorphous or crystalline. Maldoni et al. (maldoni (2003)) suggested a significant fraction of water-ice in crystalline form condensed in the outflow of OH32.8-0.3. The crystalline ice has sharp features at 3.1, 44 and 62m, the latter two were first detected by the observation by the Kuiper Airborne Observatory (Omont et al. omont (1990)). The libration band at 12m is more difficult to discern due to the fact that it blends with the strong silicate absorption. Observations of OH/IR stars using the Infrared Space Observatory (ISO) Short- and Long Wavelength Spectrometers (SWS and LWS) show that these stars exhibit signatures of crystalline silicate dust (e.g., Cami et al. cami (1998)), as well as water-ice (Sylvester et al. roger (1999)).
2 Observations
| Star | J(2000) | Flux (W mm-1) | ||||
|---|---|---|---|---|---|---|
| RA | Dec | K | L′ | w-H2O | n-H2O | |
| IRAS 18052-2016 | 18 08 16.38 | -20 16 11.5 | 4.58E-14 | 1.10E-12 | 8.19E-13 | 7.20E-13 |
| IRAS 18092-2347 | 18 12 16.97 | -23 47 06.1 | 1.40E-13 | 4.58E-13 | 4.81E-13 | 4.27E-13 |
| IRAS 18100-1915 | 18 13 03.07 | -19 14 19.0 | 5.85E-17 | 3.36E-14 | 1.40E-14 | 2.49E-15a |
| OH 16.1-0.3 | 18 21 07.11 | -15 03 24.5 | 3.65E-13 | 3.73E-15a | 1.47E-12 | 1.41E-12 |
| IRAS 18257-1052 | 18 28 30.96 | -10 50 48.5 | 4.32E-11 | 1.13E-13 | 1.55E-13 | 1.38E-13 |
| OH 21.5+0.5 | 18 28 30.94 | -09 58 14.6 | 1.16E-16a | 5.36E-13 | 9.27E-14 | 2.64E-14 |
| IRAS 18327-0715 | 18 35 29.22 | -07 13 10.9 | 2.20E-14 | 2.90E-12 | 1.44E-12 | 1.20E-12 |
| OH 26.5+0.6 | 18 37 32.51 | -05 23 59.2 | - | 6.85E-11 | 9.42E-12 | 7.05E-12 |
| IRAS 18361-0647 | 18 38 50.54 | -06 44 49.6 | 1.49E-15 | 2.11E-13 | 8.26E-14 | 5.47E-14 |
| OH 30.7+0.4 | 18 46 05.80 | -01 59 17.5 | 2.48E-14 | 1.50E-12 | 6.49E-13 | 5.73E-13 |
| OH 30.1-0.7 | 18 48 40.82 | -02 50 29.4 | 2.46E-17 | 4.60E-13 | 9.80E-14 | 2.93E-14 |
| IRAS 18488-0107 | 18 51 26.25 | -01 03 52.4 | 3.31E-16 | 1.82E-13 | 4.22E-14 | 1.49E-14 |
| OH 32.8-0.3 | 18 52 22.26 | -00 14 11.8 | 3.42E-16 | 1.66E-12 | 2.30E-13 | 3.74E-14 |
| IRAS 18588+0428 | 19 01 20.06 | +04 32 31.6 | 6.74E-14 | 1.80E-12 | 1.36E-12 | 1.23E-12 |
| OH 39.9-0.0 | 19 04 09.74 | +06 13 16.4 | 1.28E-14 | 1.41E-12 | 6.84E-13 | 5.70E-13 |
| IRAS 19067+0811 | 19 09 08.22 | +08 16 37.2 | 1.76E-15 | 5.94E-14 | 1.43E-14 | 1.05E-14 |
| IRAS 22177+5936 | 22 19 27.47 | +59 51 21.7 | 1.67E-12 | 2.17E-11 | 2.04E-11 | 3.04E-11 |
| a an upper limit flux | ||||||
A sample of OH/IR stars were selected based on the deep 10m silicate absorption, mainly from the IRAS low resolution spectra (LRS) and the OH maser observations by Sevenster (seven (2002)). Our observations were done using the Stockholm InfraRed CAmera (SIRCA) on the Nordic Optical Telescope (NOT) during July 22-23, 2003. We observed a total of 17 stars in the nodding and chopping mode. The stars were observed in the K, L′, narrow (m)- and wide-H2O-ice (m) bands. The central wavelength of the water-ice bands is at 3.07m. The field-of-view is relatively large, 1 by 1. Each star is flat fielded then flux calibrated using standard stars taken during the observation. A summary of the observations is given in Table 1.
Since we have images in several bands, it is a simple matter to identify the OH/IR stars and determine their positions with the aid of the 2MASS images. The images at the K band in our observations are compared to the published map. In some cases, a star is not visible in the K band so an interpolation of the positions of nearby stars was performed. Many of the fields show multiple point sources and with the aid of the L′ band, most can be distinguished as the OH/IR stars. For the field of star IRAS22177+5936, there is one very bright star which may be the target as the flux increases from K to L′ bands. The measured flux in the narrow band is greater than the wide band at 3m which is most likely due to the saturation problem. We maintain this star in our sample as we have CGS4 and archive ISO data. From the difference of the wide- and narrow-water-ice band fluxes, we put the detection limit of the water-ice at 20% of the difference over the wide-band flux. We chose this limit based on the star OH26.5+0.6 which was shown to have water-ice absorption at 3.1m (Meyer et al. meyer (1998)).
As a complement to our data set, earlier observations of six OH/IR stars done at the 3.8-metre UKIRT, using the Cooled Grating Spectrometer (CGS4) in August 1999 are included to enlarge the SIRCA sample. Some of the stars overlap with the SIRCA sample (Table 2). For most stars, we have a spectral coverage between 2 to 4m, punctuated by the earth’s atmospheric absorption. The spectra were wavelength calibrated using arc spectra and then flux calibrated with standard stars. The absolute flux level is further adjusted to coincide with known photometry from either published data or SIRCA observations. This procedure is done simply because the positions of these stars were not well known and the flux in the K band is very low. Some stars are mispointed by several arcsec which means the flux level can be much lower than expected. This can be seen by comparing the coordinates of stars which are observed by both SIRCA and CGS4. Also, these stars are known to be variable with a period of up to 1 000 days.
| RA(2000) | DEC(2000) | |
|---|---|---|
| AFGL 5379 | 17 44 23.9 | -31 55 39.4 |
| OH 13.1+5.0 | 17 55 45.1 | -15 03 43.1 |
| OH 16.1-0.3 | 18 21 06.9 | -15 03 20.9 |
| OH 21.5+0.5 | 18 28 31.8 | -09 58 30.0 |
| IRAS 18310-2834 | 18 34 13.7 | -28 32 21.4 |
| OH 30.1-0.7 | 18 48 42.0 | -02 50 36.5 |
| OH 39.9-0.0 | 19 04 09.8 | +06 13 16.3 |
| OH 51.8-0.2 | 19 27 41.9 | +16 37 23.3 |
| OH 65.7-0.8 | 19 59 39.1 | +28 23 07.2 |
| OH 75.3-1.8 | 20 29 08.5 | +35 45 43.8 |
| IRAS 22177+5936 | 22 19 27.3 | +59 51 22.3 |
3 Determination of mass loss rates
In order to derive the dust mass loss rate from our sample stars, a model fit to the spectral energy distribution (SED) of individual star is performed. This, in turn, is used to calculate the total mass loss rate assuming the momentum driven wind.
3.1 Dust mass loss rates
We derive the dust mass loss rate by fitting the SED for each star (Justtanont & Tielens kay92 (1992)). We extracted IRAS LRS spectra which cover the wavelength range between 7 to 24m, along with the photometry from the point source catalogue. Where available, we also extracted archived ISO-SWS spectra. These complementary data are crucial in the modelling as the major dust component is silicates which have absorption features in the 10m window.
The radiative transfer calculation used to model the stars is based on the work by Haisch (haisch (1979)). It assumes a spherically symmetric outflow, with a constant mass loss rate and outflow velocity. The thermal emission and scattering is calculated at a specified radial grid point and the emergent flux and the temperature profile of the dust calculated. We assume a grain size distribution for the dust to be the same as that of the interstellar medium (Mathis et al. mrn (1977)). As the distance to these stars are unknown, we assume a luminosity of 104L⊙ and vary the distance until the overall spectrum fits.
We use two different grain models to fit our SED in the envelope which shows water-ice absorption, namely, pure silicate grains and silicate core-water ice mantle. The dust parameters used to fit the absorption features are silicates based on OH26.5+0.6 model by Justtanont et al. (kay96 (1996)) and crystalline water-ice from Schmitt et al. (schmitt (1998)). We select the crystalline form of water-ice because there is evidence that the grains condensed in such an outflow show sharp structure at 3.1m (Maldoni et al. maldoni (2003)) and on the bases of the far-IR features due to crystalline water-ice in the ISO spectra (e.g., Sylvester et al. roger (1999); Dijkstra et al. 2003b ) The inner radius of dust shell is set to a point where the temperature is below the amorphous silicate condensation temperature of 1 000 K while the silicate core-ice mantle grains have a maximum temperature of 100 K, i.e., the temperature which water-ice condenses onto existing silicate grains. The terminal velocity of the outflow of each star is well determined by either CO rotational line or via OH maser observations (see Table 3).
| D | ||||||
|---|---|---|---|---|---|---|
| (km s-1) | (kpc) | (M⊙ yr-1) | (M⊙ yr-1) | |||
| IRAS 18052 | 28.5a | 4.33 | 2.2E-6 | 18.26 | 1.1E-4 | 3.03 |
| IRAS 18092 | 17.0a | 6.10 | 9.3E-7 | 12.35 | 1.1E-4 | 2.05 |
| IRAS 18100 | 13.6a | 7.50 | 1.5E-6 | 17.71 | 2.1E-4 | 4.01 |
| OH 16.1 | 21.0a | 1.90 | 3.5E-6 | 32.40 | 2.9E-4 | 5.37 |
| IRAS 18257 | 18.2a | 6.00 | 1.4E-6 | 16.18 | 1.5E-4 | 2.68 |
| OH 21.5 | 18.1a | 2.50 | 2.8E-6 | 29.71 | 2.6E-4 | 6.14 |
| IRAS 18327 | 19.3a | 3.00 | 1.2E-6 | 13.48 | 1.2E-4 | 2.72 |
| OH 26.5 | 15.0a | 1.37 | 2.3E-6 | 23.55 | 2.6E-4 | 4.27 |
| IRAS 18361 | 15.9a | 6.00 | 1.4E-6 | 15.71 | 1.7E-4 | 3.69 |
| OH 30.7 | 17.0a | 3.70 | 2.3E-6 | 27.31 | 2.6E-4 | 4.99 |
| OH 30.1 | 18.1a | 1.75 | 2.2E-6 | 18.31 | 2.2E-4 | 4.08 |
| IRAS 18488 | 19.3a | 3.90 | 4.1E-6 | 37.19 | 3.6E-4 | 7.72 |
| OH 32.8 | 17.7a | 4.30 | 2.8E-6 | 24.84 | 3.1E-4 | 5.50 |
| IRAS 18588 | 21.5a | 5.30 | 1.4E-6 | 14.01 | 1.3E-4 | 2.32 |
| OH 39.9 | 14.7a | 5.00 | 1.1E-6 | 17.07 | 1.6E-4 | 2.83 |
| IRAS 19067 | 16.3b | 3.80 | 2.6E-6 | 27.89 | 2.7E-4 | 5.09 |
| IRAS 22177 | 18.3c | 2.10 | 1.2E-6 | 14.72 | 1.3E-4 | 2.87 |
| AFGL 5379 | 18.3a | 0.58 | 2.0E-6 | 18.58 | 2.0E-4 | 3.93 |
| OH 13.1 | 14.5d | 6.60 | 1.8E-6 | 25.86 | 2.4E-4 | 4.29 |
| IRAS 18310 | 15.1b | 6.60 | 1.8E-6 | 24.24 | 2.4E-4 | 4.02 |
| OH 51.8 | 18.6b | 5.00 | 1.7E-6 | 19.35 | 1.8E-4 | 3.21 |
| OH 65.7 | 10.8b | 5.00 | 1.8E-6 | 30.90 | 3.2E-4 | 5.12 |
| OH 75.3 | 11.6b | 5.00 | 1.8E-6 | 30.03 | 3.0E-4 | 4.98 |
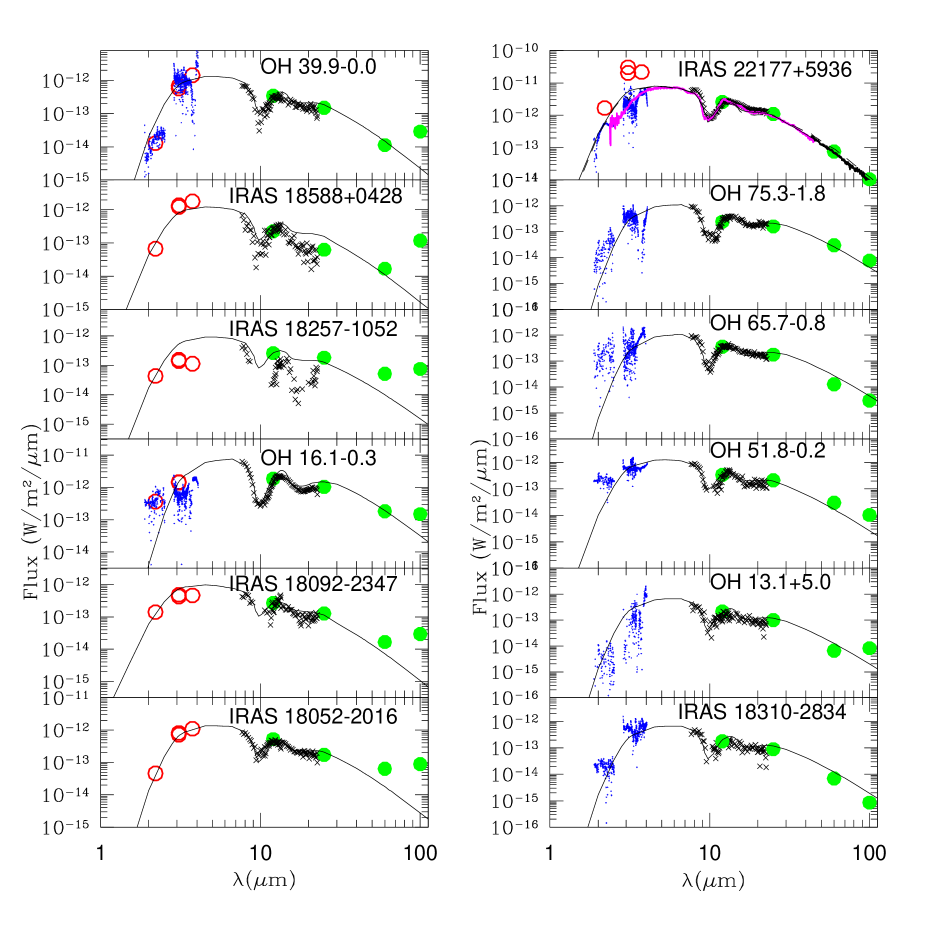
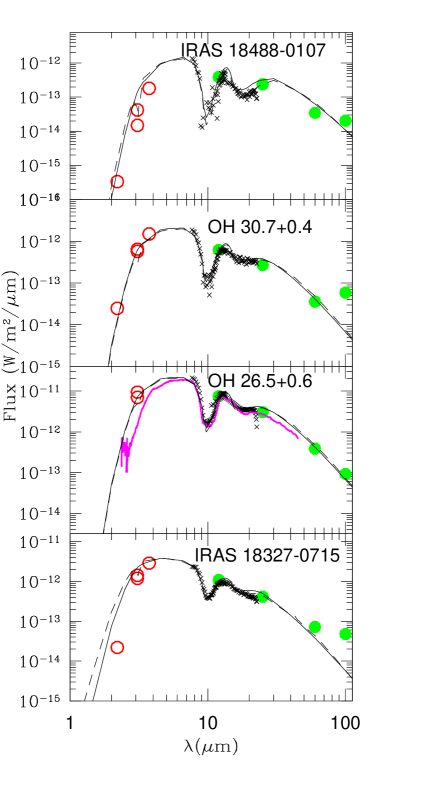
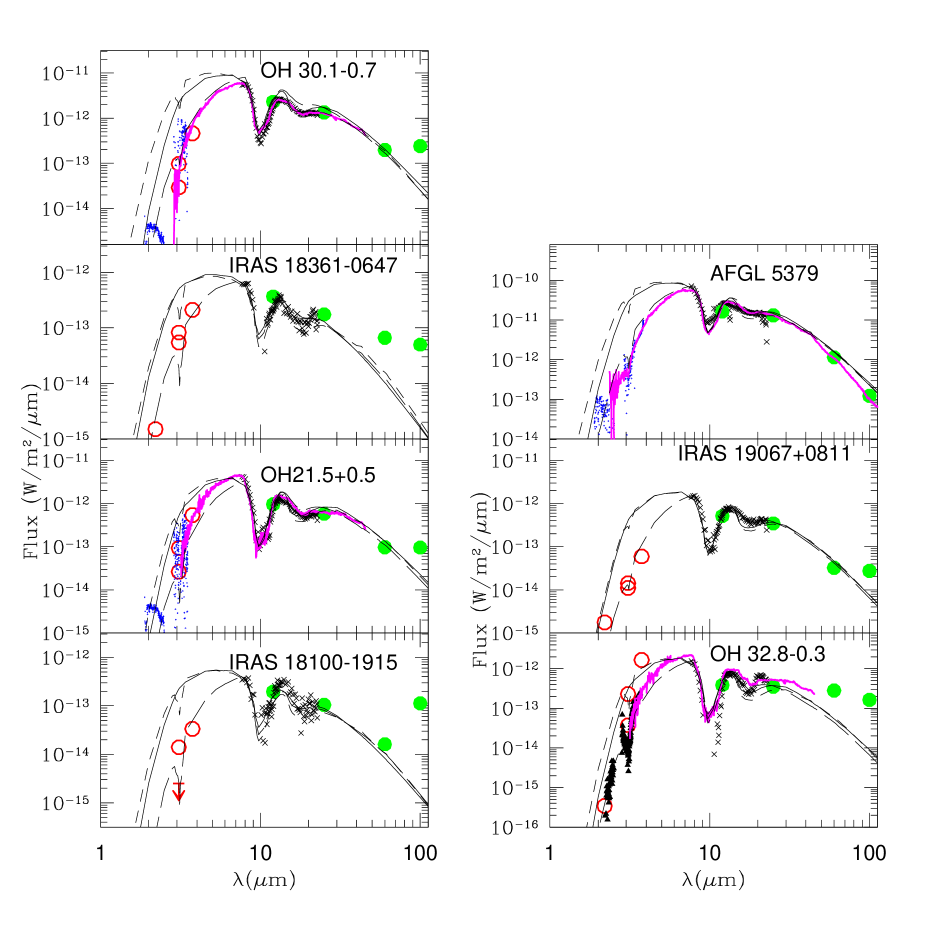
Figs. 1, 2 and 3 show the model fits to individual objects. Half of our sample of extreme OH/IR stars do not show convincing evidence for the water-ice absorption, despite the fact that the mass loss rate is very high. The derived mass loss rate and other parameters are listed in Table 3. The range of the dust mass loss rate of these extreme OH/IR stars are between (1-4) 10-6 M⊙ yr-1. In deriving the dust mass loss rate, we assume a constant dust velocity for all the grain sizes. Although this is the case for the smallest dust grains, the drift velocity for the largest size (0.25m in our model) can be up to 3 km s-1. We address this issue of the dust velocity and how it affects the mass loss rate estimate in the next section.
3.2 The dynamical mass loss rate
In order to determine the total mass loss rate from a star, we used the derived dust mass loss rate and assume that the radiation pressure on the dust grains is the main driving force of the circumstellar wind. The dust momentum is transferred to the gas and knowing the terminal velocity of the gas for each star, we can calculate the dynamical mass loss rate (Goldreich & Scoville goldreich (1976)). The only unknown in solving the equation of motion is the mass of the star. We assume that the progenitor stars of these extreme OH/IR stars are more massive than the hot bottom burning limit of 4 M⊙, otherwise they would end up as C-rich AGB stars. We assigned an arbitrary mass of 5 M⊙ for all our stars. However, this parameter has a very small effect on the derived mass loss rate. A change from a 1 to 5 M⊙ gravitational potential resulted in a decrease in the derived mass loss rate of 30%. We also calculated the dust velocity and fed it back to the calculation for the SED hence the value of the dust mass loss rate in Table 3 is consistent with the calculated dust velocity for the largest grain size.
The main uncertainty in the derived dust and dynamical mass loss rates lie in the estimate of the distance to the star. In many cases, this is not known and the distance was estimated by assuming the stellar luminosity of 104 L⊙. It was shown that semiregular variables have a mean luminosity of 4 200L⊙ (Olofsson et al. hans02 (2002)) and OH/IR stars are the more luminous counter part of these stars. An error in the distance estimate reflects directly the error in the mass loss rate. Fortunately, there is a direct scale between the mass loss rate and the distance, i.e., /D is constant in order to fit the same spectrum. Our derived total mass loss rates for these objects are very high, a few 10-4 M⊙ yr-1, i.e., they are in a superwind phase. Such a high rate can be sustained by the high-mass end of the intermediate mass stars for only a relatively short period ( yr). From our calculation, the gas-to-dust mass ratio ranges from 50 to 180, with a mean value of 110. This is in agreement with the value of 160 from Knapp (knapp (1985)).
3.3 Correlation with the optical depths
From fitting the SED to the observations, we divide our sample into two main categories. The first group contains stars which do not show the ice absorption at 3.1m (Fig. 1). We modelled these stars using pure silicate grains. The second group of stars do show ice absorption from SIRCA and/or CGS4 observations. Their SEDs can be described by the two components of dust, i.e., warm inner silicate grains and composite grains where the temperature drops below 100 K. This group can be further subdivided into those which are well fitted by the same silicate grains used for group 1 (Fig. 2), and those which show near-IR deficiency compared to the model (Fig. 3). For simplicity, we refer to groups 1, 2a and 2b. Due to the lack of near-IR spectrum of the stars in group 2a, we cannot firmly conclude whether the silicate dust for these stars should be different from group 2b. We will discuss this point on the following section.
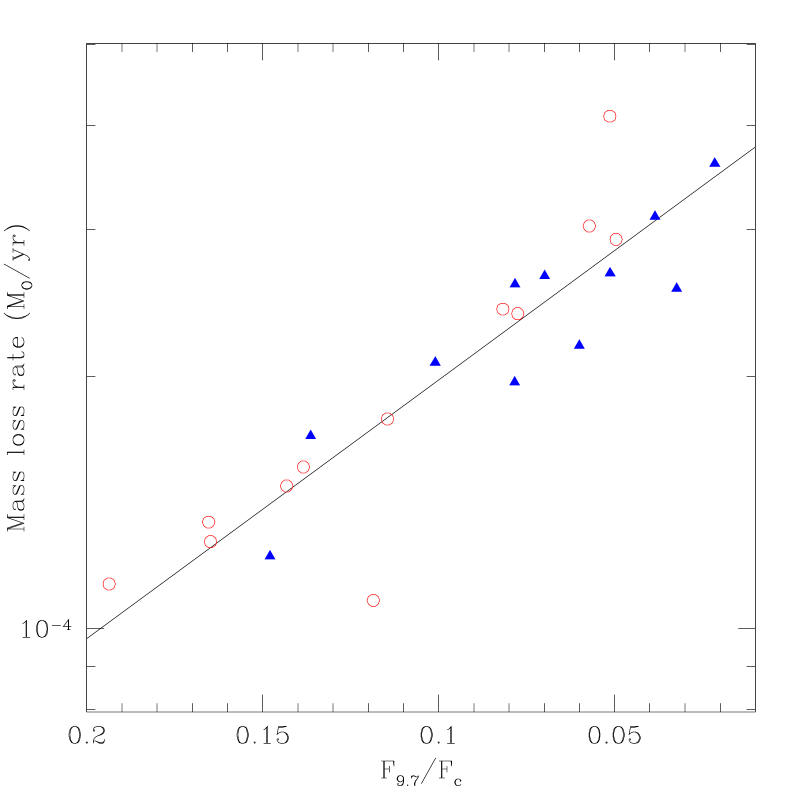
We find a strong correlation between the derived mass loss rate and the depth of the 9.7m feature (Fig 4). We assume here that the interstellar contribution is negligible compared to the circumstellar contribution. The dependence is not surprising as the depth of the silicate feature is a direct measure of the amount of dust along the line of sight. The relationship between the measurable depth, simply the ratio of the flux at the bottom of the silicate feature and the continuum over the feature at the same wavelength can be expressed as
| (1) |
Here, we defined a continuum flux at 9.7m as a linear interpolation of the fluxes between wavelength of 8 and 12m over the silicate absorption feature. The uncertainty of the relationship is a factor of 0.2 on the log scale (3) which translates to a factor of 1.6 in the mass loss rate. A similar relationship between mass loss rate and the strength of the silicate feature has been shown to be the case for optically thin AGB stars and supergiants using the silicate emission (Skinner & Whitmore skinner (1998)). Our derived relation simply extends the estimation of the mass loss rate into the very optically thick regime, i.e., M⊙ yr-1.
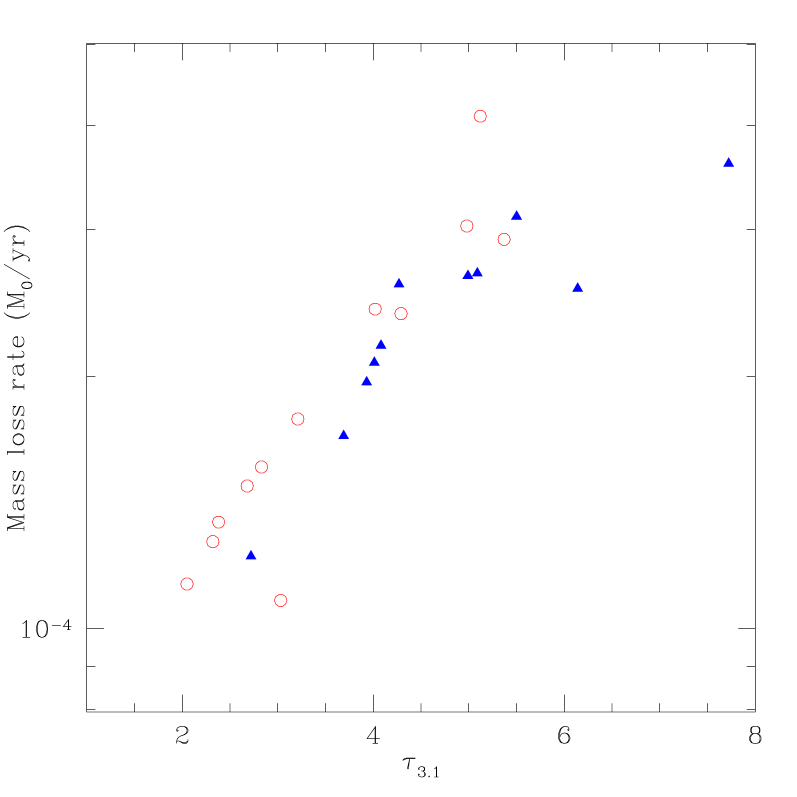
In Fig. 5, we show the plot of the derived mass loss rate and the derived optical depth at 3.1m, from the SED fitting. Note that the value of the optical depth in Table 3 is the total optical depth due to both the pure silicate grains and silicate core-ice mantle grains hence the values are relatively high. The correlation is very strong, regardless of whether the star shows the ice absorption band. We find the same fit even if the stars in group 1 (those with no water-ice) are not taken into account. This confirms the correlation seen earlier by Meyer et al. (meyer (1998)) for a smaller sample of star. They stipulated a direct trend that a star with a high mass loss rate shows deeper ice absorption and hence higher column density of water-ice. It is somewhat interesting that stars in group 1 also show the same trend of higher with the mass loss rate. This reflects the very high silicate dust absorption efficiency without invoking other dust type. Note here that the optical depth in table 3 and Fig. 5 is the total optical depth integrated along the line-of-sight and includes the contribution of both silicate and water-ice. Most of the opacity is due to the warm silicate dust which rises with decreasing wavelength hence giving the correlation seen for group 1 stars. As can be seen in Fig. 5, not all stars with very thick circumstellar shell show evidence of ice formation. There is also a slight hint that the relationship may taper off towards higher optical depth and mass loss rate.
3.4 Ice condensation
It seems that even though the condition for ice formation is a highly optically thick envelope (high density) so water-ice can be shielded from the central stellar radiation field (low temperature), not all the stars in our sample show the ice absorption band at 3.1m. From simply knowing the mass loss rate, it is not possible to predict which star has the icy mantle grains. However, it is true that for those which have water-ice signature, the mass loss rate correlates with the optical depth, and hence the ice column density, , at 3.1m via (d’Hendecourt & Allamandola louis (1986))
| (2) |
where and A are the full-width-half maximum and the absorbance of the water-ice band at 3.1m, respectively.
It is a puzzle why some stars form water-ice and not others. One possible explanation is the water vapour abundance in the photosphere and circumstellar envelope. We therefore investigate the existing spectra of these stars. It is unfortunate that the near-IR spectra of the sample stars are not good enough to see the stretching bands of water at 3m from the available ISO-SWS data as the signal-to-noise ratio in these spectra is very low. The bending band around 6m were then checked to see whether there are corresponding lines. In this region, there are expected to be strong lines which are sensitive to the temperature of the gas, i.e., at 6.59, 6.63 and 6.83m.
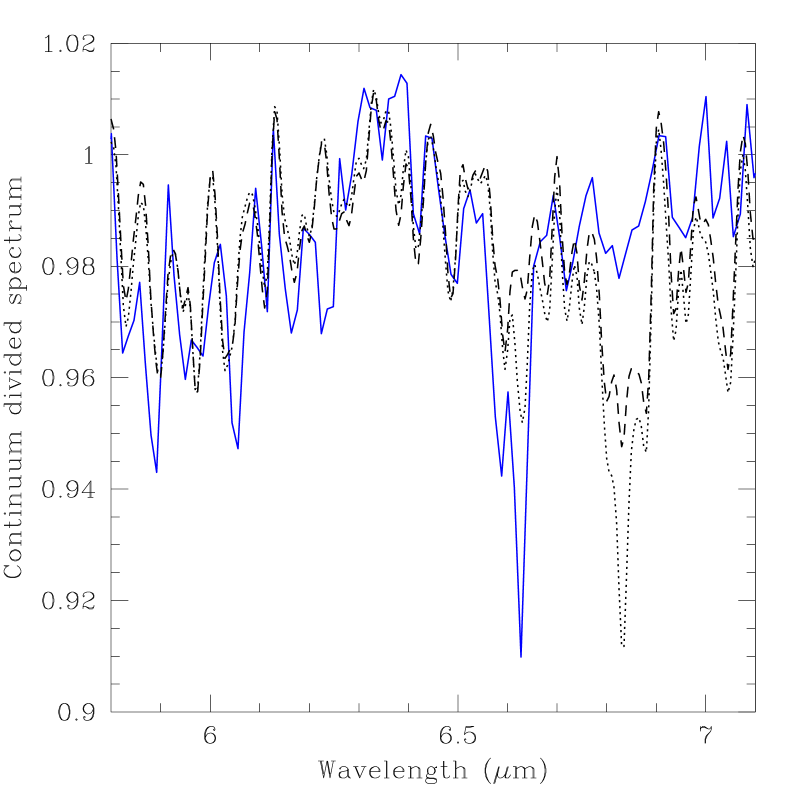
The ratio of the first two lines are a good temperature indicator (Fig. 6).These lines are seen in the continuum divided spectra of the sample. The ratio indicates a temperature in excess of 500K. However, the expected strong feature at 6.83m is not distinctly detected, pointing to a lower (T300K) temperature gas. Other weaker features cannot be confirmed so the detection of gaseous water remains tentative. The overlap between our sample and the SWS spectra happens to be those stars which show water-ice signature. The lack of the detection of water vapour lines may not be surprising taking into account that much of the available water freezes out onto grains. In this scenario, gaseous water does not provide a significant opacity source in the near-IR.
In order for water-ice to condense, the density has to be high and the grains must be cool enough for the water to condense onto the existing silicate grains. This requires that the dense circumstellar envelope has to be of an order of a few 1016 cm as the dust temperature falls off as , according to our radiative transfer calculation. This is in accord with the calculation by Dijkstra et al. (2003a ) who estimated the radius of the water-ice condensation zone started from around (1-2) 103 AU, the exact distance depending on dust grain radius. However, we are not able to measure the radius of the superwind and it is possible that in some of the stars, the onset of the superwind is very recent that the outer edge of the shell has no time to cool down below the water-ice condensation temperature. In such a case, we do not expect to detect the 3.1m absorption.
4 Near-IR opacity in icy envelopes
It is clear that in stars with a clear signature of water-ice absorption in the envelope (group 2b), the near-IR is suppressed compared to those with a small amount of (group 2a), or no (group 1), water-ice. The spectrum shortward of 5m cannot be explained by the presence of the same type of silicate or the water-ice. In fitting the spectrum of these stars, an adhoc near-IR opacity is included in the silicate grains (see Fig 3). As we did not see a clear evidence for the gaseous water in the spectra of these objects, we search for an explanation in terms of dusty components to provide the needed opacity.
It is known that very optically thick envelopes around extreme OH/IR stars exhibit crystalline silicate feature in the far-IR (e.g., Cami et al., cami (1998)). However, the near-IR opacity of the crystalline silicate is much lower than that of the amorphous grains (Koike et al., koike (1993)). This option cannot then be used to explain the near-IR deficiency seen.
Kemper et al. (kemper (2002)) reported on an extreme OH/IR star, OH127.8+0.0, which also has a near-IR deficiency. Although this star show an evidence for water-ice in its spectrum, simply including it in the modelling could not explain the observed deficiency. They, instead, proposed metallic iron as being the absorber in order to fit the observed spectrum. It remains curious that the lack of near-IR flux is seen to be accompanied by the water-ice absorption, as is the case in our sample stars. It is possible that when the water-ice condensed onto the silicate grains, some other materials are incorporated in the matrix leading to the extra absorption in the near-IR. However, the link between the condensation of water-ice and iron grains is unclear, if the extra opacity in the near-IR is due to iron dust. Thermodynamically, the two are not linked due to the difference in the condensation temperatures. Iron is expected condense close to the central star (Gail & Sedlmayr gail (1986)). By removing iron from the gas phase, it naturally leads to the explanation of magnesium-rich silicate grains. Many OH/IR stars have been found to have the signature of fosterite, a pure Mg-silicate (Waters & Molster rens (1999)). Although it is viable that the near-IR opacity is due to iron, it remains to be seen why iron condenses out (close to the star) at the same time water-ice condenses onto cold silicate grains farther out.
Alternatively, this could simply be due to the way these objects are viewed. It is possible that these stars have a disk which is where the water-ice resides. When this disk is along the line of sight (edge-on disk), the absorption is at its maximum and hence the the near-IR radiation is more efficiently absorbed by the disk while stars which the disk is perpendicular to the line-of-sight will show much less absorption. Such models have been demonstrated by Ueta & Meixner (ueta (2003)) who calculated a 2-D dust radiative transfer model. When viewed edge-on, the near-IR flux drops relative to when the disk is viewed face-on. If this is the case, it implies that already at this stage of the AGB evolution, the star can be seen to depart from having spherically symmetric outflow. The presence of a disk will enhance further mass loss in an axisymmetric manner. It is known that most of the observed post-AGB stars show axisymmetric morphology (Ueta et al. ueta2 (2000)).
5 Enhanced mass loss - superwind
| Star | this work | OH | CO |
|---|---|---|---|
| IRAS 18052 | 1.1E-4 | 6.3E-05a | - |
| IRAS 18092 | 1.1E-4 | 2.0E-05a | - |
| IRAS 18100 | 2.1E-4 | 4.0E-05a | - |
| OH 16.1 | 2.9E-4 | 4.7E-05a | - |
| IRAS 18257 | 1.5E-4 | 9.4E-05a | - |
| OH 21.5 | 2.6E-4 | 8.1E-05a | - |
| IRAS 18327 | 1.2E-4 | 5.0E-05a | - |
| OH 26.5 | 2.6E-4 | 9.0E-05a | 8.0E-6d |
| IRAS 18361 | 1.7E-4 | 5.1E-05a | - |
| OH 30.7 | 2.6E-4 | 4.5E-05a | - |
| OH 30.1 | 2.2E-4 | 7.5E-05a | 1.2E-5e |
| IRAS 18488 | 3.6E-4 | 6.5E-05a | - |
| OH 32.8 | 3.1E-4 | 1.6E-04b | 3.1E-5e |
| IRAS 18588 | 1.3E-4 | 2.5E-05a | - |
| OH 39.9 | 1.6E-4 | 6.6E-05a | - |
| IRAS 19067 | 2.7E-4 | 4.9E-05a | - |
| IRAS 22177 | 1.3E-4 | 1.0E-04b | 6.5E-5d |
| AFGL 5379 | 2.0E-4 | 5.3E-05a | 3.4E-6f |
| OH 13.1 | 2.4E-4 | 8.3E-05b | - |
| IRAS 18310 | 2.4E-4 | 3.8E-05c | - |
| OH 51.8 | 1.8E-4 | 8.8E-05c | - |
| OH 65.7 | 3.2E-4 | 2.6E-05c | - |
| OH 75.3 | 3.0E-4 | 5.9E-05c | - |
To investigate further, we check the OH 1612 MHz maser flux for each object. Here, there is no real correlation between the maser luminosity and the ice condensation as the stars with and without ice are intermingled. It also does not follow the expected trend between the OH maser luminosity and the mass loss rate, namely L (Baud & Habing baud (1983)). For an expected OH luminosity, the derived dust mass loss rate is much higher than expected. This deviation can be understood in the context of the superwind. These stars have most likely recently undergone an increase in the mass loss rate which has not have time to propagate out to where the OH maser emission originates from. Typically, OH maser scale is of an order of 1017cm which reflects the mass loss rate of about 2 000 years ago. The discrepancy between the dynamical and the expected mass loss rate derived from the OH luminosity reflects the time scale of the superwind of less than about (1-2) 103 years old. An enhanced mass loss rate varies by about a factor of 2-6 compared to those derived from the OH maser.
This is further confirmed when looking at available CO observations of our sample. Only very few have been observed and detected (Table 4). Their CO mass loss rate is significantly lower than the derived total dynamical mass loss rate by a factor of 10 or more. The estimated CO mass loss rate is based on the formalism by Olofsson et al. (hans93 (1993)) and Gronewegen et al. (martin (1999)) who extended the equation for CO J=3-2.
| (3) |
where is the main beam temperature, is the terminal velocity in km s-1, D is the distance in pc, is the FWHM of the beam, is the CO abundance (taken to be 5 10-4 here) and s(J) is a constant, depending on the rotational transition. The CO mass loss rate can be seen to be lower than the OH mass loss rate which supports that CO transitions probe the much earlier mass loss episode than that of OH and the infrared. The disparity between the dynamical mass loss rate and those derived from CO observations lends a very strong support to the superwind idea.
By comparing the OH mass loss rate and the dynamical mass loss rate (Table 4), we can determine the upper limit of the lifetime of the superwind of 2 000 yrs. This gives enough time for the dust to cool below the water-ice condensation temperature. What is not clear is the actual time since the superwind started in each object. In some stars, the superwind might have just started a few hundred years ago hence grains are too hot for water condensation. However, Justtanont et al. (kay96 (1996)) showed that OH26.5+0.6 entered the superwind phase some 200 years ago and still the spectrum shows the evidence for water-ice (Meyer et al meyer (1998)). This means that the high density of the superwind can effectively shield the stellar radiation, allowing silicate grains to be cool enough for water-ice condensation. In order to determine the extent of a superwind, high resolution observations in the infrared, or CO and modelling will be needed (e.g., Fong et al., fong (2002)). It may also be possible to probe the superwind using high angular resolution OH maser observations as these stars are known to have relatively strong maser emission.
6 Summary
We search the circumstellar envelope of extreme OH/IR stars for the presence of water-ice in an attempt to check the reported correlation between the water-ice column density and the mass loss rate (Meyer et al meyer (1998)). We found that such a correlation exists in our sample stars which display the 3.1m water-ice absorption. However, not all the stars in our study show the water-ice band. Furthermore, from the depth of the silicate 9.7m band which is an indication of the dust mass loss rate, it is not possible to predict which of the circumstellar shells should display the water-ice band. Stars which show a distinct water-ice absorption band also shows a near-IR deficiency compared to stars with no water-ice detection. A plausible explanation is another dust species which condensed at the same time as the water-ice, e.g., iron (Kemper et al. kemper (2002)). It remains a puzzle how the two species with different condensation temperatures are linked. It is also possible that the water-ice is present in a disk around the central star and when viewed along the line-of-sight, gives higher extinction than at an inclined angle.
We found a simple estimate of the mass loss rate from the ratio of the depth of the silicate absorption feature at 9.7m and the continuum flux. The main uncertainty in our estimated dust mass loss rate is the distance to the stars which in many of the cases here is unknown.
Comparison of our derived dust mass loss rate with the expected gas mass loss rate from the OH luminosity and CO rotational observations indicates that these extreme OH/IR stars have recently undergone an increase in the mass loss rate by a factor of 10. The maximum timescale for the superwind is less than the time it takes for the mass loss to reach the H2O photodissociation radius, i.e., 2 000 yrs. In some cases, this can be much smaller as the dynamical mass loss rate is higher than the mass loss rate derived from the OH observations. High angular resolution observations () will be able to confirm the extent of the superwind.
References
- (1)
- (2) Baud B., & Habing H.J., 1983, A&A 127, 73
- (3) Cami J., de Jong T., Justtanont K., Yamamura I., Waters L.B.F.M., 1998, ApS&S 255, 339
- (4) David P., Le Squeren A.M., Sivagnanam P., 1993, A&A 277, 453
- (5) d’Hendecourt L.B., Allamandola L.J., 1986 A&AS 64, 453
- (6) Dijkstra C., Dominic C., Hoogzaad S.N., de Koter A., Min M., 2003a, A&A 401, 599
- (7) Dijkstra C., Waters L.B.F.M., Kemper F., et al., 2003b, A&A 404, 429
- (8) Fong D., Justtanont K., Meixner M., Campbell M.T., 2002, A&A 396, 581
- (9) Goldreich P., & Scoville N., 1976, ApJ 205, 144
- (10) Gail H.-P.& Sedlmayr E., 1986, A&A 166, 225
- (11) Gronewegen M.A.T., Baas F., Blommaert J.A.D.L., Stehle R., Josselin E., Tilanus R.P.J., 1999, AAS 140, 197
- (12) Haisch B.M., 1979 A&A 72, 161
- (13) Heske A., Forveille T., Omont A., van der Veen W.E.C.J., Habing H.J., 1990, A&A 239, 173
- (14) Justtanont K., Skinner C.J., Tielens A.G.G.M., Meixner M., Baas F., 1996, ApJ 456, 337
- (15) Justtanont K., Tielens A.G.G.M., 1992, ApJ 398, 400
- (16) Kemper F., de Koter A., Waters L.B.F.M., Bouwman J., Tielens A.G.G.M., 2002, A&A 384, 585
- (17) Kemper F., Stark R., Justtanont K., et al., 2003, A&A 407, 609
- (18) Knapp G.R., 1985, ApJ 293, 273
- (19) Koike C., Shibai H., Tuchiyama A., 1993, MNRAS 264, 654
- (20) Loup C., Forveille T., Omont A., Paul J.F., 1993, AAS 99, 291
- (21) Maldoni M., Egan M.P., Smith R.G., Robinson G., Wright C.M., 2003, MNRAS 345, 912
- (22) Mathis J.S., Rumpl W., Nordsieck K.H., 1977, ApJ 217, 425
- (23) Meyer A.W., Smith R.G., Charnley S.B., Pendleton Y., 1998, AJ 115, 2509
- (24) Olofsson H., Eriksson K., Gustafsson B., Carlström U., 1993, ApJS 87, 267
- (25) Olofsson H., Gonz’alez Delgado D., Kerschbaum F., Schöier F.L., 2002, A&A 391, 1053
- (26) Omont A., Moseley S.H., Forveille T., et al., 1990, ApJ 355, L27
- (27) Schmitt B., Quirico E., Trotta F., Grundy W.M., 1998 in Solar System Ices, Dordrecht Kluwer, ASSL vol. 227, 199
- (28) Skinner C.J., Whitmore B., 1988, MNRAS 231, 169
- (29) Sevenster M., 2002, AJ 123, 2772
- (30) Sylvester R.J., Kemper F., Barlow M.J., et al., 1999, A&A 352, 587
- (31) te Lintel Hekkert P., Versteege-Hensel H.A., Habing H.J., Wiertz M., 1989 A&AS 78, 399
- (32) Ueta T., & Meixner M., 2003, ApJ 586, 1338
- (33) Ueta T., Meixner M., Bobrowsky M., 2000, ApJ 528, 861
- (34) Water L.B.F.M., Molster F.J., 1999, in IAUS 191 : Asymptotic Giant Branch Stars, eds. T. Le Bertre, A. Lèbre, C. Waelkens, Astron Soc Pacific, p. 209