Deducing the Lifetime of Short Gamma-Ray Burst Progenitors from Host Galaxy Demography
Abstract
The frequency of short gamma-ray bursts (GRBs) in galaxies with distinct star formation histories can be used to constrain the lifetime of the progenitor systems. As an illustration, we consider here the constraints that can be derived from separating the host galaxies into early and late types. On average, early-type galaxies have their stars formed earlier than late-type galaxies, and this difference, together with the time delay between progenitor formation and short GRB outburst, leads to different burst rates in the two types of hosts. Presently available data suggest, but not yet prove, that the local short GRB rate in early-type galaxies may be comparable to that in late-type galaxies. This suggests that, unlike Type Ia supernovae, at least half of the short GRB progenitors that can outburst within a Hubble time have lifetimes greater than about 7 Gyr. Models of the probability distribution of time delays, here parametrized as , with are favored. This apparent long time delay and the fact that early-type galaxies in clusters make a substantial contribution to the local stellar mass inventory can explain the observed preponderance of short GRBs in galaxy clusters.
Subject headings:
gamma rays: bursts – stars:formation – cosmology:observations – galaxies:formation1. Introduction
The progenitors of short duration, hard spectrum, gamma-ray bursts (GRBs) are not yet well identified. Even with the recent localizations of a handful of short-hard GRBs (Bloom et al., 2006; Gehrels et al., 2005; Villasenor et al., 2005; Berger et al., 2005; Fox et al., 2005; Berger et al., 2006; Berger, 2007), no transient emission has been found that directly constrains the nature of the progenitor system. The current view of most researchers is that GRBs arise in a very small fraction of stars that undergo a catastrophic energy release event toward the end of their evolution (e.g., Mochkovitch et al., 1993; Lattimer & Schramm, 1976; Eichler et al., 1989; Narayan, Paczyński & Piran, 1992; Ruffert & Janka, 1999; Kluźniak & Lee, 1998; Rosswog & Ramirez-Ruiz, 2003; Rosswog, Ramirez-Ruiz & Davies, 2003; Setiawan et al., 2004; Lee et al., 2004; Aloy et al., 2005; MacFadyen et al., 2005; Levan et al., 2006; Lee & Ramirez-Ruiz, 2007). Much of the current effort is dedicated to understanding the different progenitor scenarios and trying to determine how the progenitor and the burst environment can affect the observable burst and afterglow characteristics (e.g., Lee et al., 2005). The lifetime of progenitors of short bursts can be meaningfully constrained by properties of their host galaxies (e.g., Fox et al. 2005; Gal-Yam et al. 2005). We suggest here a method to constrain the lifetime of the progenitors by making use of the star formation histories of their host galaxies.
Based on the short burst afterglows localized so far (Berger, 2007), two of the three relatively nearby () events (GRB 050509b and GRB 050724) are plausibly associated with galaxies exhibiting characteristic early-type spectra (Berger et al., 2005; Bloom et al., 2006; Gehrels et al., 2005; Prochaska et al., 2006). In the other case (GRB 050709), the host galaxy shows signature of a dominant stellar population with age of 1Gyr (Covino et al., 2006) and it also exhibits strong emission lines that indicate ongoing star formation (Covino et al., 2006; Fox et al., 2005; Prochaska et al., 2006). There is also independent support that, at least two of the nine short bursts localized so far (Berger, 2007) are associated with clusters of galaxies (Bloom et al., 2006; Gladders et al., 2005; Pedersen et al., 2005). In contrast to what is found for long-soft GRBs, for which all of the confirmed host galaxies are actively forming stars (e.g., Trentham et al., 2002; Christensen et al., 2004), these observations clearly signify that, like Type Ia supernovae, short GRBs are triggered in galaxies of all types. What is more, it indicates that there is a time delay between short burst occurrence and the main epoch of star formation activity in the hosts, as determined by the progenitor’s lifetime.
In this paper, we present a method to deduce the lifetime of short GRB progenitors from the burst rates in host galaxies of different types that have distinct star formation histories. Limited by the accuracy of how well we can separate their contribution to the star formation history, we show, with this constraint in mind, how a large sample host galaxies could be used to determine the lifetime distribution of short GRB progenitors. Here we chose to separate the formation history of stars residing in early- and late-type galaxies, but, as shown in §5, our study can be easily generalized to any set of subpopulations of galaxies possessing distinct star formation histories. The layout is as follows. In § 2, we review the local stellar budgets in early- and late-type galaxies. The total star formation history is subsequently decomposed in § 3 into a sum of the stars that assembled in today’s early- and late-type galaxies. With the decomposition in place, in § 4, we show how the frequency of short GRBs in a well-defined sample of host galaxies of different types can be used to constrain the lifetime of the progenitors. Finally, in § 5 we summarize our results and outline future prospects. Throughout this paper, we assume a spatially-flat CDM cosmology with and the Hubble constant in units of .
2. The Local Stellar Mass Inventory
The focus of this paper is the relatively local () host galaxy population, but our study can be easily generalized to any redshift. The main idea is to use the difference in the star formation history of galaxy sub-populations to probe the lifetime distribution of short GRB progenitors. As an example, here we use the event rate of burst residing in local early- and late-type galaxies. On average, early-type galaxies have their stars formed earlier than late-type galaxies, and this difference, together with the delay time for short GRB outburst, leads to different burst rates in these two types of galaxies. As shown in § 3, our method of inferring the star formation history of a given population relies on tracing the assembly’s history of the stellar mass in galaxies at . For this reason, in this section, we briefly review the local stellar mass budgets in galaxies of different types.
With a universally applicable stellar initial mass function (IMF), the stellar mass function (MF) of galaxies can be estimated from well-defined samples of galaxies. Galaxy MFs have been measured based on a few large galaxy redshift surveys (e.g., Kauffmann et al., 2003; Bell et al., 2003). For the calculations presented here, we adopt the galaxy MF measured by Bell et al. (2003) using a large sample of galaxies from the Two Micron All Sky Survey (2MASS; Skrutskie et al. 2006) and the Sloan Digital Sky Survey (SDSS; York et al. 2000). The Bell et al. catalog provides well-defined samples of galaxies of different types as defined by either the light concentration or the color of galaxies.
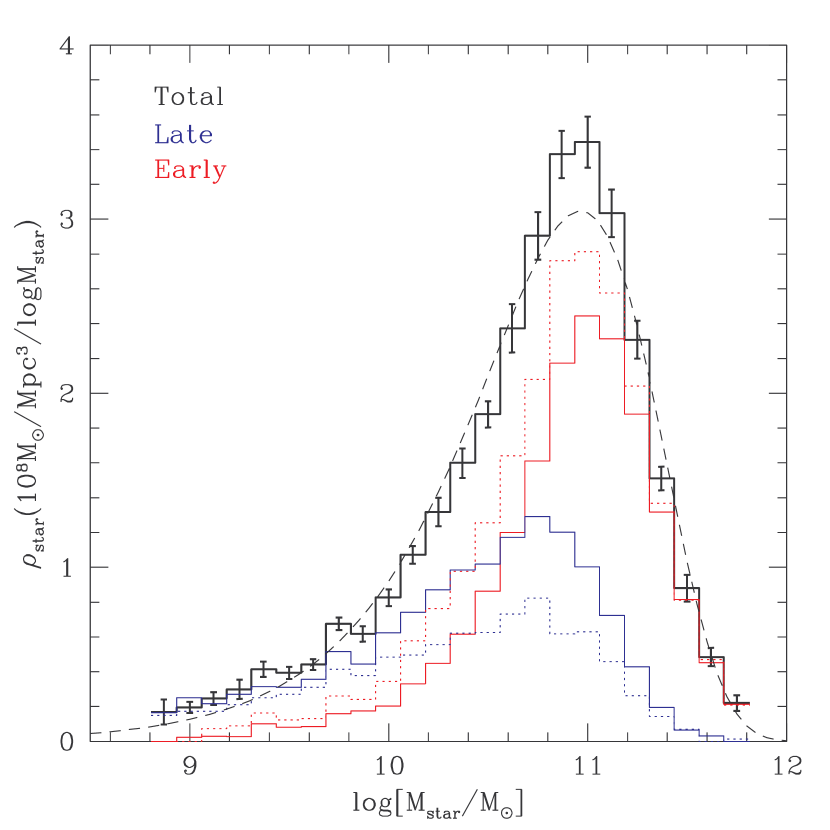
In Figure 1, we show the stellar MF, , multiplied by the stellar mass, , for galaxies of different types. The quantity is the stellar mass density contributed by galaxies with stellar mass . The peak of for galaxies of all types comes from galaxies, where is the characteristic stellar mass derived from the Schechter function fit. The stellar mass density distribution for late-type galaxies peaks at masses slightly less than and has a tail extending to low stellar masses. Early-type galaxies have a narrow stellar mass density distribution around and dominate the local stellar mass budget above a few times . Although early-type galaxies are far less in total number than late-type galaxies, they are on average more massive and thus make a larger contribution to the local stellar mass density. The total stellar mass from early-type galaxies is about 1.3 (2.3) times that from late-type galaxies, if the classification of galaxy types is based on light concentration (color).
If early- and late-type galaxies had similar star formation histories, then the ratio of the short GRB rates in galaxies of different types would simply be given by the ratio of the stellar mass density in these galaxies. However, the two types of galaxies have distinct star formation histories – on average, stellar populations in early-type galaxies are older than those in late-type galaxies. For this reason, the delay time between formation and the short GRB outburst plays an important role in determining the burst rates in these two types of galaxies.
3. The Star Formation History of Galaxies
The cosmic star formation history (SFH), which includes stars forming in both early- and late-type galaxies, can be probed by different techniques, including the rest-frame UV continuum emitted by young stars, the infrared or sub-millimeter reprocessed radiation, and line emission from star-forming regions (e.g., Madau et al. 1996; Giavalisco et al. 2004; Pérez-González et al. 2005; Hopkins et al. 2000; see Hopkins 2004 and Fardal et al. 2006 for a summary and a compilation of SFHs from different techniques).
Analytic fits to the SFH based on compiled star formation rate (SFR) at various redshifts have been derived by many authors (e.g., Hopkins 2004; Hopkins & Beacom 2006; Cole et al. 2001; Fardal et al. 2006). Here, as an illustration, we use the analytic fit to the overall SFH given by Fardal et al. (2006),
| (1) |
where , , , , and is the Hubble constant at redshift . The above fit assumes a diet Salpeter stellar initial mass function111A diet Salpeter IMF is similar to the typical Salpeter IMF at the high mass end but differs at the low end by having less lower mass stars so that the total stellar mass content is 0.7 times that of the Salpeter IMF (Bell & de Jong 2001). (IMF), To the first order, altering the IMF leads to an overall vertical shift of the SFR. For example, adopting a Salpeter IMF, the SFR would be about 40% higher. What is more, even with a fixed IMF, the derived SFR as a function of redshift shows considerable scatter. As a result, the SFR in equation (1) may be scaled up and down by about 0.2 dex (Fardal et al., 2006).
In addition to the total SFH, we are also interested in knowing the SFH for stars residing in galaxies of different types. More specifically, given the early- and late-type galaxy populations, our aim is to understand how the stars in these two different types of galaxies were pieced together. We, of course, only need to know the SFH for galaxies of one type, as the SFH for the other type can be easily derived by subtracting the known contribution from the total SFH in equation (1).
Ideally, to determine the SFH of a given population of galaxies, one would like to empirically derive their assembly history by identifying their progenitor systems at different redshifts. Alternatively, we can study the stellar population contents of galaxies to infer their SFH. The former is not trivial, while considerable efforts have been made to the latter through spectral synthesis modeling (e.g., Heavens et al. 2004; Panter et al. 2006; Cid Fernandes et al. 2005, 2006), which decomposes the observed spectra of galaxies into stellar populations of a range of ages and metallicities. Heavens et al. (2004) first used this technique to infer the global SFH and that as a function of stellar mass. More recently, Panter et al. (2006) improved it to yield a better agreement with other empirical determinations of the global SFH, which peaks at systematically higher redshifts than that in Heavens et al. (2004). Obviously, this method would improve with a better understanding of the systematic effects.
A more readily available method is to use galaxy formation models to separate the SFH as a function of galaxy type. The accuracy of galaxy formation models crucially depends on our understanding of the gas physics and star formation as well as feedback processes. Current galaxy formation models, although far from providing a perfect description, can successfully explain many aspects of the observed properties of galaxies. Hopefully, future improvements in galaxy formation modeling would help provide a better description of the SFH as a function of galaxy type.
With this in mind, we proceed separating the global SFH using a particular galaxy formation model (with model uncertainties roughly accounted for). It should be noted here that our method is applicable to any two or more galaxy populations provided they have distinct SFHs. This is clearly illustrated in § 5, in which, for comparison, an observationally motivated decomposition based on galaxy masses is used instead.
De Lucia et al. (2006) studied the formation history of elliptical galaxies using a galaxy formation model based on the Millennium Simulation of the concordance CDM cosmology (Springel et al., 2005). They calculated the average SFH of elliptical galaxies of various stellar masses. If early-type galaxies are identified here as ellipticals, we can then compute their average star formation rate () as a function of redshift using
| (2) |
where is the stellar MF of early-type galaxies derived by Bell et al. (2003), and (in units of ) is the average SFR per stellar mass for a elliptical galaxy of stellar mass (obtained from spline interpolations between the curves presented in De Lucia et al. 2006).
The application of equation (2) combines the empirically inferred galaxy stellar mass function and the theoretically predicted SFR. It requires the galaxy samples derived by both observation and theory to be consistent. Although in principle this is not a problem, since any sophisticated galaxy formation model would give detail predictions for a well defined galaxy population, the available data and models used here are based on slightly different definition rules, which introduces uncertainties in the determination of the SFH of early-type galaxies. In Bell et al. (2003), galaxies are classified through either color or light concentration, which is shown to be only a crude discriminant between early- and late-type galaxies (Strateva et al., 2001), and, as a result, the early-type galaxies in Bell et al. (2003) include galaxies earlier than Sa. De Lucia et al. (2006) split galaxies in their formation model according to the predicted -band bulge-to-disk light ratio and classify them as ellipticals provided the bulge light is at least 70% of the total light. For this reason, the SFH of the observed local early-type galaxies as derived from the stellar-mass dependent SFH of the modeled ellipticals would tend to shift toward slightly earlier formation times. In addition, in the galaxy formation model used here, stars are produced from cooled gas and a stellar IMF is adopted only for the purpose of providing spectroscopic predictions. Because of this, a comparison between this IMF and the one used to derive the observed galaxy stellar mass function is not meaningful. Instead, the key questions are whether the IMF assumed to derive the observed galaxy mass function is close to the “true” one and whether the star formation efficiency in the galaxy formation model is accurate. Inaccuracy in either one would lead to a relative amplitude change in the SFHs.
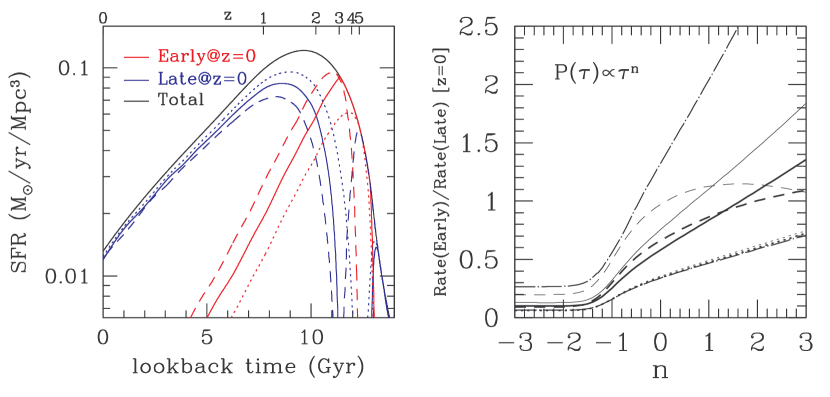
The left panel of Figure 2 shows an example of the SFH decomposition. Although the primary aim of the SFH decomposition selected in this study is to illustrate the applicability of our method, we pay particular attention to the uncertainties associated with it. Several variants of the SFH decomposition are constructed to test the robustness of the results. Each version has a different way to adjust the derived SFR in early-type galaxies with respect to the assumed overall SFH. The amplitude and/or position of the derived rate is adjusted using one of the following methods: (i) the derived SFR is selected to be equal to the overall SFH whenever the predicted rate lies above it (red solid curve in Fig. 2), (ii) the overall amplitude of the derived SFR is systematically lowered so that it lies just below the overall SFH (red dotted curve in Fig. 2), and (iii) the derived SFR is arbitrarily shifted to low redshifts so that it both lies below the overall SFH and peaks at a redshift that is not lower than the overall SFH (red dashed curve in Fig. 2). In addition, the overall SFH is allowed to change by 0.2 dex in order to account for the uncertainties associated with its determination (Fardal et al., 2006). The above variants are applied every-time the overall SFH is altered.
Finally, we adopt the two definitions of early-type galaxies in Bell et al. (2003) based on color and concentration, respectively. As a whole, the above procedure takes into account both the inaccuracy of the galaxy formation model predictions and the uncertainties in the global SFH as inferred from observations, as well as the ambiguity of the earl-type definition criteria. These uncertainties are propagated self consistently when estimating the lifetime distribution of short GRB progenitors (§ 4). The region enclosed by the dashed-dotted curves in the right panel of Fig. 2 shows the combined effects on the derived lifetime distributions of short GRB progenitors when adopting the three variants discussed above, allowing a 0.2 dex change in the overall SFH, and considering the two definitions of early-type galaxies.
As a representative example, in the left panel of Figure 2, we plot the SFH in equation (1) and the SFH of the early-type galaxies defined through color, as black and red curves, respectively. The different line types for the SFH of early-type galaxies are for the various adjustments listed above. In general, the derived average SFHs of the early-type galaxies peak at a look-back time of about 10–12 Gyr and subsequently decline toward low redshifts. The shape of this early-type SFH is quite consistent with that of the fossil bulge model fit in Nagamine et al. (2006) and that of SFH of galaxies with stellar mass above inferred in Panter et al. (2006).
The average SFH for the late-type galaxies, computed by subtracting (2) from (1), is shown as blue curves in the left panel of Figure 2. The average SFR for the late-type galaxies has a steep rising starting at lookback times of 11 Gyr, subsequently peaking at 8–9 Gyr, and slowly declining thereafter. The SFR becomes increasingly dominated by late-type galaxies from lookback times of 9 Gyr to the present epoch.
We note here that the overall SFH in equation (1) has a slightly higher amplitude than the predicted early-type SFR at lookback times greater than 12 Gyr, which gives rise to a modest second peak in the late-type SFR at high redshifts. This may be interpreted as a contribution from local late-type galaxies to the SFR at these early epochs, which could be related to the formation of the bulges of these galaxies. It may also be an artifact associated with the inaccuracy of the model, which we consider to be more likely. We find that even if taken at face value, this early contribution to the formation of stars in local late-type galaxies leads only to a less than 10% increase in the inferred short GRB burst ratio in the two types of galaxies (§ 4). For this reason, we leave the SFR for late-type galaxies at these epochs as those given by the decomposition and do not perform any correction.
4. Constraints on the Lifetime of Short GRB Progenitors
The short GRB rate is a convolution of the SFR and the distribution of time delays between formation and outburst (e.g., Piran, 1992)
| (3) |
where the subscript denotes the type of galaxies in consideration, is the probability distribution of the time delay , and is a normalization constant. In principle, details of the star formation process may be related to the assembly history of galaxies. Therefore, the distribution and the normalization constant could be different for different types of galaxies. We make the simple assumption here that this dependence is weak so that the same distribution and normalization is used for all types of galaxies.
The distribution of the time delay for short GRB is not yet well understood. It can be constrained using, for example, the burst rate as a function of redshift (e.g., Nakar et al., 2006; Guetta & Piran, 2005; Ando, 2004). The luminosity function of short GRBs and its redshift evolution used in this method are not well determined at present. To avoid such complications, here we propose to use the local rates of short GRBs in different types of galaxies as an alternative and complementary method to constrain the probability distribution . As an illustration, we adopt a simple parameterization, , and calculate the ratio of rates of short GRBs at in early- and late-type galaxies as a function of . The right panel of Figure 2 shows the results of such exercise. The thick solid, dotted, and dashed curves are for three different treatments of the early-type SFR (see § 3), corresponding to the three different curves in the left panel. Here galaxy types are defined by their light concentration. The three thin curves in the right panel have been calculated using a similar treatment but are for early-type galaxies as defined by their color. The two dot-dashed curves give the maximum range of uncertainties in the resultant burst rate ratio, as they give a fair representation of all the uncertainties involved in separating the SFH as discussed in § 3.
For larger , the distribution is weighted more toward longer time delays, so that early-type galaxies, which on average form their stars earlier than late-type galaxies, are more likely to host short GRBs. For smaller (negative) , short GRB progenitor systems with shorter time delays would dominate and one would be more likely to find them in late-type galaxies. For , short GRB progenitors would be those with very short time delays so that the short GRB rate ratio is basically determined by the ratio of the SFRs in early- and late-type galaxies. However, the amplitude of the plateau at in the right panel of Figure 2 should be taken cautiously, because it depends on how one interpolates the SFR in early-type galaxies derived by De Lucia et al. (2006) to . For this reason, the method proposed here becomes less useful for time delays that are short when comparing to the mean age of stars residing in early-type galaxies. Clearly, as we argue in what follows, current observational constraints for short GRBs are such that uncertainties in the determination of the amplitude of the plateau at are irrelevant.
Our calculation is based on galaxy populations. Of the nine well localized short bursts, only three hosts, two elliptical galaxies and one star-forming galaxy, reside at . Therefore, the face value of the burst ratio in local early- and late-type galaxies is provided there are no selection effects that make short GRBs more likely to be detected in a galaxy of a given type (e.g., because of the low density of the interstellar medium one may expect the GRB afterglow in elliptical galaxies to be faint, e.g., Belczynski et al. 2006). The error-bar on this observed ratio is not readily assigned because of the small number statistics. However, even with a conservative estimate of the ratio as , the analysis presented here alludes to a probability distribution with , thus favoring long delay times. This is in contrast to what is found in Type Ia supernovae, for which the relatively low frequency in early-type galaxies (e.g., van den Bergh, 1990; Mannucci et al., 2005) yields .

If the distribution is assumed to have a log-normal form, there are a series of combinations of the mean and the width that can explain the observed burst rate ratio in early- and late-type galaxies at . We illustrate the underlying powerlaw and two cases of log-normal distributions for burst ratio of one and two, respectively, in Figure 3, using the SFH split corresponding to the top curve in the right panel of Figure 2. For a narrow log-normal distribution, it just peaks at when the ratio of the SFRs in two types of galaxies at a lookback time equals the burst ratio. A wide log-normal distribution and the corresponding powerlaw distribution have a general similarity with each other, but they diverge from each other at small time delays if the powerlaw index is negative, which indicates that the method has a poor constraint in at the low end. For a burst ratio of unity, we find . If we take 13.7 Gyr as an upper limit for the delay time, which allows short GRB progenitors to outburst within a Hubble time, a distribution with implies that about half of progenitors of short GRBs should have lifetimes longer than 3.9Gyr. If at lower , does not rise as steeply as a powerlaw, this number becomes higher — for example, with a cutoff in at 2Gyr, the number becomes 6.7Gyr. For a wide (narrow) log-normal distribution, a burst ratio of order unity implies that about half of progenitors of short GRBs should have lifetimes longer than 7.0 (8.5) Gyr.
Obviously, the above calculation is only sketchy and should be taken with a grain of salt at present, although, given the uncertainties assigned to the modeling, the lower bound of seems rather robust. Constraints should improve as more host galaxies of short GRBs are detected and the SFH separation method is improved. In order to reach a 10% accuracy in the the burst ratio, observations of some 100 local short GRB host galaxies are needed. If the split of the SFHs could be well determined, an associated uncertainty in the time delay distribution could be easily achieved. If the realistic SFH separation lead to a 20% uncertainty in the predicted burst rate ratio, the constraints on would be degraded to . On the other hand, as suggested by our analysis, it is possible to set a very reliable lower bound on . In brief, for a more precise constraint to be derived on the time delay of short GRB progenitors using the method proposed here, one needs a larger sample of local short GRB host galaxies to be observed, the split of the SFH to be better determined, and the classification scheme of GRB host galaxies to be consistent with the assumed SFH split.
5. Discussion

In the local universe, based on the stellar mass functions of galaxies, about 55–70% of the stellar mass is in early-type galaxies, and, from the SFH we inferred, the corresponding stars mainly formed about 9 Gyr ago. Two of the three host galaxies of local short GRBs () are associated with old and massive galaxies with little current or recent star formation, which makes it unlikely that short bursts are associated with massive stars. Presently available data suggests, but not yet prove, a long time delay between the formation of the progenitor system and the short GRB outburst — for progenitors that can outburst within a Hubble time, about half of them have lifetime longer than 7 Gyr. It is fair to conclude that, based on the current host galaxy sample, the progenitors of short GRBs appears to be longer lived than those of Type Ia supernovae. Fox et al. (2005) also reach similar conclusion by arguing that Type Ia supernovae occur more frequently in late-type, star-forming galaxies. Simply based on a comparison of Hubble types between short GRBs and Type Ia supernovae host galaxies, Gal-Yam et al. (2005) argue that the delay time of short GRBs should be several Gyr even if the Type Ia supernovae delay time is as short as Gyr.
The lifetime of the progenitor systems is estimated here by using the SFH of elliptical galaxies from a galaxy formation model. This allow us to separate the early- and late-type galaxy contributions to the overall cosmic SFH. It would, however, be more self-consistent to infer SFHs of different types of galaxies by modeling the observed spectra with stellar population synthesis models. In either case, the uncertainty in the derived SFHs should be folded into the errors derived by this method for the distribution of time delays of short GRB progenitors.
In our calculation, different definitions of early-type galaxies (by color or by light concentration) introduce uncertainties in the resultant SFH. This, in principle, would not be a problem since we can choose to use the same definition for identifying the short GRB host galaxy type. The method proposed here is not limited to a separation between early and late galaxies. As long as galaxies are divided into two (or more) sub-populations that have distinct star formation histories, they can be used to constrain the lifetime distribution of GRB (or Type Ia supernova) progenitors, following the same reasoning presented here. For example, Shin & Berger (2006) recently applied our approach to field and cluster elliptical galaxies. Another example would be to divide galaxies according to their stellar mass. Panter et al. (2006) present SFH of local galaxies as a function of galaxy stellar mass by modeling their spectra. Low mass galaxies on average form their stars later than high mass galaxies, which can be used to constrain if the stellar mass of GRB hosts can be obtained. As an illustration, in Figure 4, we show the separation of the SFR of galaxies with low and high stellar masses (below or above ) using results by Panter et al. (2006). The shape of the overall SFH used in Panter et al. (2006) is slightly different from that in Figure 2, which may reflect some systematics in the derivation of the SFH based on the fossil record. If the systematics can be well controlled, this approach can become even more powerful than the one used here by inferring SFHs of individual GRB host galaxies. A maximum likelihood method can then be used to constrain based solely on the SFH of host galaxies, which puts our proposed method to an extreme — dividing the galaxy populations into individual galaxies. Furthermore, instead of assuming a functional form of , such an application to a large number of individual host galaxies may allow constraints on a non-parametric form of the distribution [i.e., constraining in different bins].
In this paper, we limit our study to galaxies, but the method can be easily generalized to galaxy populations at any redshift provided that one can accurately infer their SFHs (e.g., through spectral synthesis). The observational task can be minimized by focusing on the observations of host galaxies of individual short GRBs. However, for applications at high redshift to be useful, the luminosity function of short GRBs needs to be understood.
Throughout this paper we have assumed the same lifetime distribution of short GRB progenitors in both early- and late-type galaxies. However, star formation processes in these two types of galaxies may not be identical. For example, elliptical galaxies can form by the merging of two gas-rich galaxies (e.g., Mihos & Hernquist, 1994). Many globular clusters can form in the merging process (Schweizer, 2003), which could enhance, for example, the fraction of binary progenitors and also change the lifetime distribution (e.g., Grindlay et al. 2006). The magnitude of this kind of effect on the GRB progenitors is a formidable challenge to theorists and to computational techniques. It is, also, a formidable challenge for observers, in their quest for detecting minute details in extremely faint and distant sources.
At least two short GRB host galaxies are found in cluster environments. There may exist a selection bias of detecting short GRBs in a dense medium (Bloom et al., 2006). To study the association of short GRBs with clusters, it would be useful to separate the stellar mass function into that for field galaxies and that for cluster galaxies in addition to early- and late-type galaxies. More promising for the immediate future, the preponderance of cluster environments can be investigated observationally. Important information may be gained by studying the local stellar mass inventory shown in Figure 1. Approximately 50% of the stellar mass contents in early-type galaxies are in galaxies with that typically reside in clusters. Since it is likely that in clusters galaxies shut off their star formation process early on, a long progenitor lifetime further increases the tendency for short GRBs to happen in cluster galaxies. It is fair to conclude that the observed preponderance of cluster environments for short GRBs is consistent with an old stellar population that preferentially resides in early-type galaxies.
Detailed observations of the astrophysics of individual GRB host galaxies may be essential before stringent constraints on the lifetime of short GRB progenitors can be placed. If confirmed with further host observations, this tendency of short GRB progenitors to be relatively old can help differentiate between various ways of forming a short GRB.
References
- Aloy et al. (2005) Aloy, M. A., Janka, H.-T., Muller, E. 2005, A&A, 436, 273
- Ando (2004) Ando, S. 2004, Journal of Cosmology and Astro-Particle Physics, 6, 7
- Barthelmy et al. (2005) Barthelmy, S. D., et al. 2005, Nature, 438, 994
- Belczynski et al. (2006) Belczynski, K., Perna, R., Bulik, T., Kalogera, V., Ivanova, N., & Lamb, D. Q. 2006, ApJ, 648, 1110
- Bell & de Jong (2001) Bell, E. F., & de Jong, R. S. 2001, ApJ, 550, 212
- Bell et al. (2003) Bell, E. F., McIntosh, D. H., Katz, N., & Weinberg, M. D. 2003, ApJS, 149, 289
- Berger et al. (2005) Berger, E., et al. 2005, Nature, 438, 988
- Berger et al. (2006) Berger, E., et al. 2006, astro-ph/061128
- Berger (2007) Berger, E., 2007, astro-ph/0702694
- Bloom et al. (2006) Bloom, J. S., et al. 2006, ApJ, 642, 989
- Christensen et al. (2004) Christensen, L., Hjorth, J., & Gorosabel, J. 2004, A&A, 425, 913
- Cid Fernandes et al. (2005) Cid Fernandes, R., Mateus, A., Sodré, L., Stasińska, G., & Gomes, J. M. 2005, MNRAS, 358, 363
- Cid Fernandes et al. (2006) Cid Fernandes, R., Asari, N. V., Sodré, L., Stasińska, G., Mateus, A., Torres-Papaqui, J. P., & Schoenell, W. 2006, MNRAS, L121
- Cole et al. (2001) Cole, S., et al. 2001, MNRAS, 326, 255
- Covino et al. (2006) Covino, S., et al. 2006, A&A, 447, L5
- De Lucia et al. (2006) De Lucia, G., Springel, V., White, S. D. M., Croton, D., & Kauffmann, G. 2006, MNRAS, 366, 499
- Eichler et al. (1989) Eichler, D., Livio, M., Piran, T. & Schramm, D. N. 1989, Nature, 340, 126
- Fardal et al. (2006) Fardal, M. A., Katz, N., Weinberg, D. H., & Dav’e, R. 2006, MNRAS, submitted, ArXiv Astrophysics e-prints, arXiv:astro-ph/0604534
- Fox et al. (2005) Fox, D. B., et al. 2005, Nature, 437, 845
- Gal-Yam et al. (2005) Gal-Yam, A., et al. 2005, astro-ph/0509891
- Gehrels et al. (2005) Gehrels, N., et al. 2005, Nature, 437, 851
- Giavalisco et al. (2004) Giavalisco, M., et al. 2004, ApJ, 600, L103
- Gladders et al. (2005) Gladders, M., Berger, E., Morrell, N., & Roth, M. 2005, GCN, 3798, 1
- Grindlay et al. (2006) Grindlay, J., Portegies Zwart, S., & McMillan, S. 2006, Nature Physics, 2, 116
- Guetta & Piran (2005) Guetta, D., & Piran, T. 2005, A&A, 435, 421
- Heavens et al. (2004) Heavens, A., Panter, B., Jimenez, R., & Dunlop, J. 2004, Nature, 428, 625
- Hopkins et al. (2000) Hopkins, A. M., Connolly, A. J., & Szalay, A. S. 2000, AJ, 120, 2843
- Hopkins (2004) Hopkins, A. M. 2004, ApJ, 615, 209
- Hopkins & Beacom (2006) Hopkins, A. M., & Beacom, J. F. 2006, ApJ, 651, 142
- Kauffmann et al. (2003) Kauffmann, G., et al. 2003, MNRAS, 341, 33
- Kluźniak & Lee (1998) Kluźniak, W. & Lee, W. H. 1998, ApJ, 494, L53
- Lattimer & Schramm (1976) Lattimer, J. M. & Schramm, D. N. 1976, ApJ, 210, 549
- Lee et al. (2004) Lee, W. H., Ramirez-Ruiz, E., & Page, D. 2004, ApJ, 608, L5
- Lee et al. (2005) Lee, W. H., Ramirez-Ruiz, E., & Granot, J. 2005, ApJ, 630, L165
- Lee & Ramirez-Ruiz (2007) Lee, W. H., & Ramirez-Ruiz, E. 2007, New J.Phys. 9, 17
- Levan et al. (2006) Levan, A. J., Wynn, G. A., Chapman, R., Davies, M. B., King, A. R., Priddey, R. S., & Tanvir, N. R. 2006, MNRAS, 368, L1
- MacFadyen et al. (2005) MacFadyen, A. I., Ramirez-Ruiz, E., & Zhang, W. 2005, astro-ph/0510192
- Madau et al. (1996) Madau, P., Ferguson, H. C., Dickinson, M. E., Giavalisco, M., Steidel, C. C., & Fruchter, A. 1996, MNRAS, 283, 1388
- Mannucci et al. (2005) Mannucci, F., Della Valle, M., Panagia, N., Cappellaro, E., Cresci, G., Maiolino, R., Petrosian, A., & Turatto, M. 2005, A&A, 433, 807
- Mihos & Hernquist (1994) Mihos, J. C., & Hernquist, L. 1994, ApJ, 431, L9
- Mochkovitch et al. (1993) Mochkovitch, R., Hernanz, M., Isern, J. & Martin, X. 1993, Nature, 361, 236
- Nagamine et al. (2006) Nagamine, K., Ostriker, J. P., Fukugita, M., & Cen, R. 2006, ApJ, 653, 881
- Nakar et al. (2006) Nakar, E., Gal-Yam, A., & Fox, D. B. 2006, ApJ, 650, 281
- Narayan, Paczyński & Piran (1992) Narayan, R., Paczyński, B. & Piran, T. 1992, ApJ, 395, L83
- Panter et al. (2006) Panter, B., Jimenez, R., Heavens, A. F., & Charlot, S. 2006, ArXiv Astrophysics e-prints, arXiv:astro-ph/0608531
- Pedersen et al. (2005) Pedersen, K., et al. 2005, ApJ, 634, L17
- Pérez-González et al. (2005) Pérez-González, P. G., et al. 2005, ApJ, 630, 82
- Piran (1992) Piran, T. 1992, ApJ, 389, L45
- Prochaska et al. (2006) Prochaska, J. X., et al. 2006, ApJ, 642, 989
- Rosswog & Ramirez-Ruiz (2003) Rosswog, S., & Ramirez-Ruiz, E. 2003, MNRAS, 343, L36
- Rosswog, Ramirez-Ruiz & Davies (2003) Rosswog, S., Ramirez–Ruiz, E. & Davies, M.B. 2003, MNRAS, 345, 1077
- Ruffert & Janka (1999) Ruffert, M. & Janka, H.-T. 1999, A& A, 344, 573
- Schweizer (2003) Schweizer, F. 2003, ASP Conf. Ser. 296: New Horizons in Globular Cluster Astronomy, 296, 467
- Setiawan et al. (2004) Setiawan, S., Ruffert, M. & Janka, H.-Th. 2004, MNRAS, 352, 753
- Shin & Berger (2006) Shin, M.-S., & Berger, E. 2006, ArXiv Astrophysics e-prints, arXiv:astro-ph/0609336
- Springel et al. (2005) Springel, V., et al. 2005, Nature, 435, 629
- Strateva et al. (2001) Strateva, I., et al. 2001, AJ, 122, 1861
- Skrutskie et al. (2006) Skrutskie, M. F., et al. 2006, AJ, 131, 1163
- Trentham et al. (2002) Trentham, N., Ramirez-Ruiz, E., & Blain, A. W. 2002, MNRAS, 334, 983
- van den Bergh (1990) van den Bergh, S. 1990, PASP, 102, 1318
- Villasenor et al. (2005) Villasenor, J. S., et al. 2005, Nature, 437, 855
- York et al. (2000) York, D. G., et al. 2000, AJ, 120, 1579