SPEAR Far Ultraviolet Spectral Images of the Cygnus Loop
Abstract
We present far-ultraviolet (FUV) spectral images, measured at C IV 1550, He II 1640, Si IV+O IV] 1400, and O III] 1664, of the entire Cygnus Loop, observed with the Spectroscopy of Plasma Evolution from Astrophysical Radiation (SPEAR) instrument, also known as FIMS. The spatial distribution of FUV emission generally corresponds with a limb-brightened shell, and is similar to optical, radio and X-ray images. The features found in the present work include a “carrot”, diffuse interior, and breakout features, which have not been seen in previous FUV studies. Shock velocities of 140–160 km s-1 is found from a line ratio of O IV] to O III], which is insensitive not only to resonance scattering but also to elemental abundance. The estimated velocity indicates that the fast shocks are widespread across the remnant. By comparing various line ratios with steady-state shock models, it is also shown that the resonance scattering is widespread.
1 Introduction
The Cygnus Loop is one of the most well-studied supernova remnants (SNRs) in our galaxy because of its large apparent angular size, its high surface brightness, and its low reddening. It is generally considered the prototypical “middle-aged” SNR. Global features of the Cygnus Loop have been studied in great detail at optical, X-ray, radio, and infrared wavelengths (Levenson et al., 1998; Aschenbach & Leahy, 1999; Leahy, Roger, & Ballantyne, 1997; Arendt, Dwek, & Leisawitz, 1992). X-rays are emitted from hot (temperature K) gas heated by shocks with velocities km s-1, while optical emission arises from slower shocks in which the postshock region cools to K. Observations of far-ultraviolet (FUV) emission from intermediate temperatures gas, mostly limited to small spatial regions, have played an important role for the reliable estimation of shock speeds and elemental abundances. Early studies concentrated on bright optical filaments and compared FUV spectra with steady-flow shock models (Benvenuti, Dopita, & D’Odorico, 1980; Raymond et al., 1980, 1981, 2001; Blair et al., 1991). Subsequent investigations, focused on fainter filaments (Raymond et al., 1983; Long et al., 1992; Sankrit et al., 2000; Sankrit & Blair, 2002), have shown the complexities involved including the effects of geometry, shock incompleteness, resonance line scattering, dust grain destruction.
FUV observations of the entire Cygnus Loop are of great interest because they provide a global understanding of the interaction between the X-ray and optical emitting components. Carruthers & Page (1976) obtained images from a portion of the Cygnus Loop in two broad bands (1250–1600 and 1050–1600Å). Blair et al. (1991) and Rasmussen & Martin (1992) have produced skymaps with nearly complete coverage of the Cygnus Loop, measured at O VI 1032, 1038. Observations of five 40 diameter fields around the Cygnus Loop rim with higher spatial resolution were obtained with the UIT (Cornett et al., 1992; Danforth et al., 2000).
We report the first FUV spectral line images of the entire Cygnus Loop, These images, with spatial resolution of 3 to 30, were obtained with SPEAR (The Spectroscopy of Plasma Emission from Astrophysical Radiation), also known as FIMS (Far-ultraviolet IMaging Spectrograph). We describe how these data reveal physical conditions in the remnant and complement earlier observations.
2 Observations and Analysis
SPEAR is a dual-channel FUV imaging spectrograph (Short channel ‘S’: 900–1150Å, Long channel ‘L’: 1330–1720Å, ) with a large field of view (S channel: 4.0, L channel: 7.5), designed to observe diffuse FUV emission lines. SPEAR is the primary payload on the first Korean Science and Technology SATellite (STSAT-1) and was launched into a 700 km sun-synchronous orbit on 27 September 2003. The SPEAR instruments, their on-orbit performance, and the basic processing of instrument data are described in detail by Edelstein et al. (2005a, b).
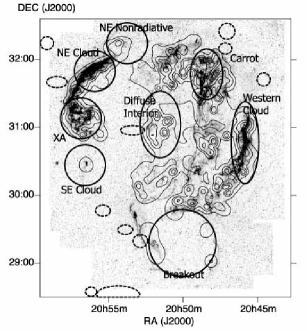
The Cygnus Loop was observed during 30 orbits between July 12 and July 22, 2004. Of these, we used 11 orbits that include reliable attitude knowledge of 30. The observation, totaling 6067 seconds, were taken in the 10% slit transmission mode. A total of 1.6105 events were recorded. The Cygnus Loop was observed by scanning the region along the 4.5 directions of the SPEAR field of view with the field oriented nearly parallel to the sky coordinate. The aspect for these data was determined by comparing the positions of observed bright stars with the TD-1 catalog (Thompson et al., 1978). The position errors of the bright stars along the scanning () and spatial direction () directions were considered as functions of , ignoring errors in position angle. The corrected positions of the bright stars coincided to within 5 of their TD-1 positions. Position errors of all photons were interpolated linearly from the bright stars’ position errors. All the photon events near the locations of the 11 brightest TD-1 stars were removed to avoid stellar contamination. The removed star pixels are indicated in Figure 1, together with the names of characteristic SNR features. Exposure maps were created by accumulating time-marked exposure event records to the sky (Edelstein et al., 2005b). Although the O VI emission line from the Cygnus remnant is apparent in a preliminary analysis, we do not further discuss the S channel data here because difficult statistics require more extensive analysis.
To generate a net emission-line image, we fit the spectrum in each pixel with a constant continuum plus a spectral resolution-width Gaussian function, fixed at the corresponding emission line center. The approach, basically an application of a Bayesian method to estimate signal amplitude in the presence of background assuming Poisson statistics (Sivia, 1996), avoids over-subtraction that can occur by simply using line-adjacent spectral regions for continuum removal. The SPEAR Cygnus Loop images obtained are sparsely occupied – pixels may contain only a few counts. To better estimate the surface brightness distribution, we rebinned the images using a Gaussian function with a position-variable angular scale through an adaptive kernel method similar to that of Huang & Sarazin (1996) and Ebeling, White, & Rangarajan (2000). The method overcomes fixed-size rebinning limitations that occur when surface brightness or noise vary significantly across the image.
3 Results
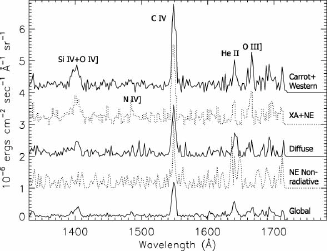
The SPEAR FUV spectra from the entire Cygnus Loop SNR region and from the characteristic features indicated in Figure 1 are shown in Figure 2. A background spectrum has been subtracted using the data obtained from nearby faint skies. The spectra clearly shows lines of many different ions including C IV, He II, and N IV], and the unresolved line complexes from Si IV+O IV] and O III]. It is also evident that the absolute and relative intensity of emission lines vary between the regions. Table 1 shows the reddening corrected FUV line luminosities for each region as well as those averaged over the entire SNR. A distance of 440 pc is assumed for their estimations (Blair et al., 1999). The C III, O VI, and X-ray luminosities, which are scaled to the distance of 440 pc from the originally published values (Blair et al., 1991; Ku et al., 1984), are also shown for comparison. The C IV luminosity is a bit larger that the total 0.1–4 keV X-ray luminosity.
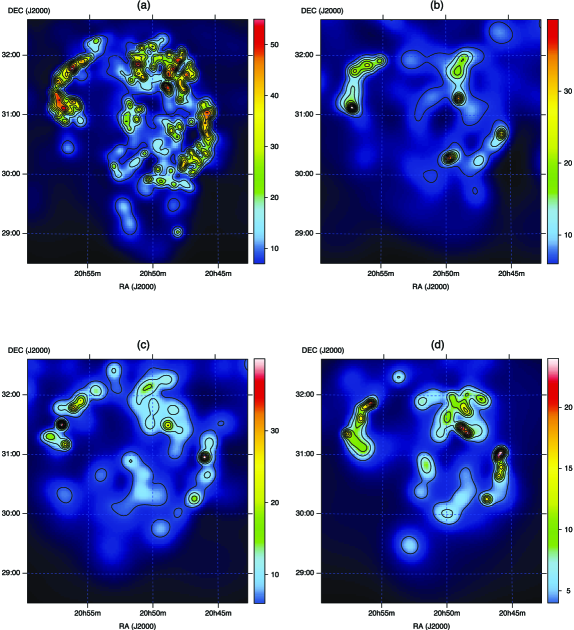
Figure 3 shows the spectral images of the entire Cygnus Loop obtained with SPEAR for the C IV (1548, 1550Å), O III] (1661, 1667Å), He II (1640Å) and Si IV+O IV] (1393, 1404Å, unresolved). The 0.03∘sky coordinates (, ) were binned with smoothing kernel scales of 3 to 30 (1 width). To derive the C IV spectral image intensity, we have assumed 2:1 line ratio for 1548Å and 1550Å doublet lines applicable to a thin plasma. For the Si IV+O IV] spectral image intensity, we assumed two Gaussian lines having a 1:5.5 line ratio centered at 1393 and 1404Å. These line ratios were selected by averaging line ratios observed with HUT (Blair, Sankrit, & Tulin, 2002). Similarly, the O III] lines are assumed to be formed in a doublet at 1661 and 1666 in the ratio of their statistical weights (0.41:1). Signal to noise ratios of line intensities enclosed by the contours shown in Figure 3 are higher than at least two. Although all of the FUV emission line images are generally similar, differences in their detailed features are indeed apparent as discussed below.
We compare the FUV spectra with models (Hartigan, Raymond, & Hartmann, 1987) that estimate spectral line ratios as functions of shock velocity. The models, while generated to predict parameters for regions of higher density than encountered here, produce the correct relative line intensities for the Cygnus region (Cornett et al., 1992; Blair et al., 1991). The model results can also be complicated by many effects, such as superposition of features, multiple shock velocities, and resonance scattering (Raymond et al., 1981; Danforth et al., 2000). Shock velocities for each image pixel were calculated from various FUV line ratios that were dereddened using (Miller, 1974) and the average extinction curve of Cardelli, Clayton, & Mathis (1989). The resulting shock velocities were found to be 105–130, 90–100, and 140–180 km s-1, from the line ratios of C IV to O III], C IV to He II, and O IV] to O III], respectively. Here, the line intensity of O IV] was calculated from the intensity of Si IV+O IV] assuming their line ratio of 1:5.5. In most parts of the SNR, the O IV]/O III] estimated shock velocity was in the range of 140–160 km s-1. Relatively uniform shock velocity distributions were obtained except in the brightest position of the XA region where an estimated velocity of 180 km s-1 was found from the O IV]/O III] ratio. Danforth, Blair, & Raymond (2001) found substantially different line ratios of Si IV to O IV at the XA region from the values of Blair, Sankrit, & Tulin (2002). Adopting the line ratio at the XA region, we found no such high velocity region.
4 Discussions
Cornett et al. (1992) observed a 40′ diameter field named the “XA” region (Hester & Cox, 1986) and centered at , with UIT. They found the UIT feature closely follows a “bow shock” shape in Einsten HRI X-ray imagery. The contours in Figure 3 clearly show that the “XA” region is the brightest region of the Cygnus Loop in the FUV emissions considered here, although the brightest positions in the FUV line maps do not exactly coincide. Indeed, the “XA” region is seen to be brightest in many wavelengths. Hester & Cox (1986) suggested that the enhanced “XA” region X-ray emission is caused by a reflected shock resulting from a collision of the blast wave with a cloud such as that seen in H I maps of the area.
The northeastern (NE) cloud radiative filaments, north of the XA region, are clearly detected in the four FUV emission maps, although again with differing locations of maximum brightness which must indicates some range of morphological conditions. The H I associated with the NE cloud region has been identified by Leahy (2003). The H I is a clear evidence for the clouds that the Cygnus Loop shocks are interacting with. The NE cloud extends into the southern portions of the northeastern nonradiative field where filaments extend counterclockwise from the northern limb and can be seen prominently in H (e.g., Levenson et al., 1998). Portions of these filaments have been extensively studied by Raymond et al. (1983), Blair et al. (1991), and Long et al. (1992). Danforth et al. (2000) presented an FUV image of the nonradiative filaments with the UIT B5, which they conclude is a mixture mainly of C IV and two-photon emission. We observe C IV and He II emissions from the nonradiative region, as visible in Figures 2 and 3. Comparison of the C IV map with the H maps of Levenson et al. (1998) (see Fig. 1(a)) shows that the C IV emission follows the overall features of the H emission. The reddening-corrected flux of C IV we observe correspond to a surface brightness of ergs cm-2 s-1 sr-1, consistent with the value, ergs cm-2 s-1 sr-1, from the “south shock” nonradiative front observed with HST STIS (Sankrit et al., 2000), and a somewhat less than the value, ergs cm-2 s-1 sr-1, obtained with the HUT (Long et al., 1992). Our maximum C IV flux value is a factor of 3 below that reported by Raymond et al. (1983) and observed in the “bright shock” with the STIS (Sankrit et al., 2000). We attribute this variation to the observatories different fields of view. We also note the relative weakness or nondetection of Si IV+O IV] and O III] emissions in the nonradiative regions, as can be seen in Figures 1(b) and 1(d). Radiative filaments show lines of many different ions while nonradiative filaments show only lines of the highest-ionization species (Long et al., 1992; Danforth et al., 2000). Thus, we might conclude that the C IV and He II emissions observed here originate primarily from nonradiatve shocks, although the SPEAR spatial resolution does not allow a clear separation between non-radiative and radiative regions.
The interior of the Cygnus Loop contains diffuse emission and filaments. One noticeable interior feature in the FUV images (Fig. 2) is the “carrot” (at , ), seen as a somewhat isolated vertical group of filaments in the O III] image. A bright spot in the “carrot” (at , ) coincides in all four FUV spectral images. Another region of diffuse emission in the C IV, He II, and Si IV+O IV] maps, also visible in optical images, runs north-south across the center of the remnant, around , .
The western filaments were also detected in the four FUV emission lines, for which the spatial features generally coincide. Ku et al. (1984) found an X-ray bow-shaped shock front or a “V” feature on the southwest limb, which has no optical counterparts. Aschenbach & Leahy (1999) noted that the “V” feature has a cool right wing, and a hot left wing. A 1420-MHz image (Leahy, Roger, & Ballantyne, 1997) shows radio continuum emission coincident with the “V” feature that is particularly bright along the eastern side. The C IV image in Figure 1(a) shows no counterparts to the “V” feature, although the images show a bright feature to the north of the “V”. The absence of optical and FUV counterparts implies that the X-ray and radio emission do not originate from dense radiative cooling regions but from hotter gas, as suggested by Leahy (2004).
The breakout is the most significant departure from circularity in the remnant. Leahy (2002) discusses H I observations of the Cygnus Loop which show two cavities for the northern main part and the southern ‘breakout’ part, which are at two different velocities, and suggests that the cause may be either one supernova explosion interacting with two blister regions or two separate explosions. The C IV image (Fig. 3) shows the south breakout region, particularly in its eastern portion. The western region of the breakout is also weakly detected in the C IV map. Figure 1(d) also shows marginal detection of the eastern region of the breakout in Si IV+O IV] emission.
We also note that the southeastern (SE) cloud was detected in C IV and He II emissions. The region is an example of a cloud that is extended along the line of sight but is not necessarily large across the plane of the sky Levenson et al. (1998). The H I cloud associated with the SE region has been identified by Leahy (2005). The boundary of the southeast corner and brightest part of the H I ring matches the boundary of the X-ray emission and of the optical and FUV emissions of the southeast knot.
As column density increases, the C IV and He II lines saturate due to resonance scattering effects, while the intermediate lines, such as O IV] and O III], show little attenuation. Cornett et al. (1992) and Danforth et al. (2000) found that resonance scattering in the strong FUV permitted lines is widespread in the Cygnus Loop, especially in the bright optical filaments. In this context, the line ratio O IV]/O III] is an ideal diagnostic for shock velocities. The ratio is also insensitive to elemental abundance, as both lines arise from the same element. The ubiquity of O VI emission found by Blair et al. (1991) implies that shocks with velocity greater than 160 km s-1 are widespread throughout the SNR. The shock velocity estimated, using the ratio O IV]/O III], confirms that fast shocks are widespread in the Cygnus Loop. In fact, the Si IV to O IV] ratio, used in the derivation of O IV] line intensity, varies with shock velocity (Sankrit, Blair, & Raymond, 2003). Using the ratio 1:2 at shock velocity of 120 km s-1, we obtained the same shock velocity range. Danforth, Blair, & Raymond (2001) found, from a detailed analysis of the XA region, that a significant column depth is present at all positions, including those not near bright optical or UV filaments. The lower velocity values obtained here from the ratio C IV/O III] and (even lower from) C IV/He II, together with relatively uniform velocity-distributions, also indicate that the resonance scattering in FUV permitted lines is widespread across the Cygnus Loop.
5 Concluding Remarks
The SPEAR FUV spectral images of the Cygnus Loop offer a new view of the SNR physical environment and conditions. We find that the remnant’s projected diffuse interior, “carrot”, breakout region, and periphery show correlated FUV, optical, X-ray, and radio emission. The FUV emission can be well explained by the scenario wherein the Cygnus Loop has been created by a cavity explosion (Levenson et al., 1997), with the presence of large clouds around its periphery (Hester & Cox, 1986; Hester, Raymond, & Blair, 1994; Leahy, 2002). Further study of these SPEAR data will provide insight into the overall shock energetics through a more detailed comparison with earlier observations. These data will be particularly important for studying the NE nonradiative shock, where an additional set of SPEAR short-wavelength data is expected to reveal large-scale features of O VI emission.
References
- Arendt, Dwek, & Leisawitz (1992) Arendt, R., Dwek, E., & Leisawitz, D. 1992, ApJ, 400, 562
- Aschenbach & Leahy (1999) Aschenbach, B., & Leahy, D. A. 1999, A&A, 341, 602
- Benvenuti, Dopita, & D’Odorico (1980) Benvenuti, P., Dopita, M., & D’Odorico, S. 1979, Nature, 277, 99
- Blair et al. (1991) Blair, W. P., Long, K. S., Vancura, O., & Holberg, J. B. 1991, ApJ, 374, 202
- Blair et al. (1999) Blair, W. P., Sankrit, R., Raymond, J. C., & Long, K. S. 1999, ApJ, 118, 942
- Blair, Sankrit, & Tulin (2002) Blair, W. P., Sankrit, R., & Tulin, S. 2002, ApJS, 140, 367
- Bohigas, Sauvageot, & Decourchelle (1999) Bohigas, J., Sauvageot, J. L., & Decourchelle, A. 1999, ApJ, 518, 324
- Cardelli, Clayton, & Mathis (1989) Cardelli, J. A., Clayton, G. C., & Mathis, J. S. 1989, ApJ, 345, 245
- Carruthers & Page (1976) Carruthers, G. R., & Page, T. 1976, ApJ, 205, 397
- Cornett et al. (1992) Cornett, R. H., Jenkins, E. B., Bohlin, R. C., Cheng, K.-P., Gull, T. R., O’Connell, R. W., Parker, R. A. R., Soberts, M. S., Smith, A. M., Smith, E. P., & Stecher, T. P. 1992, ApJ, 395, L9
- Danforth et al. (2000) Danforth, C. W., Cornett, R. H., Levenson, N. A., Blair, W. P., Stecher, T. P. 2000, ApJ, 119, 2319
- Danforth, Blair, & Raymond (2001) Danforth, C. W., Blair, W. P., & Raymond, J. C. 2001, ApJ, 122, 938
- D’Odorico et al. (1980) D’Odorico, S., Benvenuti, P., Dennefeld, M., Dopita, M. A., & Greve, A. 1980, ApJ, 92, 22
- Ebeling, White, & Rangarajan (2000) Ebeling, H., White, D. A., & Rangarajan, F. V. N. 2000, MNRAS, submitted. Chandra TCD user guide (2001)
- Edelstein et al. (2005a) Edelstein, J., FIMS teams, 2005a, ApJ, this volume.
- Edelstein et al. (2005b) Edelstein, J., FIMS teams, 2005b, ApJ, this volume.
- Hartigan, Raymond, & Hartmann (1987) Hartigan, P., Raymond, J. C., & Hartmann, L. 1987, ApJ, 316, 323
- Hester & Cox (1986) Hester, J. J., & Cox, D. P. 1986, ApJ, 300, 675
- Hester, Raymond, & Blair (1994) Hester, J. J., Raymond, J. C., & Blair, W. P. 1994, ApJ, 420, 721
- Huang & Sarazin (1996) Huang, Z., & Sarazin, C. L. 1996, ApJ, 461, 622
- Ku et al. (1984) Ku, W. H.-M., Kahn, S. M., Pisarski, R., & Long, K. S. 1984, ApJ, 278, 615
- Levenson et al. (1997) Levenson, N. A., et al. 1997, ApJ, 484, 304
- Levenson et al. (1998) Levenson, N. A., Graham, J. R., Keller, L. D., & Richter, M. J. 1998, ApJS, 118, 541
- Leahy, Roger, & Ballantyne (1997) Leahy, D. A., Roger, R. S., & Ballantyne, D. 1997, ApJS, 118, 541
- Leahy (2002) Leahy, D. A. 2002, AJ, 123, 2689
- Leahy (2003) Leahy, D. A. 2003, ApJ, 586, 224
- Leahy (2004) Leahy, D. A. 2004, MNRAS, 351, 385
- Leahy (2005) Leahy, D. A. 2005, AJ, 130, 165
- Long et al. (1992) Long, K. S., Blair, W. P., Vancura, O., Bowers, C. W., Davidsen, A. F., & Raymond, J. C. 1992, ApJ, 400, 214
- Miller (1974) Miller, J. S. 1974, ApJ, 189, 239
- McCray & Snow (1979) McCray, R., & Snow, T. P., Jr. 1979, ARA&A, 17, 213
- Rasmussen & Martin (1992) Rasmussen, A., & Martin, C., 1992, ApJ, 396, L103
- Raymond et al. (1980) Raymond, J. C., Black, J. H., Dupree, A. K., Harmann, L., & Wolff, R. S. 1980, ApJ, 238, 881
- Raymond et al. (1981) Raymond, J. C., Black, J. H., Dupree, A. K., Hartmann, L., & Wolff, R. S. 1981, ApJ, 246, 100
- Raymond et al. (1983) Raymond, J. C., Blair, W. P., Fesen, R. A., Gull, T. R. 1983, ApJ, 275, 636
- Raymond et al. (2001) Raymond, J. C., Li., J., Blair, W. P., Cornett, R. H. 2001, ApJ, 560, 763
- Sankrit et al. (2000) Sankrit, R., Blair, W. P., Raymond, J. C., & Long, K. S. 2000, AJ, 120, 1925
- Sankrit & Blair (2002) Sankrit, R., & Blair, W. P. 2002, ApJ, 565, 297
- Sankrit, Blair, & Raymond (2003) Sankrit, R., Blair, W. P., & Raymond, J. C. 2003, ApJ, 589, 242
- Sivia (1996) Sivia, D. S 1996, Data Analysis, A Bayesian Tutorial, (Clarendon Press: Oxford), pp37–52
- Thompson et al. (1978) Thompson, G. I., Nandy, K., Jamar, C., Monfils, A., Houziaux, L., Carnochan, D. J., & Wilson, R. 1978, Catalogue of Stellar Ultraviolet Fluxes: A Compilation of Absolute Stellar Fluxes Measured by the Sky Survey Telescope (S2/68) aboard the ESRO Satellite TD-1 (London: Science Research Council)
| Species | Carrot+Western | XA+NE | Diffuse | NE Nonradiative | Global |
|---|---|---|---|---|---|
| Si IV+O IV] (1400Å) | 0.670.18 | 0.520.16 | 0.260.10 | 6.60.6 | |
| C IV (1550Å) | 5.70.5 | 3.80.4 | 1.90.3 | 0.530.17 | 44.71.4 |
| He II (1640Å) | 0.540.17 | 0.210.12 | 0.340.12 | 0.150.09 | 6.80.6 |
| O III] (1664Å) | 0.880.24 | 0.550.20 | 0.350.14 | 6.50.8 | |
| C III (980Å) | 88.2 | ||||
| O VI (1035Å) | 150. | ||||
| X-ray (0.1–4.0 keV) | 35.9 |