OH maser disc and outflow in the Orion-BN/KL region
Abstract
MERLIN measurements of 1.6-GHz OH masers associated with Orion-BN/KL are presented, and the data are compared with data on other masers, molecular lines, compact radio continuum sources and infrared sources in the region. OH masers are detected over an area 30 arcsec in diameter, with the majority lying along an approximately E-W structure that extends for 18 arcsec, encompassing the infrared sources IRc2, IRc6 and IRc7. Radial velocities range from –13 to +42 km s-1. The system of OH masers shows a velocity gradient together with non-circular motions. The kinematics are modelled in terms of an expanding and rotating disc or torus. The rotation axis is found to be in the same direction as the molecular outflow. There is an inner cavity of radius 1300 au with no OH masers. The inner cavity, like the H2O ‘shell’ masers and SiO masers, is centred on radio source I. Some of the OH masers occur in velocity-coherent strings or arcs that are longer than 5 arcsec (2250 au). One such feature, Stream A, is a linear structure at position angle 45°, lying between IRc2 and BN. We suggest that these masers trace shock fronts, and have appeared, like a vapour trail, 200 yr after the passage of the runaway star BN. The radio proper motions of BN, source I and source n project back to a region near the base of Stream A that is largely devoid of OH masers. The 1612-MHz masers are kinematically distinct from the other OH masers. They are also more widely distributed and appear to be associated with the outflow as traced by H2O masers and by the 2.12-m emission from shocked H2. The magnetic field traced by the OH masers ranges from 1.8 to 16.3 mG, with a possible reversal. No OH masers were found associated with even the most prominent proplyds within 10 arcsec of Ori C.
keywords:
masers – polarization – magnetic fields – stars: formation – ISM: jets and outflows – ISM:individual: Orion-BN/KL1 Introduction
The Orion A molecular cloud (L1641) is the nearest giant molecular cloud (GMC) containing the nearest regions of massive star-formation. Because of its proximity it suffers little galactic extinction, and has been studied in far greater detail than other comparable regions in the Galaxy. The most recent formation of high–mass stars in the Orion GMC is within the Becklin–Neugebauer–Kleinmann–Low (BN/KL) region, about 1 arcmin Northwest from the Trapezium star Ori C. The explosive nature of this event is demonstrated dramatically by the infrared H2 and [FeII] images of Allen & Burton (1993) and more recently Kaifu et al. (2000). ‘Bullets’ of matter are being ejected at hundreds of km s-1 to form a bipolar cone of molecular ‘fingers’ whose axis is perpendicular to the hot core traced by NH3 emission (Wilson et al. 2000). These ‘fingers’ are tipped by Herbig–Haro (HH) objects whose shocked gas is visible at optical wavelengths (see Graham, Meaburn & Redman 2003 for a recent association of these phenomena).
At radio and millimetre wavelengths there are at least two molecular outflows, one associated with the optical and near-infrared features just described, and a second low-velocity outflow first detected through proper motions of H2O masers (Genzel et al. 1981). The powerful infrared source IRc2 was originally thought to be the source of the outflow, but more recent observations, in particular of SiO masers (e.g. Greenhill et al. 1998), suggest that radio continuum source I of Menten & Reid (1995) is the more likely outflow source. Source I is significantly offset (by 05) to the South of IRc2.
Source I and the radio counterpart to BN have proper motions away from each other, corresponding to transverse speeds of 12 and 27 km s-1 respectively (Plambeck et al. 1995; Rodríguez et al. 2005). Here and elsewhere we assume a distance of 450 pc. The radio proper motions indicate that BN and source I were within 225 au of each other 52530 years ago. Tan (2004) has suggested that the large proper motion of BN is due to its ejection from the Ori C system 4000 years ago. Bally & Zinnecker (2005) on the other hand propose that the motions of BN and I are the result of a stellar merger 500 years ago, which ejected BN and produced the energy powering the molecular outflow. Further analysis of the radio proper motion data by Gómez et al. (in press) shows that a third source n also has proper motions that project back to the position on the sky where BN and source I were close, 500 years ago. This raises the possibility that n is the third star dynamically neccessary to eject BN from the multiple system. Distinguishing between these different possibilities is crucial to understanding the history of recent star-formation in the region.
We have observed hydroxyl (OH) masers in the Orion-BN/KL region as part of an ongoing study of masers associated with molecular outflows from massive young stars (Hutawarkorn & Cohen 2005, and references therein). OH masers have the potential to trace physical conditions, including magnetic fields which are detected and measured through Zeeman splitting and OH maser polarization. Previous MERLIN OH observations by Norris (1984) detected 80 1665-MHz masers distributed over a region of 10 arcsec, which were interpreted in terms of a rotating torus surrounding IRc2. Johnston, Migenes & Norris (1989) detected 175 masers spread over a region of 20 arcsec, with the majority in an E-W structure 14 arcsec in extent. The masers were found in clusters or ‘clumps’ that correlated with NH3 emission. The present MERLIN observations more than double the number of OH masers known and show that the distribution is even more extensive in position and velocity (Section 3.1). The association of the masers with radio continuum sources is described in Sections 3.1 and 4.2, while the association with near- and mid-infrared sources is described in Section 3.3.
Secondary targets in the same MERLIN observations were the ‘proplyds’ (O’Dell, Wen & Hu 1993) in the vicinity of Ori C. These are the solar system–sized circumstellar envelopes discovered by Laques & Vidal (1979) which surround low–mass YSOs (Churchwell et al 1987; Meaburn 1988; McCaughrean & Stauffer 1994; O’Dell & Wong 1996; Bally et al. 1998a). These stellar cocoons have dusty molecular disks with dense ( 106 cm-3) surfaces ionized by the intense flux of Lyman radiation from Ori C (see Graham et al. 2002). In these circumstances maser emission could be anticipated from the molecular disks which, if detectable, could be an important tool for investigating proto-planetary environments. Upper limits for such emission are reported in Section 3.5.
2 Observations
The OH observations were performed on 1998 April 27 and 28 using seven telescopes of MERLIN (the Multi Element Radio Linked Interferometer Network): the 76-m Lovell Telescope and the Mk2 telescope at Jodrell Bank, and outstation telescopes at Pickmere, Darnhall, Knockin, Defford and Cambridge. The longest baseline was 218 km, giving a minimum fringe spacing of 0.16 arcsec. Observations covered all four ground-state OH transitions, namely 1612, 1665, 1667 and 1720 MHz. A spectral bandwidth of 500 kHz was used, corresponding to a velocity range of 90 km s-1. The spectral band was divided into 256 frequency channels, giving a velocity spacing of 0.35 km s-1. The radial velocity at the centre of the 500-kHz band was +28 km s-1 with respect to the local standard of rest (lsr). Left-left and right-right circularly polarized signals from each pair of telescopes were simultaneously correlated to give LL and RR.
The OH lines were observed in pairs, 1612 and 1667 MHz for 6.5 hours on 27 April 1998 and 1665 and 1720 MHz for 8 hours on 28 April 1998. Observations consisted of 5-min scans tracking the field centre RA(B1950) 05h32m49043, Dec. (B1950) –05°25′16003 at each OH line frequency interleaved with 4-min scans on the nearby unresolved phase calibrator source IC0539-057. Because of the faintness of the phase calibrator source it was necessary to observe it in 16-MHz bandwidth. Short 30-min scans of the point source amplitude and bandpass calibrator 2134+004 were also made. 2134+004 was also used to provide the flux scale (based on comparisons with 3C286).
The data processing and analysis procedures were carried out in B1950 coordinates, as described by Gasiprong, Cohen and Hutawarakorn (2002). Data were first edited, calibrated and corrected for gain-elevation effects using the Jodrell Bank d-programmes, and then passed into the AIPS software package. Within the AIPS package the data were further calibrated for all remaining instrumental and atmospheric effects including the instrumental polarization. Self-calibration imaging of a bright pointlike reference channel was employed to derive the final gain solutions for the 1665-MHz data. These gain solutions were then applied to the other channels. The 1612- and 1667-MHz data sets had poorer signal-to-noise and could not be self-calibrated, while at 1720 MHz no emission was detected at all. Finally, maps in each circular polarization (RHC and LHC) were produced using CLEAN algorithms in AIPS, with a restoring beam of 150 mas 150 mas. For each data cube the pixel size was 4545 mas2 and the total area mapped was 10241024 pixels2 (4646 arcsec2), centred on the position of IRc2. A second field of 512512 pixels (2323 arcsec2) centred on the position of Ori C was also searched for possible emission associated with the proplyds.
The rms-noise in the final maps was 30-50 mJy beam-1, so only masers brighter than 0.1 Jy could be detected. The masers were all unresolved at 150-mas resolution. Positions of maser features were determined by fitting two-dimensional Gaussian components to the brightest peaks in each channel map and taking flux-weighted means across the channels showing emission from each particular feature. Final B1950 coordinates of masers were then converted to J2000 using the software package coco. The errors in the relative positions are typically 10 mas, while the absolute positions have a possible systematic error of 20 mas due to phase-transfer from the reference source.
3 Results
3.1 Maser distribution in Orion-BN/KL
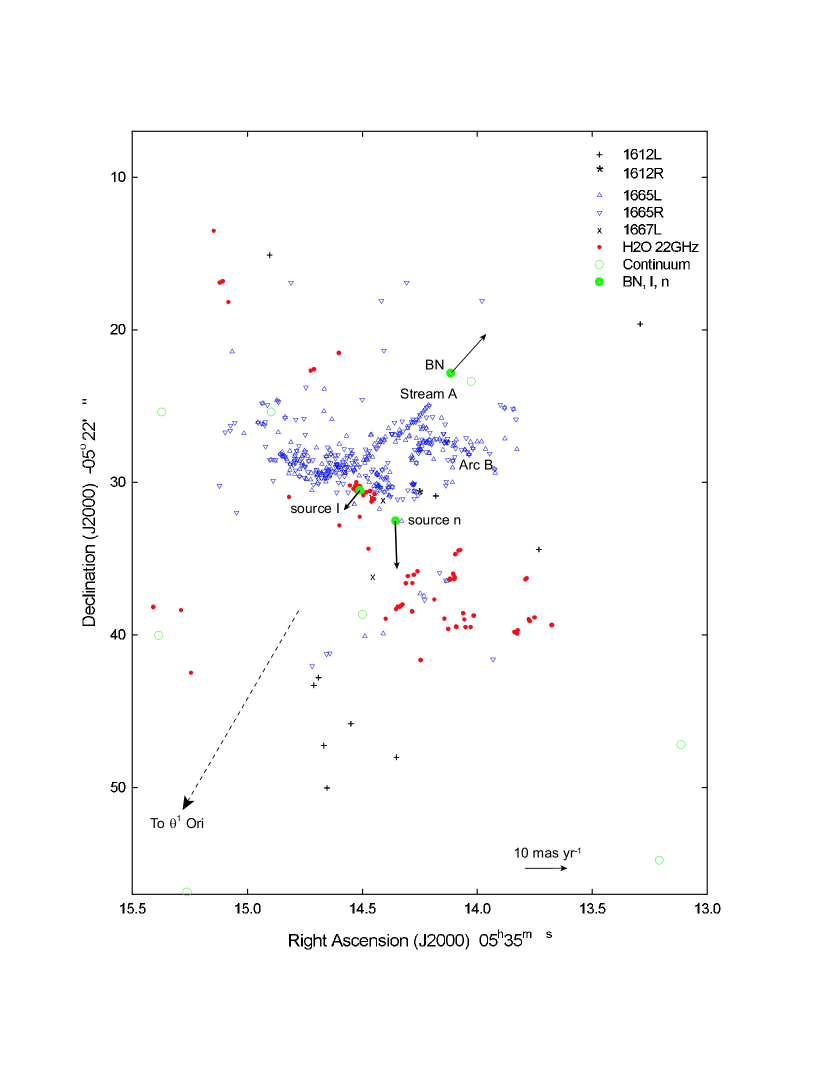
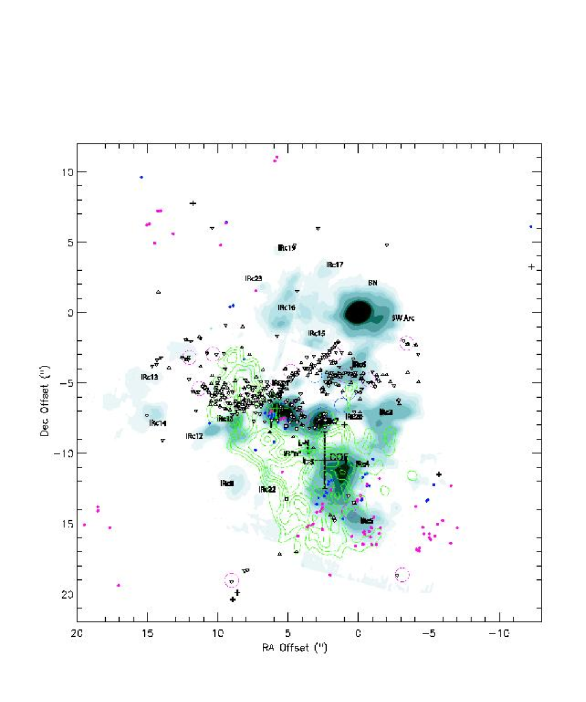
We detected 11 masers at 1612 MHz, 430 masers at 1665 MHz, 3 masers at 1667 MHz (LHC only) and no masers at 1720 MHz. The positions and velocities are given in Table 1. To facilitate comparison with other data, we give both the B1950 coordinates and the J2000 coordinates. The maser distribution is shown in Fig. 1 in J2000 coordinates. The OH masers are spread over a region 30 arcsec in extent, corresponding to 13500 au. The radial velocities range from –13 to +42 km s-1. The distribution is more extensive in both angular scale and velocity range than found in previous work. However most of the emission comes from the dominant E-W structure noted by Norris (1984) and Johnston et al. (1989).
One striking aspect of the new maps is that many of the OH masers lie in semi-continuous streams or arcs, of which the most prominent are labelled Stream A and Arc B in Fig. 1. Stream A stretches from RA (2000) 05h35m142, Dec. (2000) –05°22′25″to 05h35m145, –05°22′28″, and includes the maser ‘clump’ NW1 identified by Johnston et al. (1989). The radial velocities are approximately constant, around +212 km s-1. Arc B stretches from 05h35m141, –05°22′28″to 05h35m143, –05°22′28″, and includes the maser clumps NW2 and NW3 of Johnston et al. (1989). The radial velocities cover a wide range, from -7 km s-1 in the East to +10 km s-1 in the West. These streams or arcs are large-scale features, with angular sizes of 5 arcsec that correspond to 2250 au. We argue that they trace large-scale shocks or ionization fronts (Section 4.2).
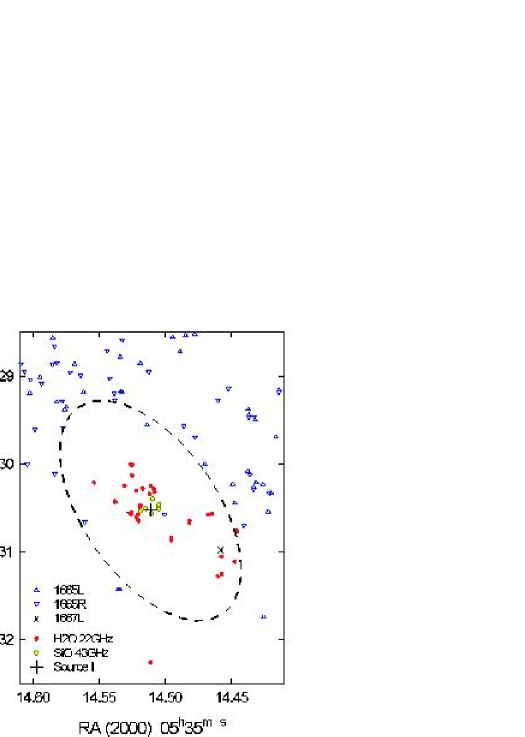
The distribution of H2O masers from Gaume et al. (1998) is also shown in Fig. 1. The OH and H2O masers have complementary distributions, with almost no overlap. An expanded plot of the crowded central region is shown in Fig. 2, revealing the same situation on the small scale. The H2O masers in this region are the so-called ‘shell’ masers that were not detected in the VLBI measurements by Genzel et al. (1981). There is an elliptical zone of avoidance centred on source I, within which there are very few OH masers, but the H2O ‘shell’ masers and SiO masers are found. The H2O ‘shell’ masers lie inside the dashed ellipse in the figure, while nearly all of the OH masers lies outside the ellipse. The position angle and inclination angle of the ellipse were chosen to match the model fitted to the OH masers in Section 4.1.
Fig. 2 also shows the positions of the SiO maser clusters mapped by Doeleman, Lonsdale & Pelkey (1999). The SiO masers cluster tightly around the position of the radio source I (Menten & Reid 1995), with the H2O ‘shell’ masers surrounding them. The relative location of SiO, H2O shell and OH masers at increasing distances from the central source I is similar to that found for these masers in the circumstellar envelopes of post-AGB stars, which has a natural explanation in terms of excitation by a powerful central source (Chapman & Cohen 1986).
The positions of compact radio continuum sources in the region are plotted in Fig. 1 as open green circles (data from Zapata et al. 2004), with sources I, n and BN highlighted as filled green circles. Apart from source I, which is at the centre of the SiO and H2O ‘shell’ maser distributions and the OH zone of avoidance, there is another association of OH masers with a compact radio continuum source that is noteworthy, namely a striking association between Stream A and BN. The stream points directly towards BN (away from IRc2), in the direction of BN’s proper motion (shown schematically by the arrow in Fig. 1). This is discussed further in Section. 4.2. Finally we note a possible weaker association of source D of Menten & Reid (1995) (source 21 of Zapata et al.), near RA (J2000) = 05h35m1490, Dec. (J2000) = –05°22′254, with a cluster of OH masers, corresponding to ‘clump NE1’ of Johnston et al. (1989). The radial velocities are centred near +8 km s-1.
Further study of Fig. 1 reveals that the OH 1612-MHz masers are distributed differently from the mainline 1665- and 1667-MHz masers. Most of the OH 1612-MHz masers are found a long way from the centre, in the outskirts of the OH maser region, and they are spatially separated from the other OH masers. Their far-flung distribution is strikingly different from that of the other OH masers, but similar to that of the H2O masers. This similarity is reinforced by kinematic similarities.
3.2 Maser kinematics
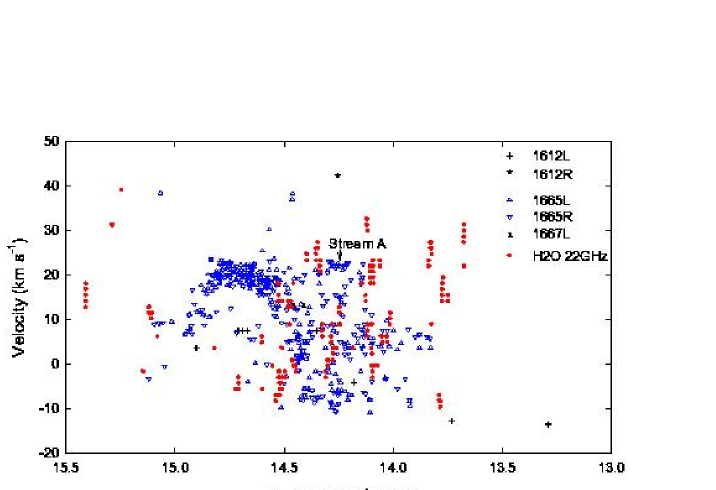
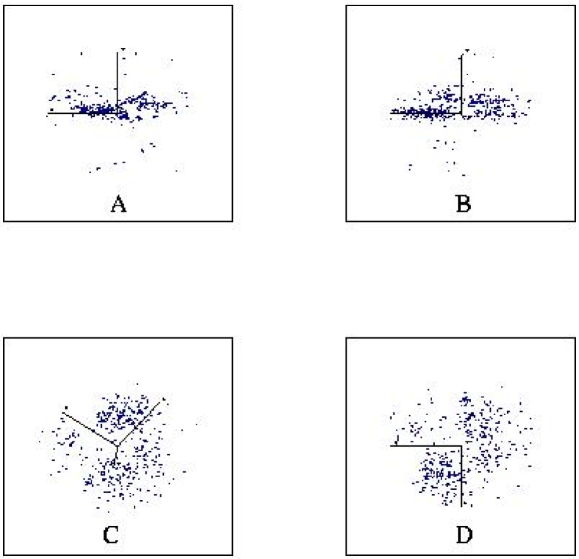
The complex kinematics of the Orion-BN/KL masers are summarized in the position-velocity diagrams Figs. 3 and 4. Fig. 3 shows RA vs. for the OH and H2O masers. There is a clear contrast between the two species: the OH masers show a dominant rotational pattern, in which the radial velocities drop from +20 km s-1 in the East to 0 km s-1 in the West, while the H2O masers show a dominant expansion pattern, with highly red-shifted or blue-shifted masers equally likely to occur to the East or West. This is consistent with the well known expansional proper motions of these masers (Genzel et al. 1981; Gaume et al. 1998). The OH rotational pattern is clearest at right ascensions greater than 05h35m145, and more disturbed at right ascensions less than this. Stream A has a velocity greatly different from the rotational pattern, as indicated in Fig. 3. We note that the radial velocity of Stream A, +21 km s-1, is the same as that of BN and its circumstellar nebulae within 25 au (Scoville et al. 1983).
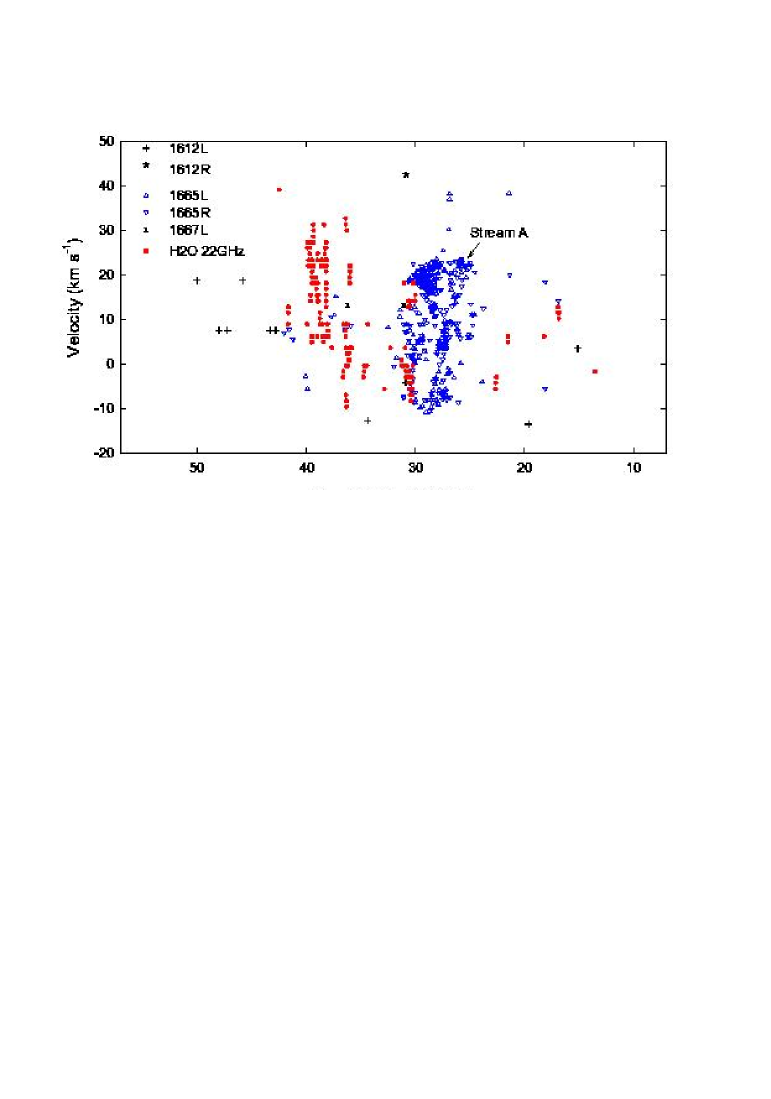
Fig. 4 shows a Dec- plot. The OH masers trace a dominant inclined elliptical pattern, centred on Dec. (2000) –05°22′29″and = +6 km s-1. Radial velocities rise abruptly from 0–10 km s-1 in the South to +20 km s-1 to the North of Dec. (2000) –05°22′29″. The ‘hole’ in the centre of the Dec- ellipse suggests that in addition to rotation there is an expansional component of motion of similar magnitude. The locations of OH and H2O masers in this diagram are again complementary.
The OH 1612-MHz masers are kinematically and spatially distinct from the 1665- and 1667-MHz masers. This is particularly clear in Fig. 4, where they are well separated in both declination and velocity, appearing at the extremes of both coordinates, well separated from the rotating and expanding ring signature of the mainline masers. The kinematic pattern is similar to but even more extensive than that of the H2O masers, suggesting that outflow rather than rotation is the dominant motion.
The OH distribution and kinematics are modelled in Section 4.1.
3.3 Comparison with Infrared Data
The distribution and kinematics of the dominant OH emission show a degree of symmetry about the position of IRc2 and radio source I, and a radial velocity of 8 km s-1, as noted by previous authors cited in the introduction. The OH masers encompass IRc2, 3, 6 and 7. The availability of high resolution infrared data allows us to examine in more detail the correspondences of the OH masers with the powerful mid-infrared sources and with near-infrared bullets in the molecular outflow.
3.3.1 Comparison with 12.5-m Keck and 11.7-m Gemini Data
Shuping, Morris & Bally (2004) have published a high resolution (038) mid-infrared image of the Orion BN/KL region obtained with the Keck I telescope at 12.5-m. Fig. 5 is a composite plot showing the OH masers (this paper) superimposed on Fig. 5 of Shuping et al. (2004). This shows several surprising results. Firstly, OH masers cluster around IRc2, but they avoid the actual source position (relative coordinates (+5″, –7″) in this diagram), which lies in the zone of avoidance noted in Section 3.1. Secondly, Stream A points directly away from IRc2 towards the dominant mid-infrared source BN (at the origin), at position angle 45°. Stream A runs through a region devoid of mid-infrared emission. The direction from IRc2 to BN is parallel to the proper motions recently measured for BN and radio source I by Rodríguez et al. (2005). It is also the projected direction of the large-scale molecular outflow. Thirdly, Arc B curves parabolically around the extended source IRc6 (near (+1″,–4″) in this figure), in a manner that suggests a close physical association. This confirms and extends the result of Johnston et al. (1989).
Smith et al. (2005) have published a high-resolution 11.7-m mosaic image of the inner Orion nebula obtained with the Gemini South telescope. The only close correlation (better than 2 arcsec) of any of the OH 1.6-GHz masers listed in Table 1 with the 11.7-m point sources listed by Smith et al. (2005) is the 1612L maser number 10, at RA (J2000) = 05h35m146533, Dec. (J2000) = -05°22′50022, which has a radial velocity of +18.9 km s-1. The corresponding IR source is at 05h35m1467, –05°22′495. Smith et al. (2005) describe the latter as ‘an embedded IR source with no optical ID’. None of the 27 known proplyds that correlate with 11.7-m point sources in Smith et al. (2005) are identified here as maser sources.
3.3.2 Comparison with 2.12-m Subaru Data
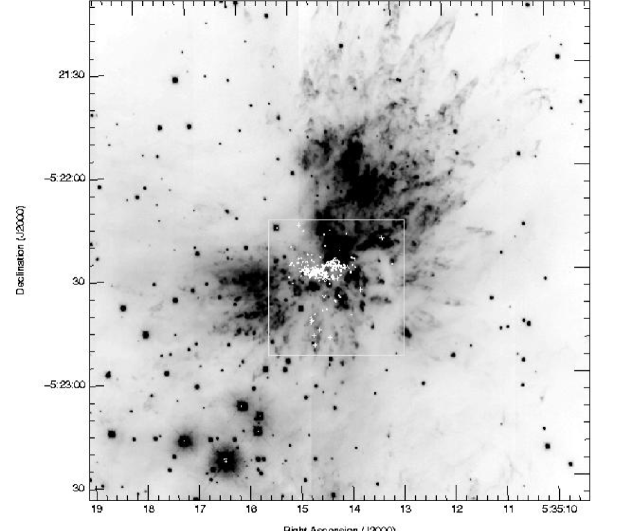
The locations of the OH masers relative to the well-studied molecular outflow are shown in Fig. 6. The infrared H2 2.12- images presented here were taken with the Subaru Telescope as part of its astronomical first light programme (Kaifu et al. 2000). The data were taken on 1999 January 11, 13 and March 6 using the Cooled Infrared Spectrograph and Camera for the OH-suppression spectrograph, CISCO (Motohara et al. 1998).
The 2.12-m image shown in Fig. 6 is a 150″ 150″section of the original mosaic (provided by Masa Hayashi). In order to overlay the OH maser positions onto the Subaru image, it was first necessary to astrometrically register the image with the J2000 coordinate system. This was done using stars from the catalogue of Hillenbrand & Carpenter (2000) and the Starlink gaia software package. A computer programme was then written to read the B1950 OH maser positions and convert them to J2000 coordinates using the Starlink Astrometry Library and produce a catalogue that was readable by the gaia software package. The positions were then overlaid using gaia.
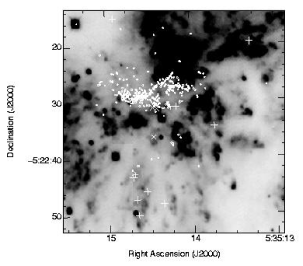
The 1665- and 1667-MHz masers (shown by dot and cross symbols respectively) are concentrated towards the highly obscured IRc2 region. In general they show little correspondence with features in the near-IR map. However the 1612-MHz masers (+) correspond with fingers of H2 emission in the molecular outflow. This association is seen more clearly in Fig. 7, which shows the central region on an expanded scale. The 1612-MHz masers show a strong association with fingers of H2 emission in the molecular outflow, particularly in the South, near RA (J2000) 05h35m147, Dec. (J2000) –05°22′46″, where 6 (half) of the 1612-MHz masers are found. Three 1665R masers (numbers 63, 64 and 76 in Table 1) are found nearby, and may also be associated. This is the first time that clear counterparts to interstellar OH masers have been seen. It is not clear, however, why these particular H2 emission fingers should have OH counterparts, while many others do not.
3.4 Zeeman Splitting and Magnetic Fields
| Zeeman | Transition | Vlsr | RA (1950) | Dec. (1950) | RA (2000) | Dec. (2000) | Spk | B |
|---|---|---|---|---|---|---|---|---|
| Pair | km s-1 | 05h32m s | –5∘:24′: ″ | 05h35m s | –5∘:22′: ″ | (Jy) | mG | |
| Z1 | 1665L | 21.98 | 46.8077 | 19.522 | 14.2830 | 26.065 | 0.18 | +1.8 |
| 1665R | 23.06 | 46.8102 | 19.504 | 14.2855 | 26.047 | 0.10 | ||
| Z2 | 1665L | 18.13 | 47.3239 | 21.992 | 14.7984 | 28.572 | 0.10 | +3.6 |
| 1665R | 20.24 | 47.3210 | 22.020 | 14.7954 | 28.600 | 0.38 | ||
| Z3 | 1665L | 15.67 | 46.7458 | 19.896 | 14.2210 | 26.434 | 0.14 | –3.5 |
| 1665R | 13.56 | 46.7487 | 19.915 | 14.2239 | 26.454 | 0.22 | ||
| Z4 | 1665L | 11.59 | 46.9193 | 23.131 | 14.3934 | 29.682 | 0.26 | +16.3 |
| 1665R | 1.96 | 46.9203 | 23.109 | 14.3944 | 29.660 | 0.10 | ||
| Z5 | 1665L | 0.30 | 46.8021 | 23.549 | 14.2761 | 30.092 | 0.58 | +3.6 |
| 1665R | 2.43 | 46.7989 | 23.565 | 14.2729 | 30.108 | 1.48 |
The data were searched for possible Zeeman pairs of opposite circular polarization, with radial velocities differing by more than 0.8 km s-1 (to exclude linearly polarized features) and lying within 30 mas of each other. The results are given in Table 2. We estimate the chance of a false association to be no more than 4 percent.
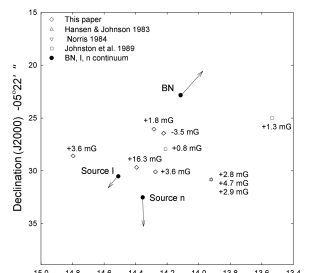
The magnetic fields range from –3.5 mG (directed towards us) to +16.3 mG. In Fig. 8 we plot the magnetic field values as a function of position on the sky, together with values from previous interferometric OH Zeeman measurements (Hansen & Johnston 1983; Norris 1984; Johnston et al. 1989). The present data suggest that in addition to the overall field of 1–3 mG directed away from us, there may also be regions of higher field strength (Z4), and that the field direction may reverse (Z3). The field reversal is seen at only a single point, and not on the larger-scale that is found in other bipolar outflow sources (Blaskiewicz et al. 2005; Hutawarakorn & Cohen 2005, and references therein). More data are needed to confirm these findings.
3.5 Search of the Proplyd Region
A search of a 23 arcsec23 arcsec region around Ori C was made, but no OH masers with peak flux densities 0.1 Jy were found, even near the most prominent proplyds (LV 1–6). The densities in these regions have been estimated to be 105–106 cm-3 (Section 4.4), which are typical of OH maser sources, while the temperatures are estimated to be 200–350 K (Hayward, Houck & Miles 1995), which are somewhat higher than usually encountered in OH maser sources (e.g. Cragg, Sobolev & Godfrey 2002). The non-detection of OH masers might be explained by a low OH column density, which could arise through chemical evolution (e.g. Rodgers & Charnely 2001).
4 Discussion
4.1 Kinematic Model for OH 1665-MHz Masers
For our kinematic modelling we used only the 1665-MHz masers. The celestial coordinates and radial velocities of the OH masers give incomplete information on the three-dimensional source geometry and motions. The OH maser positions are essentially the - and -components of each maser spot, but the -coordinate is unknown. The radial velocity of a maser is related to the unknown velocity field and the () coordinates of the maser. We modelled the source using a simple kinematic model which was fitted to the data using the Control Random Search technique (Price 1976). The model enables us to find the -coordinate for each maser from the radial velocity and the velocity field, and so produce a three-dimensional view of the OH maser distribution (Fig. 9).
We assumed, for modelling purposes, that IRc2 is at the kinematic centre. However the results would not be affected if radio source I were taken as the centre. We estimate that the kinematic centre of the OH masers is uncertain to 1 arcsec. The masers were assumed to have a uniform expansion velocity away from IRc2, centred on an unknown radial velocity , plus solid body rotation corresponding to at 1-arcsec separation from IRc2. The rotation axis is tilted by an angle about the -axis and an angle about the -axis from the plane (following Reid et al. 1988). The parameters , , , and were the five unknowns. For each maser and each position in the five-dimensional parameter space, we compared the observed and calculated radial velocity and found the -position where the absolute value of the residual was minimized (allowing the maser to lie anywhere along the -axis, with a distance corresponding to 30 arcsec of IRc2). The five-dimensional parameter space was searched, within a reasonable domain, using a random number generator to sample the parameters. The position in five-parameter space where the sum of the (absolute) velocity residuals is minimized was thereby located. The best fitting model has the parameter values given in Table 3. The angles correspond to a rotation axis inclined at 58°to the line-of-sight with a position angle on the sky of –35°. A disc at this orientation is plotted in Fig. 2, where it fits neatly inside the ‘hole’ in the OH maser distribution that is centred on source I.
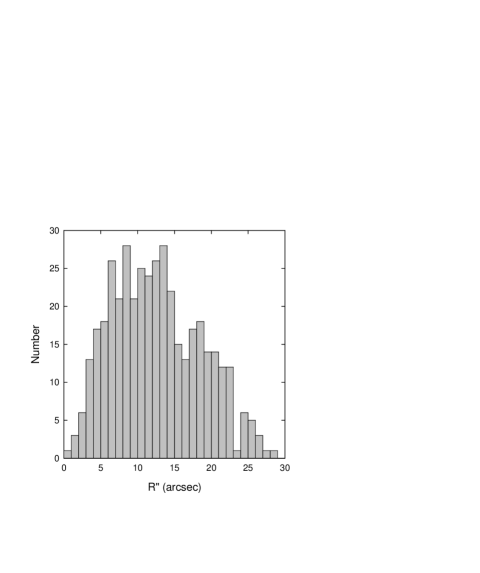
Using the kinematic model we constructed views of the three-dimensional distribution of OH 1665-MHz masers, which are shown in Fig. 9. The masers lie in an irregularly filled torus, at radial distances ranging from 430 au to 13200 au, with a mean radius of 6200 au. There is a well defined inner cavity, of radius 1300 au. This cavity corresponds spatially with the SiO flared disc region mapped by Wright et al. (1995, 1996), which has a radial velocity range of to +20 km s-1 that is roughly consistent with the range of to +30 km s-1 given by our kinematic model. The distribution in radial distance R″ from the rotation axis is plotted in Fig. 10. The distribution in the -direction, parallel to the rotation axis, has a full width to half maximum of 6000 au, and a total extent of 12000 au.
| Parameter | Search Range | Best fit |
|---|---|---|
| 15–32 km s-1 | 21.03.5 km s-1 | |
| 8–10 km s-1 | 9.00.5 km s-1 | |
| 1–5 km s-1 | 2.90.9 km s-1 | |
| 0–180° | 46°22° | |
| 0–90° | 48°19° |
The best-fitting expansion velocity is similar to that of the ‘low-velocity outflow’ seen in H2O masers (Genzel et al., 1981). Solid body rotation becomes the dominant motion beyond a distance of 3240 au from the centre (a distance corresponding to 7.2 arcsec). Rotation is therefore the dominant motion for most of the system of OH masers, with however a significant component of expansion. The rotational period in our model is 760 yr, while the expansion timescale varies from 300 yr for the inner edge of the maser cavity to 3000 yr for the masers most distant from the expansion centre.
Most of the Orion nebula HH–objects are found at the tips of the H2 ‘fingers’ in the bipolar outflow shown in Fig. 6 and appear to have their origin in a newly created massive star that gives rise to the infrared source IRc 2 in the 105 L⊙ Orion-BN/KL nebula in the OMC–1 cloud core. It has also been suggested that a minority of the prominent HH–objects have their origin in the neighbouring star forming region OMC–1S (Smith et al. 2004). However, excluding these few, Doi, O’Dell & Hartigan (2002) have used HST proper-motion measurements of the global expansion of the system of Orion HH–objects to demonstrate that the bipolar outflow is of Hubble type, i.e. the flow velocity is proportional to distance from the expansion centre. The bipolar flow therefore consists of ‘bullets’ all ejected around a 1000 yr ago in a single explosive event. Thus the expansion timescales determined for the OH masers bracket this H2 timescale. These results suggest that the OH maser disc acquired its expansional motions in the same event that produced the H2 bullets and the HH–objects found at the tips of the H2 ‘fingers’ in the bipolar outflow shown in Fig. 7.
The orientation of the rotation axis determined here agrees with that of the molecular outflow traced in CO and H2 (e.g. Chernin & Wright 1996; Kaifu et al. 2000). It also coincides with the direction of the proper motions of source I and BN, and is close to the large-scale magnetic field direction inferred from far-infrared and submillimetre polarization (Schleuning 1998 and references therein).
We note that the velocities of order 20 km s-1 implied by our kinematic model correspond to proper motions 9 mas yr-1, which could be measured by MERLIN within ten years.
4.2 The Nature of Stream A and Arc B
The major streams or arcs found in Orion-BN/KL have angular sizes greater than 5 arcsec, corresponding to projected sizes of at least 2250 au, which are almost unprecedented for interstellar OH masers. Stream A has no obvious counterpart in the infrared. However it points in the direction of the dominant infrared source BN, in the direction of the radio proper motions of BN and source I. Stream A has the appearance of a vapour trail that has formed in the wake of the runaway star BN. From the proper motion of BN and the projected separation from the Northern tip of Stream A we can infer a timescale of 200 yr. This may correspond to a cooling time, a formation time for OH, or a time for population inversion to be established following the passage of BN.
Fig. 1 shows that the proper motions of BN and sources I and n project back to a position on the sky near the base of Stream A, in a region largely clear of OH masers. This position is significantly displaced 4 arcsec Northwest of the centre of the OH maser torus. It has been suggested that BN and sources I and n originally belonged to a multiple stellar system that disintegrated 500 yr ago. The disintegration could have due to a close dynamical interaction, as suggested by Gómez et al. (in press), or it could have been due to a merger event that also produced the molecular outflow, as suggested by Bally & Zinnecker (2005). Alternatively, Tan (2004) has proposed that BN was ejected from the Ori C system 4000 yr ago. Our data do not distinguish unambiguously between these possibilities. However the fact that the large-scale OH maser torus is centred on source I slightly favours Tan’s scenario, with BN being a passing runaway from the Ori C system.
The other large-scale feature Arc B encloses IRc6, which is one of the cooler mid-IR sources, with polarization that is consistent with external illumination and with no evidence of embedded bright stars (Shuping et al. 2004 and references therein). This suggests that Arc B might be associated with a photodissociation zone around IRc6. In further support of this there is strong emission from CH3CH at the position of IRc6, implying densities of at least 106 cm-3 (Wilner, Wright & Plambeck 1996).
The large-scale maser structures found in Orion-BN/KL are similar in scale to OH maser structures recently reported in W3(OH). Wright et al. (2004a,b) noted several arcs of 18-cm masers, which they interpreted as propagating shocks. Harvey-Smith & Cohen (2005) found a low brightness filament of excited OH 4765-MHz emission stretching for 2200 au and clearly related in its morphology to some of the ground-state OH arcs at 18-cm wavelength. The structures seen in Orion are similar in linear scale. The individual maser spots in Stream A and Arc B are well separated on the sky for the most part, but are nevertheless likely to be simply the high-gain cores of an extended stream of maser emission. The typical flux densities of 0.1 Jy correspond to brightness temperatures of at least 3105 K.
All these large-scale features in Orion and W3(OH) are relatively weak and therefore below the sensitivies of earlier surveys, for the most part. Deeper observations of other well-known OH maser sources are needed to establish just how common such features are.
4.3 The 1612-MHz Masers
The OH 1612-MHz masers have a more widespread distribution than the other OH masers, and different kinematics (Section 3.2). This suggests that they trace a region with different physical conditions. Gray, Field & Doel (1992) give the following conditions for strong 1612-MHz masers: molecular hydrogen density = cm-3, 60 cm-3, gas kinetic temperature =30 K, dust temperature at maser site 30 K, external radiation field 80 K and velocity shift 2.0 km s-1. This is cooler than typical for OH masers, but is consistent with the location of these particular 1612-MHz masers further than normal from the main source of infrared luminosity. The velocity gradient needed for strong maser action is also consistent with the association of these masers with shocked gas in the molecular outflow (Section 3.3.2).
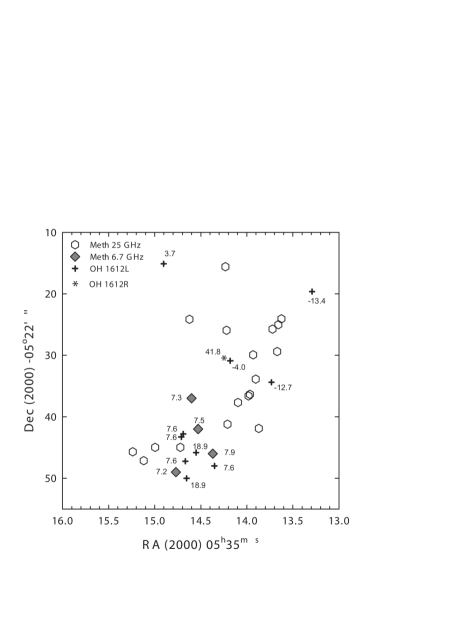
We note a further possible positional association between the 1612-MHz masers and the methanol 6.7-GHz masers recently discovered by Voronkov et al. (2005). In Fig. 11 we show the positions and velocities of the two species. There is a clear region of overlap centred around RA (J2000) = 05h35m145, Dec. (J2000) = -05°22′459 and = +7.5 km s-1. The 6.7-GHz positions have errors of 2 arcsec. It will be important to make 6.7-GHz measurements of higher precision to examine this correspondence more closely. The positions of 25-GHz masers from Johnston et al. (1997, 1992) are also shown in the figure for completeness. Only one of these falls in the region of interest. We note that there is no association with the OH mainline masers. This is consistent with the 25-GHz masers being class I masers, which are thought to be collisionally pumped (cf. Cragg et al. 2002).
The 6.7-GHz maser transition is the prototype class II maser, usually thought to be radiatively pumped. The 6.7-GHz masers in Orion are of therefore of interest because of their apparent association with 25-GHz masers. Voronkov et al. have considered the pumping requirements for the coexistence of both types of methanol maser and find that both types can occur simultaneously at low temperature (60 K) and low molecular hydrogen density (105 cm-3). These conditions are not too dissimilar to those needed for strong 1612-MHz masers, as given earlier. In summary, it appears that in Orion we may have the first examples of both methanol class II and OH ground state masers located far from the main source of infrared luminosity, and associated instead with the interaction between the molecular outflow and the surrounding gas.
4.4 Proplyd region
The proplyds originally designated LV 1–6 within the Orion Trapezium cluster are those most likely to exhibit maser emission for they are irradiated by the intense field of the O6.5 star Ori C. Of these LV 1, now resolved as a binary proplyd (168–326 NW & SE) by O’Dell & Wen (1994), and LV 2 (proplyd 167-317 of O’Dell & Wen 1994) have been most intensively observed (Graham et al. 2002; Henney et al. 2002 respectively).
The 81014 cm radius LV 2 was shown by Henney et al. (2002) to be irradiated by a flux of 3104 cm-2 s-1 Lyman photons. These produce an ionised skin with a measured electron density ne = 2.6106 cm-3 on the surface of a neutral disk or cocoon which envelopes the low mass YSO (Meaburn 1988). From 1.3-mm interferometric observations Bally et al. (1998b) deduce an upper limit to the mass of molecular hydrogen in this neutral component of 0.015 M⊙ to give an H2 density of no 4.2109 cm-3. On the other hand, simple pressure balance between the ionised and neutral gas with temperatures of Te = 104 K and To = 103 K would give n 5.2109 cm-3.
OH masers have yet to be found in regions of purely low-mass star-formation. However, it is this dense, circumstellar molecular gas around proplyds, stimulated by photons from Ori C, that is the potential source of any maser emission. We would expect to find OH masers at a distance of 71017cm from an O6.5 star (cf. Baart & Cohen 1985). However, if Keplerian motion around the YSO occurs in this neutral cocoon it will have a rotational velocity of 4 km s-1 at its outer edge with higher velocities towards the centre (proportional to radius-1/2). In these circumstances the velocity coherence required for strong maser amplification will occur over a path length that is much smaller than the overall radius of the proplyd. This, together with possible chemical effects (Section 3.5), could explain our non-detection of OH masers in this region.
5 Conclusions
The distribution of OH masers in the Orion-BN/KL region is far more extensive than previously realized, covering a region of 30 arcsec extent and a radial velocity range from –13 to +42 km s-1. The bulk of the emission can be modelled in terms of a rotating and expanding torus, centred on IRc2 or radio source I, with an inner cavity of 1300 au radius. The rotation axis has the same position angle and inclination to the line-of-sight as the molecular outflow and the large scale magnetic field inferred from mm- and submm-polarization (Section 4.1). The dynamical timescale is similar to that of the explosive event that produced the widespread shocked H2 emission. It is likely that the OH masers trace the interaction between the low-velocity molecular outflow and the molecular hot core, and that they acquired their expansional motions in the same event that produced the outflow.
Of particular interest is a string of masers, Stream A, at 21 km s-1, that extends at position angle 45°between IRc2 and BN, in the direction of the radio proper motions of these two dominant sources. We suggest that Stream A may have appeared, like a vapour trail, in the wake of the runaway star BN. The proper motions of BN and sources I and n project back to the base of Stream A (Fig. 1), 4 arcsec Northwest of the centre of the OH maser torus, a position that is largely devoid of masers.
The 1612-MHz masers have a more widespread distribution than the other OH masers, with kinematics that are more like those of the H2O masers associated with the outflow. Many of these 1612-MHz masers are spatially associated with fingers of shocked H2 emission (Fig. 7). These OH masers are thought to require relatively low gas and dust temperatures for their inversion (Section 4.3). Apart from the OH 1612-MHz masers, the other OH masers have complementary distributions and kinematics to the H2O masers (Figs. 1–4), with essentially no overlap. OH is also spatially and kinematically distinct from the class I methanol 25-GHz masers. A possible correspondence between OH 1612-MHz and class II methanol 6.7-GHz masers reported by Voronkov et al. (2005) requires further study at higher angular resolution.
The magnetic field strength in the OH maser regions ranges from 1.8 to 16.3 mG, with a possible field reversal (Section 3.4).
A search for OH masers associated with the proplyds around Ori C yielded only upper limits, which may indicate a low OH abundance in this more evolved region.
ACKNOWLEDGMENTS
We thank the anonymous referee for helpful comments and in particular for drawing our attention to the paper by Gómez et al. We thank Busaba Hutawarakorn for assistance with the data reduction, Ralph Shuping for providing a high resolution version of the Keck image in Fig. 5, and Masa Hayashi for providing high resolution Subaru data used in Figs. 6 and 7. NG gratefully acknowledges the Thai Astronomy Co-operative Research Network for their support. MERLIN is a national facility operated by the University of Manchester on behalf of PPARC.
References
- [] Allen D.A., Burton M. G., 1993, Nat, 363, 54.
- [] Baart E. B., Cohen R. J., 1985, MNRAS, 213, 641
- [] Bally J., Sutherland R. S., Devine D., Johnstone D., 1998a, AJ, 116, 293.
- [] Bally J., Testi L., Sargent A., Carlstrom J., 1998b, AJ, 116, 854.
- [] Bally J., Zinnecker H., 2005, AJ, 129, 2281.
- [] Blaskiewicz A., Szymczak M., Cohen R. J., Richards A. M. S., 2005, MNRAS, 361, 623.
- [] Chapman J. M., Cohen R. J., 1986, MNRAS, 220, 513
- [] Chernin L. M., Wright M. C. H., 1996, ApJ, 467, 676
- [] Churchwell E., Felli M., Wood D. O. S., Massi M., 1987, ApJ, 321, 516.
- [] Cragg D.M., Sobolev A.M., Godfrey P.D., 2002, MNRAS, 331, 521
- [] Doi T., O’Dell C. R., Hartigan P. 2002, AJ, 124, 445.
- [] Gasiprong N., Cohen R. J., Hutawarkorn B., 2002, MNRAS, 336, 47
- [] Gaume R. A., Wilson T. L., Vrba F. J., Johnston K. J., Schmid-Burgk J., 1998, ApJ, 493, 940
- [] Genzel R., Reid M. J., Moran J. M., Downes D., 1981, ApJ, 244, 884
- [] Gómez L., Rodríguez L. F., Loinard L., Lizano S., in press, astro-ph/0509201.
- [] Graham M. F., Meaburn J., Garrington, S. T., O’Brien T. J., Henney W. J., O’Dell C. R., 2002, ApJ, 570, 222.
- [] Graham M. F., Meaburn J., Redman, M. P., 2003, MNRAS, 343, 419
- [Gray etal 92 1992] Gray M.D., Field D., Doel R.C., 1992, A&A, 262, 555
- [] Greenhill L. J., Gwinn C. R., Schwartz C., Moran J. M., Diamond P. J., 1998, Nat, 396, 650
- [] Hansen S. S., Johnston K. J., 1983, ApJ, 267, 625
- [] Harvey-Smith L., Cohen R. J., 2005, MNRAS, 356, 637
- [] Hayward T. L., Houck J. R., Miles J. W., 1994, ApJ, 433, 157
- [] Henney W. J., O’Dell C. R., Meaburn J., Garrington S.T., López J. A., 2002, ApJ, 566, 315.
- [] Hillenbrand L. A., Carpenter J. M., 2000, ApJ, 540, 236
- [] Hutawarakorn B., Cohen R. J., 2005, MNRAS, 357, 338
- [] Johnston K. J., Migenes V., Norris R. P., 1989, ApJ, 341, 847,
- [] Johnston K. J., Gaume R. A., Stolovy S., Wilson T. L., Walmsley C. M., Menten K. M., 1992, ApJ, 385, 232
- [] Johnston K. J., Gaume R. A., Wilson T. L., Nguyen H. A., Nedoluha G. E., 1997, ApJ, 490, 758
- [] Kaifu N., et al., 2000, PASJ, 52, 1
- [] Laques P., Vidal J. P., 1979, AA, 73, 97.
- [] McCaughrean M. J., Stauffer J. R., 1994, AJ, 108, 1382.
- [] Meaburn J. 1988, MNRAS, 233, 791.
- [] Menten K. M., Reid M. J., 1995, ApJ, 445, L157
- [] Motohara K., et al. 1998, Proc. SPIE, Vol. 3354, 659-667, Infrared and Astronomical Instrumentation, ed. A. M. Fowler (International Society for Optical Engineering, USA)
- [] Norris R. P., 1984, MNRAS, 207, 127
- [] O’Dell C. R., Wen, Z., Hu, X 1993, ApJ, 410, 696.
- [] O’Dell C. R., Wen, Z. 1994, ApJ, 436, 194.
- [] O’Dell C. R., Wong K., 1996, AJ, 111, 846
- [] Plambeck R. L., Wright M. C. H., Mundy L. G., Looney L. W., 1995, ApJ, 455, L189
- [] Price W. L., 1976, Computer J., 20, 367
- [] Reid M. J., Schneps M. H., Moran J. M., Gwinn C. R., Genzel R., Downes D., Rönnäng, 1988, ApJ, 330, 809
- [] Rodgers S. D., Charnely S. B., 2001, ApJ, 546, 324
- [] Rodríguez L. F., Poveda A., Lizano S., Allen, C., 2005, ApJ, 627, L65
- [] Schleuning D. A., 1998, ApJ, 493, 811
- [] Scoville N., Kleinmann S. G., Hall D. N. B., Ridgway S. T., 1983, ApJ, 275, 201.
- [] Shuping, R. Y., Morris, M., Bally, J., 2004, AJ, 128, 363
- [] Smith N., Bally J., Shuping, R. Y., Morris M., Hayward T. L., 2004, ApJ, 610, L117.
- [] Smith N., Bally J., Shuping, Y., Morris M. and Kassis M., 2005, AJ, 130, 1763.
- [] Tan, J. C., 2004, APJ, 607, L47.
- [] Voronkov M. A., Sobolev A. M., Ellingsen S. P., Ostrovskii A. B., 2005, MNRAS, 362, 995.
- [] Wilner D. J., Wright M. C. H., Plambeck R. L., ApJ, 422, 642
- [] Wilson, T. L., Gaume, R. A., Gensheimer, P., Johnston, K. J., 2000, ApJ, 538, 665.
- [] Wright M. C. H., Plambeck R. L., Lundy L. G., Looney L. W., 1995, ApJ, 455, L185.
- [] Wright M. C. H., Plambeck R. L., Wilner D. J., 1996, ApJ, 469, 216.
- [] Wright M. M., Gray M. D., Diamond P. J., 2004a, MNRAS, 350, 1253
- [] Wright M. M., Gray M. D., Diamond P. J., 2004b, MNRAS, 350, 1272
- [] Zapata, L. A., Rodríguez, L. F., Kurtz, S. E., O’Dell, C. R., 2004, AJ, 17, 2252
| Transition | Feature | Velocity | RA(1950) | Dec(1950) | RA(2000) | Dec(2000) | Intensity |
|---|---|---|---|---|---|---|---|
| No. | (km s-1) | 05h32m s | –5∘:24′: ″ | 05hh35m s | –5∘:22′: ″ | (Jy beam-1) | |
| 1612L | 1 | –13.41 | 45.8137 | 13.153 | 13.2911 | 19.624 | 0.20 |
| 2 | –12.68 | 46.2592 | 27.890 | 13.7318 | 34.393 | 0.11 | |
| 3 | –3.97 | 46.7062 | 24.344 | 14.1800 | 30.880 | 0.20 | |
| 4 | 3.66 | 47.4242 | 08.524 | 14.9030 | 15.112 | 0.11 | |
| 5 | 7.64 | 46.8839 | 41.471 | 14.3521 | 48.019 | 0.09 | |
| 6 | 7.64 | 47.1993 | 40.678 | 14.6677 | 47.249 | 0.12 | |
| 7 | 7.64 | 47.2210 | 36.224 | 14.6908 | 42.797 | 0.12 | |
| 8 | 7.64 | 47.2417 | 36.726 | 14.7114 | 43.300 | 0.17 | |
| 9 | 18.93 | 47.0810 | 39.263 | 14.5499 | 45.826 | 0.08 | |
| 10 | 18.93 | 47.1858 | 43.452 | 14.6533 | 50.022 | 0.13 | |
| 1612R | 1 | 41.80 | 46.7773 | 24.354 | 14.2510 | 30.895 | 0.12 |
| 1665L | 1 | –10.70 | 46.6328 | 22.505 | 14.1072 | 29.035 | 0.14 |
| 2 | –10.42 | 46.7912 | 22.176 | 14.2656 | 28.718 | 0.24 | |
| 3 | –9.64 | 46.8095 | 22.013 | 14.2840 | 28.557 | 0.14 | |
| 4 | –9.64 | 47.0398 | 22.993 | 14.5139 | 29.553 | 0.34 | |
| 5 | –9.32 | 46.4472 | 22.867 | 13.9214 | 29.384 | 0.17 | |
| 6 | –9.11 | 46.7827 | 21.337 | 14.2574 | 27.878 | 0.13 | |
| 7 | –8.59 | 46.8077 | 23.509 | 14.2817 | 30.052 | 0.27 | |
| 8 | –8.24 | 46.4518 | 22.571 | 13.9261 | 29.088 | 0.12 | |
| 9 | –8.02 | 46.7338 | 21.544 | 14.2084 | 28.082 | 0.17 | |
| 10 | –7.88 | 46.6340 | 23.458 | 14.1080 | 29.989 | 0.24 | |
| 11 | –7.88 | 46.7335 | 21.526 | 14.2082 | 28.064 | 0.17 | |
| 12 | –7.88 | 46.6316 | 22.036 | 14.1061 | 28.566 | 0.20 | |
| 13 | –7.53 | 46.9440 | 20.729 | 14.4189 | 27.282 | 0.10 | |
| 14 | –7.53 | 46.9255 | 20.468 | 14.4005 | 27.019 | 0.11 | |
| 15 | –7.36 | 46.8692 | 20.569 | 14.3442 | 27.116 | 0.90 | |
| 16 | –7.36 | 46.9485 | 20.810 | 14.4234 | 27.364 | 0.13 | |
| 17 | –6.89 | 46.7149 | 21.956 | 14.1894 | 28.493 | 0.16 | |
| 18 | –6.83 | 46.7282 | 20.943 | 14.2031 | 27.480 | 0.12 | |
| 19 | –6.61 | 46.7719 | 21.301 | 14.2466 | 27.842 | 0.19 | |
| 20 | –6.13 | 46.7809 | 20.927 | 14.2558 | 27.468 | 0.17 | |
| 21 | –6.13 | 46.7442 | 20.854 | 14.2191 | 27.392 | 0.10 | |
| 22 | –5.83 | 46.8968 | 23.735 | 14.3707 | 30.284 | 0.73 | |
| 23 | –5.77 | 46.8065 | 21.846 | 14.2811 | 28.389 | 0.10 | |
| 24 | –5.77 | 46.7768 | 21.284 | 14.2516 | 27.825 | 0.14 | |
| 25 | –5.77 | 46.9090 | 23.745 | 14.3829 | 30.295 | 0.42 | |
| 26 | –5.69 | 46.7619 | 20.790 | 14.2368 | 27.329 | 0.26 | |
| 27 | –5.42 | 46.9295 | 20.677 | 14.4044 | 27.229 | 0.10 | |
| 28 | –5.42 | 46.9134 | 23.784 | 14.3873 | 30.335 | 0.69 | |
| 29 | –5.42 | 46.9386 | 33.358 | 14.4094 | 39.910 | 0.08 | |
| 30 | –4.37 | 46.8096 | 21.692 | 14.2842 | 28.236 | 0.09 | |
| 31 | –4.02 | 46.7662 | 21.057 | 14.2410 | 27.597 | 0.14 | |
| 32 | –3.89 | 47.1898 | 17.315 | 14.6658 | 23.886 | 0.28 | |
| 33 | –3.31 | 46.5602 | 21.601 | 14.0348 | 28.126 | 0.16 | |
| 34 | –2.96 | 46.9105 | 19.907 | 14.3857 | 26.458 | 0.15 | |
| 35 | –2.96 | 46.5629 | 21.625 | 14.0375 | 28.150 | 0.13 | |
| 36 | –2.61 | 47.0183 | 33.522 | 14.4890 | 40.080 | 0.10 | |
| 37 | –2.26 | 46.7894 | 20.575 | 14.2644 | 27.117 | 0.21 | |
| 38 | –1.91 | 46.8197 | 20.397 | 14.2948 | 26.941 | 0.22 | |
| 39 | –1.56 | 46.6744 | 21.334 | 14.1491 | 27.867 | 0.35 | |
| 40 | –1.56 | 46.8823 | 20.338 | 14.3574 | 26.887 | 0.12 | |
| 41 | –1.38 | 46.9594 | 23.707 | 14.4334 | 30.261 | 0.44 |
| Transition | Feature | Velocity | RA(1950) | Dec(1950) | RA(2000) | Dec(2000) | Intensity |
|---|---|---|---|---|---|---|---|
| No. | (km s-1) | 05h32m s | –5∘:24′: ″ | 05hh35m s | –5∘:22′: ″ | (Jy beam-1) | |
| 1665L | 42 | –0.85 | 46.8218 | 20.452 | 14.2968 | 26.997 | 0.42 |
| 43 | 0.30 | 46.8021 | 23.549 | 14.2761 | 30.092 | 0.58 | |
| 44 | 0.37 | 47.1572 | 19.302 | 14.6326 | 25.870 | 0.29 | |
| 45 | 0.46 | 46.9636 | 23.523 | 14.4376 | 30.077 | 1.84 | |
| 46 | 1.14 | 46.9246 | 22.479 | 14.3989 | 29.031 | 0.24 | |
| 47 | 1.61 | 46.9754 | 23.672 | 14.4493 | 30.228 | 0.13 | |
| 48 | 1.61 | 46.9424 | 23.138 | 14.4165 | 29.691 | 0.13 | |
| 49 | 1.61 | 46.9523 | 25.187 | 14.4258 | 31.740 | 0.13 | |
| 50 | 1.84 | 46.9463 | 23.766 | 14.4202 | 30.319 | 6.77 | |
| 51 | 2.99 | 46.9400 | 22.603 | 14.4142 | 29.156 | 1.25 | |
| 52 | 3.37 | 46.9964 | 23.444 | 14.4704 | 30.001 | 0.12 | |
| 53 | 3.37 | 46.5059 | 20.795 | 13.9808 | 27.317 | 0.11 | |
| 54 | 3.65 | 46.8365 | 20.701 | 14.3114 | 27.246 | 0.26 | |
| 55 | 3.70 | 46.9524 | 23.681 | 14.4263 | 30.235 | 1.25 | |
| 56 | 3.72 | 46.4051 | 20.615 | 13.8801 | 27.129 | 0.11 | |
| 57 | 3.72 | 46.3534 | 21.314 | 13.8281 | 27.825 | 0.10 | |
| 58 | 3.72 | 46.7119 | 20.664 | 14.1868 | 27.201 | 0.19 | |
| 59 | 3.89 | 46.5796 | 21.329 | 14.0543 | 27.855 | 0.57 | |
| 60 | 4.03 | 46.6630 | 20.911 | 14.1379 | 27.444 | 0.51 | |
| 61 | 4.07 | 46.5423 | 21.241 | 14.0171 | 27.765 | 0.14 | |
| 62 | 4.63 | 46.7483 | 20.876 | 14.2232 | 27.415 | 1.22 | |
| 63 | 4.69 | 46.6243 | 21.026 | 14.0991 | 27.555 | 0.35 | |
| 64 | 4.77 | 46.9233 | 23.267 | 14.3974 | 29.819 | 0.16 | |
| 65 | 4.77 | 46.6881 | 20.622 | 14.1631 | 27.157 | 0.15 | |
| 66 | 4.77 | 46.9581 | 22.943 | 14.4323 | 29.497 | 0.12 | |
| 67 | 4.77 | 46.5770 | 21.333 | 14.0518 | 27.859 | 0.10 | |
| 68 | 4.77 | 46.4888 | 21.276 | 13.9636 | 27.796 | 0.10 | |
| 69 | 4.77 | 46.7341 | 20.653 | 14.2091 | 27.191 | 0.14 | |
| 70 | 4.94 | 46.9280 | 24.075 | 14.4018 | 30.627 | 13.19 | |
| 71 | 5.58 | 46.9628 | 22.884 | 14.4370 | 29.438 | 1.35 | |
| 72 | 5.83 | 46.6159 | 20.657 | 14.0909 | 27.186 | 0.11 | |
| 73 | 5.83 | 46.3649 | 18.674 | 13.8405 | 25.185 | 0.10 | |
| 74 | 5.95 | 46.6308 | 21.075 | 14.1056 | 27.605 | 0.17 | |
| 75 | 6.53 | 46.9632 | 22.822 | 14.4374 | 29.376 | 0.13 | |
| 76 | 6.64 | 46.4056 | 18.590 | 13.8812 | 25.104 | 0.56 | |
| 77 | 6.66 | 46.9574 | 23.654 | 14.4313 | 30.207 | 3.54 | |
| 78 | 6.88 | 47.4785 | 19.472 | 14.9538 | 26.063 | 0.11 | |
| 79 | 7.29 | 46.9105 | 24.319 | 14.3842 | 30.870 | 2.03 | |
| 80 | 7.42 | 46.9717 | 20.929 | 14.4466 | 27.484 | 0.23 | |
| 81 | 7.59 | 46.5247 | 20.806 | 13.9996 | 27.329 | 0.12 | |
| 82 | 7.71 | 46.6617 | 29.943 | 14.1337 | 36.475 | 0.20 | |
| 83 | 7.70 | 46.8017 | 24.012 | 14.2755 | 30.555 | 0.26 | |
| 84 | 7.93 | 47.4563 | 19.610 | 14.9316 | 26.200 | 0.55 | |
| 85 | 8.36 | 46.8554 | 25.968 | 14.3286 | 32.514 | 0.31 | |
| 86 | 8.91 | 46.7967 | 24.106 | 14.2705 | 30.648 | 2.99 | |
| 87 | 8.98 | 46.9087 | 24.312 | 14.3824 | 30.863 | 1.57 | |
| 88 | 8.99 | 46.9060 | 22.794 | 14.3802 | 29.344 | 0.11 | |
| 89 | 9.06 | 46.9558 | 20.654 | 14.4307 | 27.207 | 0.40 | |
| 90 | 9.70 | 47.5408 | 20.189 | 15.0158 | 26.786 | 0.33 | |
| 91 | 9.81 | 46.5539 | 20.811 | 14.0288 | 27.336 | 0.37 | |
| 92 | 10.75 | 47.0620 | 24.863 | 14.5356 | 31.424 | 0.21 | |
| 93 | 10.75 | 47.3672 | 21.696 | 14.8418 | 28.279 | 0.14 |
| Transition | Feature | Velocity | RA(1950) | Dec(1950) | RA(2000) | Dec(2000) | Intensity |
|---|---|---|---|---|---|---|---|
| No. | (km s-1) | 05h32m s | –5∘:24′: ″ | 05hh35m s | –5∘:22′: ″ | (Jy beam-1) | |
| 1665L | 94 | 11.10 | 46.7601 | 30.912 | 14.2317 | 37.452 | 0.13 |
| 95 | 11.19 | 47.4566 | 18.226 | 14.9322 | 24.816 | 0.29 | |
| 96 | 11.21 | 47.3960 | 18.029 | 14.8717 | 24.615 | 0.38 | |
| 97 | 11.59 | 46.9193 | 23.131 | 14.3934 | 29.682 | 0.26 | |
| 98 | 11.89 | 47.4229 | 21.920 | 14.8973 | 28.508 | 2.17 | |
| 99 | 12.16 | 47.0610 | 24.863 | 14.5346 | 31.424 | 0.25 | |
| 100 | 12.55 | 46.9741 | 23.885 | 14.4479 | 30.440 | 2.50 | |
| 101 | 12.86 | 47.0105 | 21.980 | 14.4849 | 28.538 | 0.10 | |
| 102 | 12.94 | 46.9106 | 23.520 | 14.3846 | 30.071 | 0.50 | |
| 103 | 13.21 | 47.0528 | 21.892 | 14.5273 | 28.453 | 0.11 | |
| 104 | 13.21 | 46.9949 | 21.645 | 14.4695 | 28.202 | 0.19 | |
| 105 | 13.54 | 46.9486 | 23.990 | 14.4225 | 30.543 | 4.66 | |
| 106 | 13.56 | 46.9987 | 21.742 | 14.4733 | 28.299 | 0.37 | |
| 107 | 13.92 | 46.7596 | 19.790 | 14.2348 | 26.330 | 0.15 | |
| 108 | 15.15 | 46.7672 | 19.970 | 14.2424 | 26.510 | 0.10 | |
| 109 | 15.32 | 46.7762 | 30.758 | 14.2479 | 37.298 | 0.11 | |
| 110 | 15.67 | 46.7458 | 19.896 | 14.2210 | 26.434 | 0.14 | |
| 111 | 15.73 | 47.1206 | 22.445 | 14.5949 | 29.010 | 0.56 | |
| 112 | 15.81 | 47.0033 | 21.966 | 14.4778 | 28.523 | 0.33 | |
| 113 | 15.90 | 47.3826 | 21.547 | 14.8572 | 28.131 | 1.62 | |
| 114 | 16.23 | 47.0147 | 22.161 | 14.4891 | 28.719 | 0.69 | |
| 115 | 16.50 | 47.3545 | 21.873 | 14.8290 | 28.455 | 0.23 | |
| 116 | 16.86 | 47.3909 | 20.129 | 14.8660 | 26.714 | 0.15 | |
| 117 | 17.03 | 47.1812 | 21.727 | 14.6557 | 28.297 | 0.20 | |
| 118 | 17.08 | 47.3752 | 21.588 | 14.8498 | 28.172 | 0.15 | |
| 119 | 17.08 | 47.0071 | 21.910 | 14.4816 | 28.468 | 0.13 | |
| 120 | 17.22 | 47.1108 | 21.999 | 14.5853 | 28.564 | 0.18 | |
| 121 | 17.43 | 47.1021 | 22.817 | 14.5764 | 29.381 | 0.13 | |
| 122 | 17.43 | 47.3406 | 22.604 | 14.8149 | 29.185 | 0.12 | |
| 123 | 17.43 | 47.0877 | 22.617 | 14.5620 | 29.180 | 0.12 | |
| 124 | 17.61 | 47.2131 | 22.777 | 14.6873 | 29.349 | 0.28 | |
| 125 | 17.78 | 47.0585 | 22.618 | 14.5328 | 29.179 | 0.13 | |
| 126 | 17.78 | 47.1081 | 22.726 | 14.5824 | 29.291 | 0.14 | |
| 127 | 17.78 | 47.3509 | 22.000 | 14.8254 | 28.582 | 0.13 | |
| 128 | 17.78 | 47.1612 | 22.569 | 14.6355 | 29.137 | 0.10 | |
| 129 | 17.78 | 47.1809 | 21.706 | 14.6555 | 28.276 | 0.30 | |
| 130 | 17.78 | 47.2869 | 22.111 | 14.7614 | 28.688 | 0.11 | |
| 131 | 17.78 | 47.4061 | 21.989 | 14.8806 | 28.575 | 0.10 | |
| 132 | 17.91 | 47.0200 | 21.993 | 14.4945 | 28.552 | 0.42 | |
| 133 | 18.13 | 47.3239 | 21.992 | 14.7984 | 28.572 | 0.10 | |
| 134 | 18.13 | 47.1849 | 23.365 | 14.6589 | 29.936 | 0.24 | |
| 135 | 18.13 | 46.8631 | 20.019 | 14.3382 | 26.566 | 0.11 | |
| 136 | 18.13 | 47.0591 | 22.609 | 14.5334 | 29.170 | 0.11 | |
| 137 | 18.13 | 47.1708 | 23.045 | 14.6449 | 29.614 | 0.28 | |
| 138 | 18.13 | 47.2031 | 22.800 | 14.6773 | 29.372 | 0.15 | |
| 139 | 18.37 | 47.1359 | 22.256 | 14.6103 | 28.823 | 1.91 | |
| 140 | 18.45 | 47.3202 | 22.860 | 14.7944 | 29.441 | 0.74 | |
| 141 | 18.49 | 47.3692 | 21.736 | 14.8438 | 28.319 | 0.10 | |
| 142 | 18.49 | 47.2276 | 22.656 | 14.7019 | 29.229 | 0.14 | |
| 143 | 18.68 | 47.2708 | 23.175 | 14.7449 | 29.752 | 0.17 | |
| 144 | 18.77 | 47.1887 | 23.174 | 14.6628 | 29.745 | 0.38 | |
| 145 | 18.84 | 47.2506 | 23.248 | 14.7247 | 29.823 | 0.10 |
| Transition | Feature | Velocity | RA(1950) | Dec(1950) | RA(2000) | Dec(2000) | Intensity |
|---|---|---|---|---|---|---|---|
| No. | (km s-1) | 05h32m s | –5∘:24′: ″ | 05hh35m s | –5∘:22′: ″ | (Jy beam-1) | |
| 1665L | 146 | 18.84 | 47.0446 | 22.294 | 14.5190 | 28.854 | 0.10 |
| 147 | 19.19 | 47.2460 | 23.949 | 14.7199 | 30.524 | 0.10 | |
| 148 | 19.19 | 46.9805 | 21.779 | 14.4551 | 28.335 | 0.11 | |
| 149 | 19.28 | 47.3395 | 22.238 | 14.8139 | 28.820 | 1.13 | |
| 150 | 19.30 | 47.1008 | 22.783 | 14.5750 | 29.347 | 0.41 | |
| 151 | 19.39 | 47.1682 | 22.963 | 14.6424 | 29.532 | 0.73 | |
| 152 | 19.49 | 47.2982 | 22.553 | 14.7724 | 29.132 | 1.38 | |
| 153 | 19.54 | 47.1921 | 18.773 | 14.6676 | 25.344 | 0.82 | |
| 154 | 19.54 | 47.2170 | 23.168 | 14.6911 | 29.740 | 0.12 | |
| 155 | 19.72 | 47.1863 | 22.905 | 14.6604 | 29.476 | 0.65 | |
| 156 | 19.89 | 47.3449 | 22.840 | 14.8191 | 29.422 | 0.11 | |
| 157 | 20.00 | 47.2990 | 22.998 | 14.7731 | 29.576 | 0.39 | |
| 158 | 20.06 | 47.2813 | 22.322 | 14.7557 | 28.900 | 1.34 | |
| 159 | 20.22 | 47.2210 | 23.460 | 14.6950 | 30.033 | 0.38 | |
| 160 | 20.24 | 47.1731 | 22.703 | 14.6474 | 29.273 | 0.24 | |
| 161 | 20.24 | 47.3741 | 21.408 | 14.8487 | 27.992 | 0.20 | |
| 162 | 20.24 | 47.1283 | 22.622 | 14.6026 | 29.188 | 0.10 | |
| 163 | 20.25 | 47.3230 | 22.147 | 14.7975 | 28.728 | 0.35 | |
| 164 | 20.51 | 46.8612 | 20.236 | 14.3363 | 26.783 | 0.22 | |
| 165 | 20.60 | 47.1461 | 22.794 | 14.6203 | 29.362 | 0.09 | |
| 166 | 20.60 | 46.6794 | 19.235 | 14.1548 | 25.769 | 0.11 | |
| 167 | 20.60 | 47.1822 | 23.165 | 14.6563 | 29.735 | 0.10 | |
| 168 | 20.60 | 47.3399 | 21.344 | 14.8146 | 27.926 | 0.12 | |
| 169 | 20.81 | 47.2581 | 22.024 | 14.7326 | 28.600 | 0.52 | |
| 170 | 20.95 | 47.3357 | 20.783 | 14.8106 | 27.364 | 0.12 | |
| 171 | 20.95 | 47.2488 | 22.793 | 14.7230 | 29.368 | 0.11 | |
| 172 | 21.10 | 47.2681 | 23.215 | 14.7421 | 29.792 | 0.31 | |
| 173 | 21.10 | 46.7578 | 18.778 | 14.2334 | 25.318 | 0.12 | |
| 174 | 21.11 | 46.8273 | 19.902 | 14.3024 | 26.446 | 0.11 | |
| 175 | 21.19 | 47.2243 | 22.961 | 14.6984 | 29.534 | 0.29 | |
| 176 | 21.28 | 47.3091 | 21.994 | 14.7836 | 28.574 | 0.78 | |
| 177 | 21.30 | 47.0599 | 22.222 | 14.5343 | 28.784 | 0.11 | |
| 178 | 21.30 | 47.0945 | 22.299 | 14.5689 | 28.863 | 0.11 | |
| 179 | 21.30 | 46.8812 | 20.791 | 14.3561 | 27.340 | 0.14 | |
| 180 | 21.43 | 47.1741 | 22.606 | 14.6484 | 29.176 | 0.24 | |
| 181 | 21.65 | 47.0019 | 21.539 | 14.4766 | 28.096 | 0.10 | |
| 182 | 21.66 | 47.2872 | 21.697 | 14.7618 | 28.274 | 0.42 | |
| 183 | 21.98 | 46.8077 | 19.522 | 14.2830 | 26.065 | 0.18 | |
| 184 | 22.00 | 46.7810 | 19.400 | 14.2564 | 25.941 | 0.11 | |
| 185 | 22.06 | 47.1652 | 21.292 | 14.6399 | 27.861 | 0.58 | |
| 186 | 22.15 | 47.2621 | 21.690 | 14.7366 | 28.266 | 0.23 | |
| 187 | 22.21 | 46.7510 | 18.649 | 14.2266 | 25.188 | 0.32 | |
| 188 | 22.35 | 47.1823 | 22.474 | 14.6566 | 29.045 | 0.11 | |
| 189 | 22.35 | 47.2012 | 22.210 | 14.6756 | 28.782 | 0.10 | |
| 190 | 22.35 | 47.2252 | 21.153 | 14.6999 | 27.726 | 0.10 | |
| 191 | 22.45 | 47.3097 | 21.363 | 14.7844 | 27.942 | 0.22 | |
| 192 | 22.52 | 46.7363 | 18.380 | 14.2120 | 24.918 | 0.11 | |
| 193 | 22.52 | 47.1626 | 21.569 | 14.6372 | 28.137 | 1.16 | |
| 194 | 22.68 | 46.7764 | 19.147 | 14.2518 | 25.687 | 0.20 | |
| 195 | 22.70 | 47.2990 | 22.012 | 14.7734 | 28.591 | 0.10 | |
| 196 | 22.70 | 47.3204 | 21.683 | 14.7950 | 28.263 | 0.12 | |
| 197 | 22.89 | 47.2768 | 21.329 | 14.7515 | 27.906 | 0.24 |
| Transition | Feature | Velocity | RA(1950) | Dec(1950) | RA(2000) | Dec(2000) | Intensity |
|---|---|---|---|---|---|---|---|
| No. | (km s-1) | 05h32m s | –5∘:24′: ″ | 05hh35m s | –5∘:22′: ″ | (Jy beam-1) | |
| 1665L | 198 | 23.45 | 47.3606 | 19.136 | 14.8360 | 25.719 | 0.14 |
| 199 | 23.76 | 47.0703 | 21.506 | 14.5449 | 28.068 | 0.09 | |
| 200 | 25.52 | 47.1255 | 20.913 | 14.6003 | 27.479 | 0.12 | |
| 201 | 30.27 | 47.0935 | 20.382 | 14.5685 | 26.946 | 0.27 | |
| 202 | 37.12 | 46.9894 | 20.319 | 14.4644 | 26.876 | 0.11 | |
| 203 | 38.34 | 46.9856 | 20.301 | 14.4607 | 26.857 | 0.17 | |
| 204 | 38.53 | 47.5898 | 14.835 | 15.0666 | 21.435 | 0.10 | |
| 1665R | 1 | –10.64 | 46.7892 | 22.184 | 14.2636 | 28.725 | 0.15 |
| 2 | –8.94 | 46.7760 | 21.434 | 14.2507 | 27.975 | 0.13 | |
| 3 | –8.59 | 46.8107 | 23.575 | 14.2847 | 30.118 | 0.25 | |
| 4 | –8.59 | 46.8138 | 21.872 | 14.2884 | 28.415 | 0.11 | |
| 5 | –8.59 | 46.8852 | 19.533 | 14.3605 | 26.082 | 0.10 | |
| 6 | –8.08 | 46.4489 | 22.618 | 13.9232 | 29.135 | 0.19 | |
| 7 | –8.04 | 46.9381 | 20.614 | 14.4131 | 27.167 | 0.16 | |
| 8 | –7.88 | 46.6323 | 22.058 | 14.1068 | 28.589 | 0.12 | |
| 9 | –7.88 | 46.9518 | 20.971 | 14.4266 | 27.525 | 0.12 | |
| 10 | –7.53 | 46.8734 | 24.560 | 14.3471 | 31.108 | 0.16 | |
| 11 | –7.53 | 46.8974 | 20.259 | 14.3724 | 26.809 | 0.13 | |
| 12 | –7.27 | 46.8497 | 24.540 | 14.3234 | 31.086 | 1.72 | |
| 13 | –7.00 | 46.9321 | 20.761 | 14.4070 | 27.313 | 0.72 | |
| 14 | –6.83 | 46.7781 | 21.029 | 14.2529 | 27.570 | 0.12 | |
| 15 | –6.55 | 46.6520 | 22.005 | 14.1265 | 28.537 | 0.26 | |
| 16 | –6.48 | 46.7726 | 21.349 | 14.2473 | 27.889 | 0.20 | |
| 17 | –6.48 | 46.7973 | 21.298 | 14.2720 | 27.841 | 0.10 | |
| 18 | –6.23 | 46.6608 | 23.428 | 14.1349 | 29.960 | 1.18 | |
| 19 | –5.77 | 46.8957 | 23.757 | 14.3696 | 30.307 | 0.24 | |
| 20 | –5.77 | 46.7760 | 21.290 | 14.2507 | 27.831 | 0.11 | |
| 21 | –5.67 | 46.9149 | 23.815 | 14.3888 | 30.365 | 0.48 | |
| 22 | –5.42 | 46.5014 | 11.572 | 13.9793 | 18.093 | 0.09 | |
| 23 | –4.25 | 47.0269 | 24.013 | 14.5007 | 30.572 | 0.23 | |
| 24 | –3.89 | 46.6230 | 21.806 | 14.0976 | 28.336 | 0.18 | |
| 25 | –3.52 | 46.7739 | 20.874 | 14.2488 | 27.414 | 0.42 | |
| 26 | –3.31 | 46.5598 | 21.664 | 14.0344 | 28.189 | 0.26 | |
| 27 | –3.31 | 46.4710 | 21.594 | 13.9456 | 28.113 | 0.11 | |
| 28 | –3.31 | 47.6469 | 23.613 | 15.1208 | 30.217 | 0.10 | |
| 29 | –1.91 | 46.8620 | 20.278 | 14.3370 | 26.825 | 0.20 | |
| 30 | –1.35 | 46.9597 | 23.737 | 14.4336 | 30.291 | 0.93 | |
| 31 | –0.50 | 47.5735 | 25.373 | 15.0469 | 31.971 | 0.12 | |
| 32 | 0.02 | 47.1037 | 21.252 | 14.5785 | 27.816 | 1.82 | |
| 33 | 0.55 | 46.8028 | 23.592 | 14.2767 | 30.135 | 0.15 | |
| 34 | 0.72 | 46.9623 | 23.565 | 14.4363 | 30.119 | 3.03 | |
| 35 | 1.15 | 46.7232 | 20.962 | 14.1980 | 27.499 | 0.30 | |
| 36 | 1.87 | 46.9477 | 23.778 | 14.4216 | 30.331 | 4.29 | |
| 37 | 1.96 | 46.9203 | 23.109 | 14.3944 | 29.660 | 0.10 | |
| 38 | 1.96 | 46.9669 | 24.141 | 14.4407 | 30.696 | 0.10 | |
| 39 | 2.31 | 46.7483 | 21.446 | 14.2230 | 27.985 | 0.10 | |
| 40 | 2.34 | 46.6527 | 20.863 | 14.1275 | 27.395 | 0.28 | |
| 41 | 2.43 | 46.7296 | 20.860 | 14.2044 | 27.397 | 0.27 | |
| 42 | 2.43 | 46.7989 | 23.565 | 14.2729 | 30.108 | 1.48 | |
| 43 | 2.44 | 46.7811 | 21.544 | 14.2557 | 28.085 | 0.24 | |
| 44 | 2.90 | 46.5691 | 21.459 | 14.0438 | 27.984 | 0.19 | |
| 45 | 3.02 | 46.9402 | 22.635 | 14.4144 | 29.188 | 0.29 |
| Transition | Feature | Velocity | RA(1950) | Dec(1950) | RA(2000) | Dec(2000) | Intensity |
|---|---|---|---|---|---|---|---|
| No. | (km s-1) | 05h32m s | –5∘:24′: ″ | 05hh35m s | –5∘:22′: ″ | (Jy beam-1) | |
| 1665R | 46 | 3.53 | 46.7474 | 20.716 | 14.2223 | 27.254 | 1.01 |
| 47 | 3.61 | 46.6689 | 20.895 | 14.1438 | 27.428 | 0.39 | |
| 48 | 3.72 | 46.7300 | 20.675 | 14.2049 | 27.213 | 0.23 | |
| 49 | 4.07 | 46.5933 | 21.349 | 14.0680 | 27.877 | 0.78 | |
| 50 | 4.07 | 46.5446 | 21.273 | 14.0194 | 27.797 | 0.21 | |
| 51 | 4.24 | 46.8052 | 23.576 | 14.2792 | 30.119 | 0.18 | |
| 52 | 4.42 | 46.7489 | 20.825 | 14.2238 | 27.364 | 0.21 | |
| 53 | 4.77 | 46.6189 | 21.236 | 14.0937 | 27.765 | 0.19 | |
| 54 | 5.03 | 46.7662 | 20.640 | 14.2412 | 27.180 | 1.01 | |
| 55 | 5.13 | 47.0036 | 23.137 | 14.4777 | 29.694 | 0.13 | |
| 56 | 5.13 | 47.0114 | 21.280 | 14.4861 | 27.837 | 0.10 | |
| 57 | 5.42 | 46.9331 | 24.058 | 14.4069 | 30.610 | 13.32 | |
| 58 | 5.48 | 46.9861 | 22.727 | 14.4603 | 29.283 | 0.13 | |
| 59 | 5.48 | 46.9150 | 22.140 | 14.3895 | 28.691 | 0.11 | |
| 60 | 5.48 | 46.9950 | 21.363 | 14.4697 | 27.920 | 0.12 | |
| 61 | 5.48 | 46.9345 | 23.217 | 14.4086 | 29.769 | 0.11 | |
| 62 | 5.60 | 46.9629 | 22.917 | 14.4371 | 29.472 | 1.97 | |
| 63 | 5.63 | 47.1711 | 34.641 | 14.6414 | 41.210 | 0.13 | |
| 64 | 5.66 | 47.1858 | 34.679 | 14.6562 | 41.249 | 0.15 | |
| 65 | 5.83 | 46.6880 | 20.712 | 14.1630 | 27.246 | 0.12 | |
| 66 | 5.83 | 46.3557 | 19.353 | 13.8311 | 25.863 | 0.12 | |
| 67 | 6.18 | 46.6603 | 20.783 | 14.1352 | 27.316 | 0.12 | |
| 68 | 6.18 | 46.4246 | 18.394 | 13.9003 | 24.909 | 0.12 | |
| 69 | 6.18 | 46.8949 | 20.286 | 14.3700 | 26.836 | 0.29 | |
| 70 | 6.29 | 46.3697 | 18.686 | 13.8453 | 25.197 | 0.30 | |
| 71 | 6.53 | 46.9588 | 22.910 | 14.4330 | 29.464 | 0.14 | |
| 72 | 6.61 | 46.7039 | 20.616 | 14.1789 | 27.151 | 1.09 | |
| 73 | 6.63 | 46.4055 | 18.617 | 13.8811 | 25.131 | 0.52 | |
| 74 | 6.88 | 47.4773 | 19.497 | 14.9526 | 26.089 | 0.10 | |
| 75 | 6.88 | 47.4471 | 19.446 | 14.9224 | 26.035 | 0.11 | |
| 76 | 7.01 | 47.2481 | 35.460 | 14.7182 | 42.034 | 0.20 | |
| 77 | 7.11 | 46.6565 | 20.807 | 14.1314 | 27.339 | 0.49 | |
| 78 | 7.12 | 46.7840 | 24.318 | 14.2577 | 30.860 | 0.32 | |
| 79 | 7.23 | 46.9036 | 24.377 | 14.3773 | 30.927 | 3.04 | |
| 80 | 7.43 | 47.4634 | 19.557 | 14.9387 | 26.148 | 0.55 | |
| 81 | 7.59 | 46.5732 | 20.572 | 14.0482 | 27.098 | 0.10 | |
| 82 | 7.59 | 46.7991 | 24.012 | 14.2729 | 30.554 | 0.11 | |
| 83 | 7.59 | 46.5521 | 21.000 | 14.0269 | 27.525 | 0.14 | |
| 84 | 7.73 | 46.4607 | 35.073 | 13.9310 | 41.591 | 0.88 | |
| 85 | 7.94 | 46.6746 | 20.700 | 14.1495 | 27.233 | 0.10 | |
| 86 | 7.94 | 46.6647 | 29.883 | 14.1367 | 36.416 | 0.11 | |
| 87 | 8.63 | 47.4493 | 19.666 | 14.9245 | 26.255 | 0.22 | |
| 88 | 8.64 | 46.6916 | 29.404 | 14.1637 | 35.938 | 0.28 | |
| 89 | 8.64 | 46.8272 | 23.964 | 14.3011 | 30.508 | 0.10 | |
| 90 | 8.64 | 47.1435 | 21.659 | 14.6181 | 28.227 | 0.15 | |
| 91 | 8.79 | 47.3896 | 18.152 | 14.8653 | 24.737 | 0.15 | |
| 92 | 8.84 | 46.8000 | 24.518 | 14.2737 | 31.060 | 0.17 | |
| 93 | 8.99 | 47.6212 | 20.111 | 15.0962 | 26.713 | 0.11 | |
| 94 | 8.99 | 47.0118 | 23.011 | 14.4860 | 29.569 | 0.14 | |
| 95 | 8.99 | 46.6573 | 20.772 | 14.1322 | 27.304 | 0.12 | |
| 96 | 9.18 | 47.5979 | 19.677 | 15.0731 | 26.277 | 0.22 | |
| 97 | 9.34 | 47.5998 | 19.994 | 15.0749 | 26.594 | 0.10 |
| Transition | Feature | Velocity | RA(1950) | Dec(1950) | RA(2000) | Dec(2000) | Intensity |
|---|---|---|---|---|---|---|---|
| No. | (km s-1) | 05h32m s | –5∘:24′: ″ | 05hh35m s | –5∘:22′: ″ | (Jy beam-1) | |
| 1665R | 98 | 9.34 | 47.0384 | 22.393 | 14.5127 | 28.953 | 0.12 |
| 99 | 9.34 | 47.5797 | 19.486 | 15.0550 | 26.085 | 0.13 | |
| 100 | 9.49 | 46.8978 | 20.275 | 14.3729 | 26.825 | 0.14 | |
| 101 | 10.05 | 46.9781 | 22.586 | 14.4524 | 29.141 | 0.24 | |
| 102 | 10.70 | 46.7569 | 31.179 | 14.2284 | 37.718 | 0.34 | |
| 103 | 10.75 | 47.3695 | 21.663 | 14.8441 | 28.247 | 0.14 | |
| 104 | 10.79 | 47.0691 | 21.578 | 14.5437 | 28.140 | 1.26 | |
| 105 | 11.10 | 46.6243 | 20.873 | 14.0992 | 27.403 | 0.24 | |
| 106 | 11.10 | 47.4608 | 18.220 | 14.9365 | 24.810 | 0.12 | |
| 107 | 11.25 | 47.3932 | 18.070 | 14.8689 | 24.656 | 0.45 | |
| 108 | 11.81 | 47.3321 | 10.317 | 14.8104 | 16.898 | 0.12 | |
| 109 | 11.81 | 47.4134 | 23.297 | 14.8874 | 29.884 | 0.12 | |
| 110 | 11.81 | 47.4272 | 21.925 | 14.9017 | 28.512 | 1.46 | |
| 111 | 12.16 | 47.0128 | 21.766 | 14.4874 | 28.324 | 0.19 | |
| 112 | 12.16 | 46.9665 | 21.188 | 14.4412 | 27.743 | 0.14 | |
| 113 | 12.16 | 46.6537 | 20.600 | 14.1287 | 27.132 | 0.15 | |
| 114 | 12.24 | 47.4024 | 21.939 | 14.8769 | 28.525 | 0.39 | |
| 115 | 12.51 | 47.2698 | 17.198 | 14.7458 | 23.775 | 0.13 | |
| 116 | 12.72 | 47.0583 | 22.027 | 14.5328 | 28.589 | 0.19 | |
| 117 | 12.86 | 47.0778 | 21.726 | 14.5523 | 28.288 | 0.14 | |
| 118 | 13.07 | 46.8463 | 20.094 | 14.3215 | 26.640 | 0.17 | |
| 119 | 13.56 | 47.4364 | 18.336 | 14.9120 | 24.924 | 0.17 | |
| 120 | 13.56 | 46.7487 | 19.915 | 14.2239 | 26.454 | 0.22 | |
| 121 | 13.56 | 47.0897 | 21.697 | 14.5643 | 28.260 | 0.13 | |
| 122 | 13.99 | 47.0696 | 22.149 | 14.5440 | 28.711 | 0.36 | |
| 123 | 14.27 | 46.8284 | 10.361 | 14.3066 | 16.906 | 0.10 | |
| 124 | 14.39 | 47.0897 | 22.426 | 14.5641 | 28.989 | 0.35 | |
| 125 | 14.76 | 46.7700 | 19.827 | 14.2452 | 26.367 | 0.28 | |
| 126 | 15.67 | 47.0976 | 22.393 | 14.5720 | 28.957 | 0.15 | |
| 127 | 15.67 | 46.8512 | 19.455 | 14.3265 | 26.001 | 0.12 | |
| 128 | 15.67 | 46.7914 | 19.479 | 14.2667 | 26.021 | 0.12 | |
| 129 | 15.67 | 47.1407 | 22.790 | 14.6149 | 29.357 | 0.09 | |
| 130 | 15.67 | 47.1195 | 22.518 | 14.5938 | 29.083 | 0.10 | |
| 131 | 15.83 | 47.3816 | 21.585 | 14.8562 | 28.169 | 0.49 | |
| 132 | 16.38 | 47.1348 | 22.297 | 14.6092 | 28.864 | 0.16 | |
| 133 | 16.38 | 47.0745 | 21.293 | 14.5492 | 27.855 | 0.11 | |
| 134 | 16.73 | 47.1427 | 21.852 | 14.6172 | 28.419 | 0.14 | |
| 135 | 16.73 | 47.4460 | 21.058 | 14.9208 | 27.647 | 0.10 | |
| 136 | 16.73 | 47.1279 | 22.473 | 14.6022 | 29.039 | 0.14 | |
| 137 | 17.08 | 47.1074 | 22.284 | 14.5818 | 28.849 | 0.12 | |
| 138 | 17.30 | 47.1830 | 21.759 | 14.6576 | 28.329 | 0.49 | |
| 139 | 17.43 | 46.7458 | 19.202 | 14.2212 | 25.740 | 0.10 | |
| 140 | 17.43 | 47.2621 | 22.741 | 14.7363 | 29.317 | 0.11 | |
| 141 | 17.52 | 47.2124 | 22.805 | 14.6866 | 29.377 | 0.33 | |
| 142 | 17.70 | 47.1094 | 22.098 | 14.5839 | 28.662 | 1.33 | |
| 143 | 17.76 | 47.2777 | 23.112 | 14.7518 | 29.689 | 0.16 | |
| 144 | 17.85 | 47.1364 | 22.364 | 14.6108 | 28.931 | 1.05 | |
| 145 | 17.89 | 47.0646 | 22.633 | 14.5389 | 29.194 | 0.26 | |
| 146 | 17.99 | 46.6726 | 20.281 | 14.1477 | 26.814 | 0.18 | |
| 147 | 18.49 | 47.1717 | 22.117 | 14.6462 | 28.687 | 0.11 | |
| 148 | 18.49 | 47.1378 | 24.08s | 14.6116 | 30.649 | 0.11 | |
| 149 | 18.49 | 46.9396 | 11.550 | 14.4174 | 18.103 | 0.10 |
| Transition | Feature | Velocity | RA(1950) | Dec(1950) | RA(2000) | Dec(2000) | Intensity |
|---|---|---|---|---|---|---|---|
| No. | (km s-1) | 05h32m s | –5∘:24′: ″ | 05hh35m s | –5∘:22′: ″ | (Jy beam-1) | |
| 1665R | 150 | 18.49 | 47.2269 | 22.836 | 14.7011 | 29.409 | 0.12 |
| 151 | 18.49 | 47.1035 | 23.022 | 14.5776 | 29.586 | 0.10 | |
| 152 | 18.49 | 47.1097 | 23.543 | 14.5836 | 30.108 | 0.08 | |
| 153 | 18.49 | 47.3616 | 21.744 | 14.8361 | 28.327 | 0.12 | |
| 154 | 18.49 | 47.0872 | 24.091 | 14.5610 | 30.655 | 0.08 | |
| 155 | 18.63 | 47.1870 | 23.139 | 14.6611 | 29.709 | 0.23 | |
| 156 | 18.64 | 47.1385 | 22.269 | 14.6128 | 28.836 | 7.34 | |
| 157 | 18.76 | 47.1659 | 22.942 | 14.6401 | 29.511 | 0.77 | |
| 158 | 18.84 | 47.1304 | 21.627 | 14.6050 | 28.194 | 0.10 | |
| 159 | 18.84 | 46.6699 | 20.266 | 14.1449 | 26.799 | 0.12 | |
| 160 | 18.84 | 47.1244 | 23.040 | 14.5986 | 29.606 | 0.15 | |
| 161 | 18.84 | 47.1112 | 22.301 | 14.5856 | 28.867 | 0.12 | |
| 162 | 18.84 | 47.1303 | 23.436 | 14.6043 | 30.002 | 0.09 | |
| 163 | 18.84 | 47.0534 | 23.996 | 14.5273 | 30.557 | 0.10 | |
| 164 | 19.03 | 46.7193 | 19.180 | 14.1947 | 25.716 | 0.18 | |
| 165 | 19.19 | 47.3167 | 22.621 | 14.7910 | 29.201 | 0.11 | |
| 166 | 19.19 | 47.0641 | 22.715 | 14.5383 | 29.276 | 0.09 | |
| 167 | 19.35 | 46.9618 | 21.237 | 14.4365 | 27.792 | 0.11 | |
| 168 | 19.42 | 47.3386 | 22.245 | 14.8129 | 28.826 | 0.21 | |
| 169 | 19.46 | 47.1366 | 22.211 | 14.6110 | 28.778 | 0.37 | |
| 170 | 19.54 | 47.1549 | 22.679 | 14.6292 | 29.247 | 0.16 | |
| 171 | 19.54 | 47.2993 | 23.040 | 14.7734 | 29.618 | 0.10 | |
| 172 | 19.54 | 47.2746 | 22.420 | 14.7489 | 28.997 | 0.25 | |
| 173 | 19.54 | 46.6645 | 19.663 | 14.1398 | 26.196 | 0.11 | |
| 174 | 19.54 | 47.0678 | 22.465 | 14.5422 | 29.027 | 0.16 | |
| 175 | 19.54 | 47.3164 | 22.148 | 14.7909 | 28.728 | 0.09 | |
| 176 | 19.54 | 47.1038 | 22.720 | 14.5780 | 29.284 | 0.16 | |
| 177 | 19.71 | 47.1870 | 23.004 | 14.6612 | 29.575 | 0.39 | |
| 178 | 19.89 | 47.2796 | 21.609 | 14.7542 | 28.187 | 0.10 | |
| 179 | 19.89 | 47.3264 | 22.292 | 14.8008 | 28.872 | 0.11 | |
| 180 | 20.00 | 47.2892 | 22.323 | 14.7635 | 28.901 | 4.24 | |
| 181 | 20.06 | 47.2165 | 23.524 | 14.6905 | 30.097 | 0.18 | |
| 182 | 20.09 | 46.9299 | 14.804 | 14.4068 | 21.356 | 0.12 | |
| 183 | 20.24 | 47.1416 | 22.404 | 14.6159 | 28.972 | 0.21 | |
| 184 | 20.24 | 47.3210 | 22.020 | 14.7954 | 28.600 | 0.38 | |
| 185 | 20.24 | 47.3613 | 21.756 | 14.8359 | 28.339 | 0.10 | |
| 186 | 20.24 | 46.8675 | 20.300 | 14.3425 | 26.848 | 0.11 | |
| 187 | 20.24 | 47.2083 | 22.882 | 14.6825 | 29.454 | 0.20 | |
| 188 | 20.24 | 47.2757 | 22.359 | 14.7500 | 28.936 | 0.23 | |
| 189 | 20.24 | 47.2389 | 23.568 | 14.7129 | 30.142 | 0.14 | |
| 190 | 20.49 | 46.8274 | 19.833 | 14.3026 | 26.378 | 0.34 | |
| 191 | 20.60 | 47.2254 | 22.594 | 14.6997 | 29.167 | 0.28 | |
| 192 | 20.61 | 47.1927 | 22.700 | 14.6670 | 29.271 | 0.28 | |
| 193 | 20.73 | 47.0252 | 18.005 | 14.5010 | 24.563 | 0.17 | |
| 194 | 20.78 | 47.2590 | 22.030 | 14.7335 | 28.605 | 0.59 | |
| 195 | 20.79 | 47.1323 | 22.381 | 14.6066 | 28.947 | 0.32 | |
| 196 | 20.95 | 47.1747 | 22.706 | 14.6489 | 29.276 | 0.12 | |
| 197 | 21.11 | 47.3075 | 21.887 | 14.7820 | 28.466 | 0.72 | |
| 198 | 21.30 | 47.2234 | 23.040 | 14.6976 | 29.613 | 0.10 | |
| 199 | 21.30 | 47.2034 | 23.131 | 14.6775 | 29.703 | 0.10 | |
| 200 | 21.30 | 47.1751 | 22.577 | 14.6494 | 29.147 | 0.31 |
| Transition | Feature | Velocity | RA(1950) | Dec(1950) | RA(2000) | Dec(2000) | Intensity |
|---|---|---|---|---|---|---|---|
| No. | (km s-1) | 05h32m s | –5∘:24′: ″ | 05hh35m s | –5∘:22′: ″ | (Jy beam-1) | |
| 1665R | 201 | 21.38 | 47.2850 | 21.772 | 14.7596 | 28.350 | 1.48 |
| 202 | 21.51 | 46.7892 | 19.337 | 14.2645 | 25.879 | 0.18 | |
| 203 | 21.65 | 46.7448 | 18.535 | 14.2205 | 25.074 | 0.14 | |
| 204 | 22.00 | 47.1648 | 22.167 | 14.6392 | 28.736 | 0.15 | |
| 205 | 22.00 | 47.2413 | 21.959 | 14.7158 | 28.534 | 0.15 | |
| 206 | 22.00 | 47.1936 | 22.864 | 14.6678 | 29.435 | 0.12 | |
| 207 | 22.00 | 47.1771 | 21.131 | 14.6518 | 27.701 | 0.22 | |
| 208 | 22.01 | 46.7630 | 18.902 | 14.2385 | 25.442 | 0.19 | |
| 209 | 22.22 | 47.3115 | 21.333 | 14.7862 | 27.913 | 0.29 | |
| 210 | 22.35 | 46.7742 | 19.028 | 14.2497 | 25.569 | 0.11 | |
| 211 | 22.35 | 46.8020 | 19.538 | 14.2773 | 26.081 | 0.08 | |
| 212 | 22.50 | 47.1623 | 21.593 | 14.6369 | 28.162 | 2.19 | |
| 213 | 22.54 | 46.6625 | 23.668 | 14.1364 | 30.201 | 0.84 | |
| 214 | 22.58 | 47.2731 | 21.427 | 14.7478 | 28.004 | 0.20 | |
| 215 | 22.70 | 47.2730 | 20.298 | 14.7480 | 26.875 | 0.09 | |
| 216 | 22.70 | 46.7332 | 18.448 | 14.2089 | 24.986 | 0.11 | |
| 217 | 22.70 | 46.7309 | 20.211 | 14.2060 | 26.748 | 0.10 | |
| 218 | 22.70 | 46.8040 | 19.311 | 14.2794 | 25.854 | 0.09 | |
| 219 | 22.70 | 47.2795 | 19.234 | 14.7549 | 25.811 | 0.31 | |
| 220 | 22.81 | 47.3016 | 21.029 | 14.7764 | 27.608 | 0.25 | |
| 221 | 22.86 | 47.3174 | 21.643 | 14.7920 | 28.223 | 0.26 | |
| 222 | 23.06 | 46.8216 | 19.733 | 14.2968 | 26.277 | 0.13 | |
| 223 | 23.06 | 47.0926 | 21.834 | 14.5671 | 28.397 | 0.09 | |
| 224 | 23.06 | 46.8102 | 19.504 | 14.2855 | 26.047 | 0.10 | |
| 225 | 23.57 | 47.3143 | 19.297 | 14.7897 | 25.877 | 0.10 | |
| 226 | 23.65 | 47.3609 | 19.201 | 14.8363 | 25.784 | 0.31 | |
| 1667L | 1 | 13.46 | 46.9359 | 24.607 | 14.4096 | 31.159 | 0.30 |
| 2 | 13.51 | 46.9845 | 24.415 | 14.4582 | 30.971 | 0.21 | |
| 3 | 13.43 | 46.9832 | 29.620 | 14.4552 | 36.176 | .21 |