The Bolocam 1.1 mm Lockman Hole Galaxy Survey: SHARC II 350 m Photometry and Implications for Spectral Models, Dust Temperatures, and Redshift Estimation
Abstract
We present 350 m photometry of all 17 galaxy candidates in the Lockman Hole detected in a 1.1 mm Bolocam survey. Several of the galaxies were previously detected at 850 m, at 1.2 mm, in the infrared by Spitzer, and in the radio. Nine of the Bolocam galaxy candidates were detected at 350 m and two new candidates were serendipitously detected at 350 m (bringing the total in the literature detected in this way to three). Five of the galaxies have published spectroscopic redshifts, enabling investigation of the implied temperature ranges and a comparison of photometric redshift techniques.
= 350 m lies near the spectral energy distribution peak for thermally emitting galaxies. Thus, luminosities can be measured without extrapolating to the peak from detection wavelengths of 850 m. Characteristically, the galaxy luminosities lie in the range L⊙, with dust temperatures in the range of 40 K to 70 K, depending on the choice of spectral index and wavelength of unit optical depth. The implied dust masses are 3 - 5 M⊙. We find that the far-infrared to radio relation for star-forming ULIRGs systematically overpredicts the radio luminosities and overestimates redshifts on the order of , whereas redshifts based on either on submillimeter data alone or the 1.6 m stellar bump and PAH features are more accurate.
1 Introduction
Surveys at submillimeter and millimeter wavelengths have detected hundreds of galaxy candidates by their thermal dust emission. The galaxies (hereafter referred to as submillimeter galaxies) characteristically have redshifts and inferred luminosities of L⊙ and star formation rates of M⊙ per year (assuming dust heating by young stars). Such enormous luminosities and star formation rates, or accretion rates in the case of super-massive black hole growth, make submillimeter galaxies strong candidates for the progenitors of massive galaxies at the current epoch. Clearly, it is crucial to characterize the spectral energy distributions (SEDs) where their emission peaks ( = 350 m for 40 K dust at a redshift of ), measure their redshifts and luminosity functions, determine their power sources, and integrate them into theories of galaxy formation.
Although submillimeter galaxy SEDs peak at a few hundred microns for all but the highest redshifts, 850 m surveys have been most successful at detecting galaxies because of the lower atmospheric noise and greater transmission, and less stringent telescope surface requirements. Most of the detections have been low signal-to-noise ratio (just over thresholds of 3-4 ), necessitating multiwavelength confirmation. Furthermore, the SEDs have been extrapolated shortward from 850-1200 m over the peak, or between 850-1200 m and the far-infrared, to estimate dust temperatures, luminosities, and star formation rates. Clearly, 350 m photometry can confirm galaxy candidates and sample the SEDs near their peaks for more precise inferences of physical parameters. Similarly, because of the difficulty in obtaining spectroscopic redshifts of large numbers of highly obscured galaxies, various photometric redshift estimation techniques have emerged, notably based on the far-infrared to radio luminosity relation in ULIRGs (Carilli & Yun, 1999; Yun & Carilli, 2002) and the stellar continuum bump in the infrared for Spitzer-detected galaxies (Egami et al., 2004; Sawicki, 2002). However, despite the difficulty, candidate spectroscopic redshifts have been obtained for 73 galaxies (Chapman et al., 2005). Thus, with well-determined dust-emission SEDs, including 350 m, photometric techniques can be compared to spectroscopic redshifts.
In this paper, we present 350 m photometry of all 17 submillimeter galaxy candidates from the Bolocam Lockman Hole survey (Laurent et al., 2005), some with previous 850 m and 1200 m detections. Two new galaxy candidates were serendipitously detected at 350 m, bringing the total number of 350 m-discovered galaxies to three (Khan et al., 2005). We combine these data with infrared and radio data to derive improved luminosities, explore the range of implied dust temperatures and spectral indices, and compare photometric redshift techniques. This comparison is timely with the imminent launch of the Herschel Space Observatory (scheduled for August 2007), which will detect thousands of galaxies at far-infrared and submillimeter wavelengths, but for which spectroscopic redshifts will be attainable for only a small fraction. Throughout the paper, a cosmology of H km s-1 Mpc-1, , and = 0.7 is assumed.
2 The 350 m SHARC II Galaxy Survey
Observations at multiple submillimeter wavelengths are vital both to confirm the Bolocam sources (as 6 false detections are expected from Monte-Carlo simulations) and to make photometric redshift and temperature estimates. The 350 m SHARC-II observations combined with the Bolocam 1.1 mm galaxy survey provides a flux density ratio that is strongly dependent on redshift for a given temperature. This is because the rest wavelength corresponding to the observed wavelength of 350 m with SHARC-II is near the peak of the grey-body spectrum (for a galaxy at 40 K), and Bolocam’s 1.1 mm observations climb the steep ( 1.5) modified Rayleigh-Jeans side of the spectral energy distribution.
Follow-up observations of each of the Bolocam Lockman Hole galaxy candidates (Laurent et al., 2005) were taken with the Submillimeter High Angular Resolution Camera (SHARC II) at the Caltech Submillimeter Observatory. The observations were taken on three observing runs: 2004 March-April, 2005 January, and 2005 February. The brightest Bolocam sources (1 and 2) were observed over 8 hours of total integration time during the 2004 March-April run, although most of the run was lost due to poor weather. Bolocam sources 1 and 16 were observed over 18 hours of integration time during the 2005 January run, again with much of the run lost due to poor weather. The 2005 February run was characterized by much better weather, and all the Bolocam sources except for 1, 5, 8 and 16 were observed over 35 hours of integration time111The primary weather measurement correlated with the SHARC II mapping speed is the CSO 225 GHz heterodyne, narrowband, “tipper tau” monitor, which measures the zenith atmospheric attenuation. The 2004 March-April, 2005 January, and 2005 February Lockman Hole observations yielded ranges and 75th percentiles of , , , and , , respectively.. When combined with the observations of Bolocam sources 5 and 8 by Kovács et al. (2005), the entire Bolocam sample was observed over these observing runs.
Observations with SHARC II were taken in the point source observing mode, with a Lissajous (parametric sinusoidal curve) scan pattern using the SWEEP command of telescope. The Lissajous pattern was scanned in altitude and azimuth, with amplitudes of 30 and 20, respectively. When combined with the 2.6 1.0 SHARC II field-of-view and 9 FWHM instrument beam size, this resulted in a uniform coverage region of 95 18, with a border of additional coverage (60 40) outside this region. Each observation had a fixed length of 10 minutes to ensure uniform coverage even on individual scans. Integration times and the resulting depths of each of the SHARC II fields are listed in Table 1.
| SHARC II/Bolocam | Bolocam 2 | SHARC II | SHARC II | ||||||
|---|---|---|---|---|---|---|---|---|---|
| Bolocam | SHARC II | SHARC II | Offset | Error Circle | R.A | Dec | S/N | Sν | |
| Source | Source | # 10 min. Scans | (”) | (”) | (J2000.0) | (J2000.0) | (mJy) | (mJy) | |
| 1 | 7 | 30,16 | 13.2 | 21 | 10:52:57.1 | 57:21:01 | 3.7 | 38.0 | 14.0 |
| 2 | 8 | 17,23 | 15.8 | 21 | 10:51:18.6 | 57:16:36 | 3.5 | 20.9 | 7.9 |
| 3 | 10 | 20 | 9.1 | 21 | 10:52:13.0 | 57:15:46 | 3.2 | 14.0 | 5.6 |
| ” | 11 | 20 | 17.3 | 21 | 10:52:14.0 | 57:16:02 | 3.1 | 15.1 | 6.2 |
| 4 | 21 | 20 | (18.3) | 22 | 10:52:04.8 | 57:18:39 | 15.4 | ||
| 5 | 6 (Kovács 4) | 15.0 | 22 | 10:52:30.9 | 57:22:06 | 5.9 | 40.4 | 8.6 | |
| 6 | 1 | 5 | 12.0 | 22 | 10:51:14.1 | 57:14:21 | 6.8 | 63.6 | 18.4 |
| ” | 9 | 5 | 18.0 | 22 | 10:51:17.8 | 57:14:20 | 3.3 | 27.6 | 10.8 |
| 7 | 20 | 15 | (16.7) | 22 | 10:51:28.6 | 57:30:50 | 10.7 | ||
| 8 | 5 (Kovács 5) | 16.3 | 23 | 10:52:38.8 | 57:24:38 | 6.2 | 40.5 | 8.1 | |
| 9 | 18 | 14 | (15.4) | 23 | 10:53:05.0 | 57:15:08 | 19.6 | ||
| 10 | 16 | 36 | (22.4) | 23 | 10:51:31.0 | 57:23:35 | 25.1 | ||
| 11 | 19 | 13 | (19.9) | 23 | 10:52:49.0 | 57:13:01 | 18.9 | ||
| 12 | 14 | 18 | (1.5) | 23 | 10:51:15.5 | 57:15:22 | 20.5 | ||
| 13 | 17 | 13 | (20.5) | 23 | 10:52:34.9 | 57:18:13 | 23.7 | ||
| 14 | 2 | 16 | 20.5 | 24 | 10:52:01.7 | 57:24:43 | 5.9 | 24.1 | 7.3 |
| 15 | 15 | 15 | (24.0) | 24 | 10:51:47.9 | 57:28:57 | 20.0 | ||
| 16 | 13 | 93 | 1.6 | 25 | 10:52:27.3 | 57:25:13 | 3.0 | 44.0 | 18.3 |
| 17 | 12 | 16 | 6.0 | 26 | 10:52:00.6 | 57:24:21 | 3.1 | 15.5 | 6.3 |
| (9) | 3 | 14 | - | 23 | 10:53:08.3 | 57:15:01 | 4.8 | 28.4 | 9.2 |
| (16) | 4 | 93 | - | 25 | 10:52:32.3 | 57:24:48 | 3.8 | 37.0 | 13.4 |
Note. — SHARC II detections and 3 upper limits at each of the Bolocam sources, in order of descending brightness at 1.1 mm. The Bolocam sources in parentheses correspond to SHARC II detections well outside of the Bolocam 2 positional error circle, and are therefore believed not to be associated with the Bolocam source. Two SHARC II detections from Kovács et al. (2005) are also included. The SHARC II source numbers are listed in order of 350 m S/N.
The reduction of the raw SHARC II data was accomplished with the use of the ”deep” cleaning utility of the Comprehensive Reduction Utility for SHARC II (CRUSH222http://www.submm.caltech.edu/sharc/crush/index.htm). Observations of pointlike galaxies, quasars, protostellar sources, HII regions, and evolved stars were used to construct pointing models for each of the observing runs. Observations of the pointing sources were taken with a scan strategy identical to that of the science fields. A subset of the pointing sources were used for flux density calibration, with reference 350 m flux densities obtained from the SHARC II website333http://www.submm.caltech.edu/sharc/.
Source extraction was performed on the CRUSH-cleaned maps, with each map (corresponding to a single Bolocam candidate) consisting of all of the individual scans co-added together. The algorithm was begun by doing a cut on the uniform coverage region, defined as the set of pixels for which the coverage is 60% of the maximum per-pixel coverage. The uniform coverage region is a contiguous region in the center of each map. Next, an RMS in sensitivity units (the flux density of each pixel times the square root of the integration time for that pixel in units of mJy s1/2) was computed in the uniform coverage region. This RMS is valid for the entire uniform coverage region since variations in coverage have been accounted for by the coverage normalization, where is the total integration time for pixel . All pixels with coverage-normalized flux densities exceeding 3 (“hot pixels”) were flagged as potential sources. Then hot pixels were grouped into multi-pixel sources by making the maximal group of adjacent hot pixels, including those within pixels (i.e., diagonally adjacent). The peak flux density, right ascension and declination of the source candidates were computed by centroiding two-dimensional Gaussians on the groups. The uncertainty in the flux density of each source is given by the pixel-to-pixel RMS at the centroid location of the source.
3 Positional Uncertainties
The large beam sizes of submillimeter and millimeter wave instruments (31, 14, 11, and 9 FWHM for Bolocam, SCUBA, MAMBO, and SHARC II, respectively) makes it difficult to identify likely optical and radio counterparts to the galaxy candidates. Despite the large beam sizes, however, individual sources can be centroided to much higher precision than the quoted beam size. To help constrain this issue of source matching between the various surveys, a positional error circle was estimated for each of the submillimeter and millimeter band detections. For the Bolocam detections, Monte Carlo simulations were performed by injecting sources into the timestream and running the reduction pipeline and source extraction algorithm. This simulation was repeated for a range of source flux densities. The resulting centroiding error as a function of flux density (5.4 - 9.1) was added in quadrature with the RMS telescope pointing error (9.1) to yield a range of 2 positional error circles of 21 - 26. A similar approach was used to estimate the centroiding errors for SCUBA (Scott et al., 2002) and MAMBO (Greve et al., 2004), yielding 2.2 - 10.4 and 1.2 - 4.3 respectively. When added in quadrature to the quoted pointing errors (4 and 3, respectively), this yields 2 positional errors of 9.2 - 22 and 6.5 - 13, respectively. As the centroiding error as a function of flux density for the SHARC II observations was not available, values of 3.0 - 4.0 were empirically determined from the SHARC II centroiding fits of the Bolocam sources, which, when added in quadrature with the pointing error of 3.8, yields 2 positional errors of 9.8 - 11. These error circles were used to correlate the sources between the different surveys to find coincident detections.
4 Results
4.1 SHARC II 350 m Detections
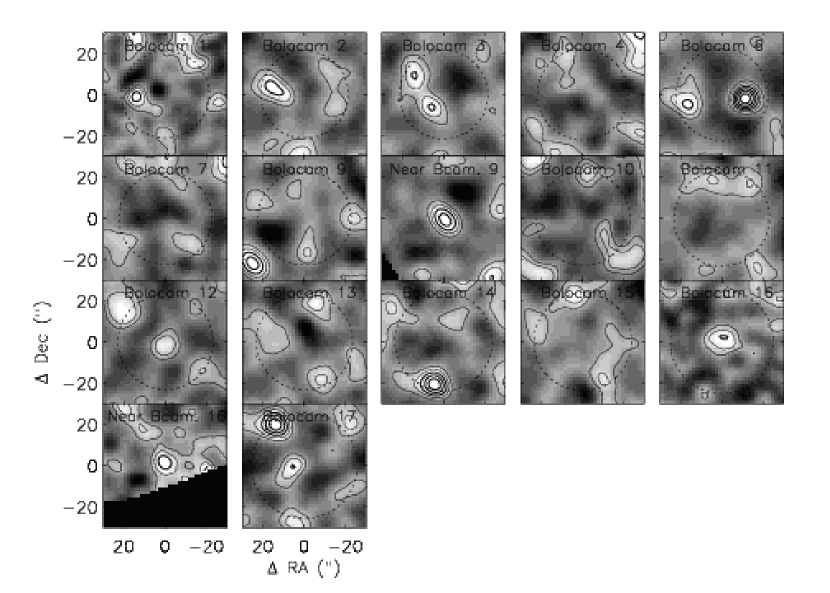
Postage stamp images of each of the SHARC II fields are shown in Figure 1. Each image has been cropped to 60 60, centered on the Bolocam source positions (dotted circle). The SHARC II source candidate list is presented in Table 1, where the sources are listed in order of Bolocam source number. Seven Bolocam galaxy candidates were detected by SHARC II at (Bolocam 1, 2, 3, 6, 14, 16, 17). Two of these sources (Bolocam 3, 6) were found to have two SHARC II counterparts. Two Bolocam candidates (5 and 8) were observed by Kovács et al. (2005) and are also included in the list. 3 upper limits are given for each of the Bolocam fields with no positive detections. Note that the flux density uncertainties in the last column of Table 1 include uncertainties of 20% due to calibration error (as determined by the dispersion of the calibration source flux densities). The correlation between the two source lists based upon the positional error circles and detection offsets is lower than expected, as only 2 of the 7 Bolocam sources with a single SHARC II counterpart have errors within 1 (5 are expected from a normal distribution). This may be due to underestimating the Bolocam pointing error (cf. § 3 and Laurent et al. 2005).
An additional two sources were detected in the survey (in the fields of Bolocam 9 and 16); they are not associated with the Bolocam sources because their locations are well outside of the Bolocam positional error circles (see § 3). While 0.8 false detections are expected from Gaussian statistics in the SHARC II survey (given the 60% uniform coverage cut and the 9″ SHARC II beam), these serendipitous sources nevertheless may be real. SHARC II sources 3 and 4 were detected at high significance at 350 m and lie in regions of positive flux density in the Bolocam map, with S/N ratios of 2.9 and 2.1, respectively.
4.2 SHARC II / Bolocam Correspondence
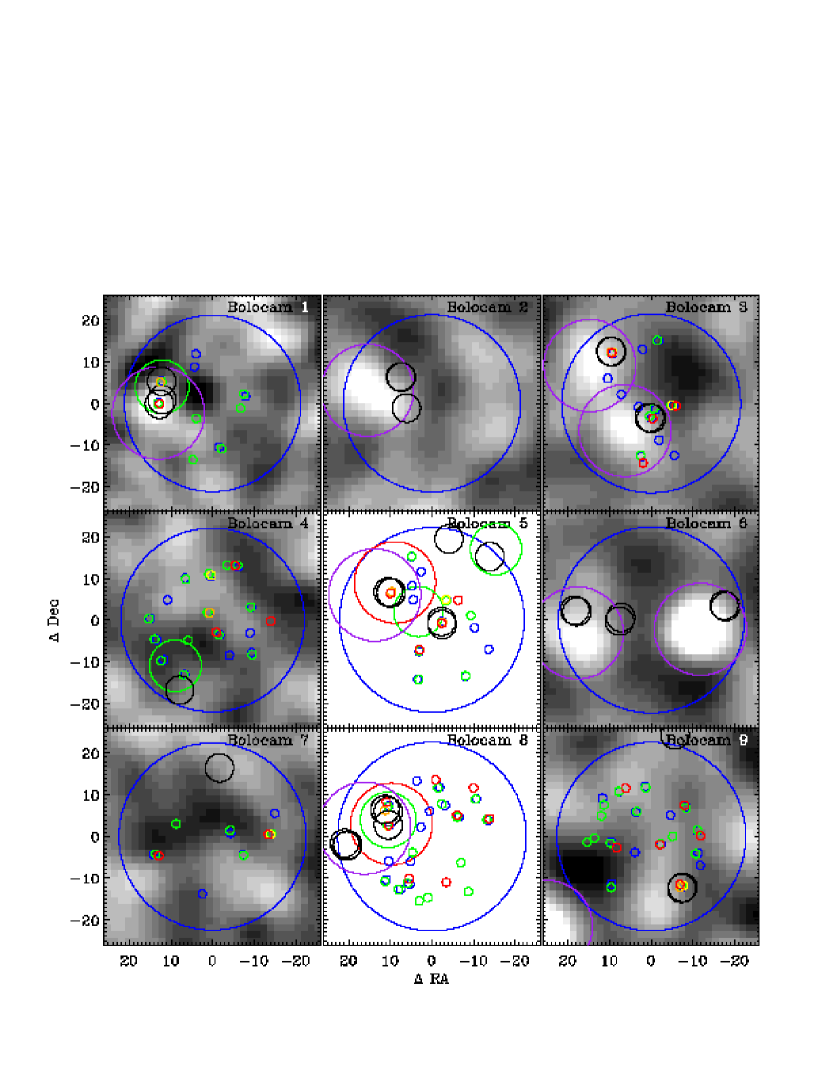
In addition to the Bolocam 1.1 mm and SHARC II 350 m detections, existing multiwavelength coverage (submillimeter, radio, infrared, optical, and X-ray) of the Lockman Hole was used to identify likely counterparts and characterize coincident sources. A detailed description of each of these surveys is found in Appendix A. A comprehensive summary of the counterparts to the Bolocam detections (including the coverage by each survey) is listed in Table 3. Given the large size of the Bolocam beam, identifying likely counterparts requires a certain amount of judgement. Detailed maps of the sources can be found in Figure 2. Additional notes on individual objects are discussed below.
![[Uncaptioned image]](/html/astro-ph/0601582/assets/x3.png)
Bolocam.LE.1100.1 – We conclude that Bolocam source 1 is likely to be a submillimeter galaxy given the coincident Bolocam, MAMBO, and SHARC II detections. In addition, highly plausible radio, Spitzer, and faint optical counterparts exist.
Bolocam.LE.1100.2 – The SHARC II detection falls 16 to the ENE, but contains both radio sources in its error circle. The two 20 cm radio sources (Yun et al., 2005; Biggs & Ivison, 2006) are unrelated due to their separation. We treat each of the radio sources separately when fitting photometric redshifts. The coincident northern radio source with bright optical counterparts has a low photometric redshift (see next section) and is likely to be a low-redshift galaxy as the SDSS survey concludes. Bolocam and SHARC II may also be detecting the Biggs & Ivison (2006) southern radio source, which has a very faint optical counterpart.
Bolocam.LE.1100.3 – The position of this 6.0 mJy Bolocam source is at the edge of the good coverage region of the SCUBA survey. All of the optical counterparts to the radio sources are relatively bright (22 - 24 magnitude), although curiously, the SDSS catalog classifies the optical counterpart to the northeast radio source as a star. (Given the radio and 350 m SHARC II counterparts, we conclude that the SDSS classification may be incorrect.) Given that both of the SHARC II sources have radio, Spitzer, and optical counterparts, each (or both) are likely candidates as submillimeter galaxies and each could contribute to the flux density of the Bolocam source. Note that when estimating photometric redshifts where source confusion may be present (for this Bolocam source and elsewhere), no attempt was made to partition the Bolocam flux density among multiple submillimeter sources (due to the large uncertainties in position).
Bolocam.LE.1100.5 – Four radio detections fall within the Bolocam positional error circle: one within the SCUBA and SHARC II error circles and just outside the edge of the MAMBO error circle, one on the edge of the MAMBO error circle, and the other two near the edge of the Bolocam positional error circle. The southwest radio source has 5-color SDSS photometry and is classified as a galaxy (extended). The fact that three of the radio sources lie outside both the SCUBA and SHARC II error circles makes them unlikely to be the correct counterpart of the submillimeter detections. We therefore choose the northeast radio source to be the more likely counterpart (which is confirmed by the fact that Chapman et al. 2005 were able to obtain a spectroscopic reshift for this submillimeter galaxy at this radio position, as discussed in Appendix B).
A MAMBO detection located just outside the Bolocam error circle was not detected by SHARC II or SCUBA (3 upper limit of 35.4 mJy), but has a Chapman et al. (2005) spectroscopic redshift of 1.956. Due to the large size of the Bolocam beam, the Bolocam flux densities and positions may be influenced by source confusion.
Bolocam.LE.1100.6 – Two SHARC II counterparts fall within the Bolocam positional error circle, each with radio counterparts (with the eastern source containing two radio counterparts). The SDSS survey classifies both the radio source associated with the western SHARC II source and the eastern radio source associated with the eastern SHARC II source as galaxies. Each of the three radio sources may be contributing to the Bolocam flux density due to source confusion. We treat each of the radio sources separately when fitting photometric redshifts.
Bolocam.LE.1100.8 – Given the fact that the southern radio source (of the pair of two radio sources oriented N-S) has Bolocam, SCUBA, MAMBO, SHARC II, and Spitzer detections, along with a spectroscopic redshift, we conclude that this Bolocam source is real. Nevertheless, the northern radio source cannot be ruled out as a galaxy also contributing to the submillimeter fluxes.
Bolocam.LE.1100.14 – This 4.4 mJy Bolocam detection is likely influenced by source confusion, given three closely spaced submillimeter sources (SCUBA sources 1, 4, and 8, with the latter two lying near, but outside of the Bolocam positional error circle). The location of the southern radio source relative to the Bolocam position is greater than the 16 radius used for the Spitzer counterparts catalog, and thus no Spitzer data is available. This set of coincident sources is the most likely counterpart to the Bolocam source. Just outside of the Bolocam error circle lies another 850 m SCUBA detection (LE850.4) to the northeast, with a coincident Ivison et al. (2002) 20 cm radio source as well as published 3.6, 4.5, 5.8, and 8.0 m Spitzer counterparts.
The SCUBA source that coincides with Bolocam source 14 (LH850.1) is also the brightest SCUBA source and has been the target of many published multi-wavelength studies. In addition to the extensive radio, infrared, optical and X-ray surveys discussed in Appendix A, a faint (K 23.5) galaxy counterpart was positively identified (Lutz et al., 2001) at the radio position. The source was found to be extended (20-30 kpc), clumpy (on subarcsecond scales) and very red (I - K 6.2).
Bolocam.LE.1100.16 – We conclude that this Bolocam source is in fact a submillimeter galaxy, given the large number of multiwavelength detections and a radio source with a confirmed spectroscopic redshift.
Bolocam.LE.1100.17 – This 4.0 mJy Bolocam detection is likely influenced by source confusion, given two nearby submillimeter sources. The 850 m SCUBA, 1.1 mm MAMBO, and 850 m SHARC II coincident detections to the northeast are the likely counterparts to Bolocam source 14 and are discussed in detail in Bolocam.LE.1100.14. The SDSS catalog curiously classifies the northwest radio source as a star. We conclude that both the southeast and northwest radio sources associated with the Bolocam source may be submillimeter galaxies, given the large number of multiwavelength detections. While a confirmed spectroscopic redshift exists near the southeast radio source, self-consistent photometric redshifts and multiple optical counterparts at the radio position suggest that the spectroscopic redshift may not correspond to the radio / submillimeter sources (see § 5.4).
4.3 SHARC II Non-Detections
From extensive Monte-Carlo simulations of the Bolocam data set (Laurent et al., 2005), 6 false detections (Poisson distributed) are expected. This represents a large fraction (6/17) of the overall source catalog and is a consequence of the relatively low 3 detection threshold used in the source detection algorithm. Eight of the Bolocam sources (4, 7, 9, 10, 11, 12, 13, and 15) were found to show no secure counterparts at 350 m, although two of the sources (Bolocam 9, 12) exhibit flux densities just below the 3 detection threshold (with a coincident radio detection for Bolocam source 9). Here we describe each of the SHARC II non-detections of the Bolocam sources in detail.
Bolocam.LE.1100.4 – A single radio counterpart (Biggs & Ivison, 2006) lies near the edge of the MAMBO positional error circle, with an SDSS classification of the optical counterpart as a galaxy. While well within the Bolocam positional error circle, the location of the radio source relative to the Bolocam position is greater than the 16 radius used for the Spitzer counterparts catalog, and thus no Spitzer data is available. Given the coincident Bolocam and Mambo detections, along with a lack of SHARC II and SCUBA detections, this source could possibly be a very high redshift galaxy (), such that the SED falls below the 3 detection threshold of the SCUBA 850 m survey.
Bolocam.LE.1100.7 – The lack of multiwavelength observations makes it difficult to determine whether this Bolocam detection is real (and associated with the coincident radio detection). The lack of Spitzer and SHARC II counterparts to the radio source, however, leads us to believe that the Bolocam source may be a spurious detection.
Bolocam.LE.1100.9 – It is interesting to point out that the SHARC II upper limit in the Bolocam error circle is just below the 3 detection flux density threshold and coincides with the radio position. The lack of multiwavelength observations makes it difficult to determine whether this Bolocam detection is real. The presence of Spitzer counterparts and a possible dim SHARC II detection, however, leads us to believe that the Bolocam source may be real.
Bolocam.LE.1100.10 – Given the lack of counterparts, we conclude that there is little evidence to suggest that this detection represents a submillimeter galaxy and is likely a spurious detection.
Bolocam.LE.1100.11 – The lack of more multiwavelength data makes it difficult to determine whether this Bolocam detection is real. While lacking a SHARC II detection, the radio source with an SDSS classification as a galaxy (extended object) leads us to believe that the Bolocam source may be real.
Bolocam.LE.1100.12 – A portion of the Bolocam error circle lies outside the deep Ivison et al. (2005) optical Subaru R-band field. Similar to Bolocam source 9, we point out that the SHARC II upper limit in the Bolocam error circle is just below the 3 detection flux density threshold. The lack of more multiwavelength data makes it difficult to confirm whether this Bolocam detection is real.
Bolocam.LE.1100.13 – This Bolocam source lacks 850 m SCUBA detections (although a SCUBA source is located just outside of the Bolocam positional error circle). We suggest that there is little evidence that the Bolocam detection represents a submillimeter galaxy and is likely a spurious detection.
Bolocam.LE.1100.15 – The lack of MAMBO and SHARC II counterparts makes it difficult to confirm the Bolocam detection. Nevertheless, the SDSS classification of the position coincident with the radio source as a galaxy (extended) leads us to believe that the Bolocam source may be real.
4.4 Submillimeter Spectral Energy Distributions
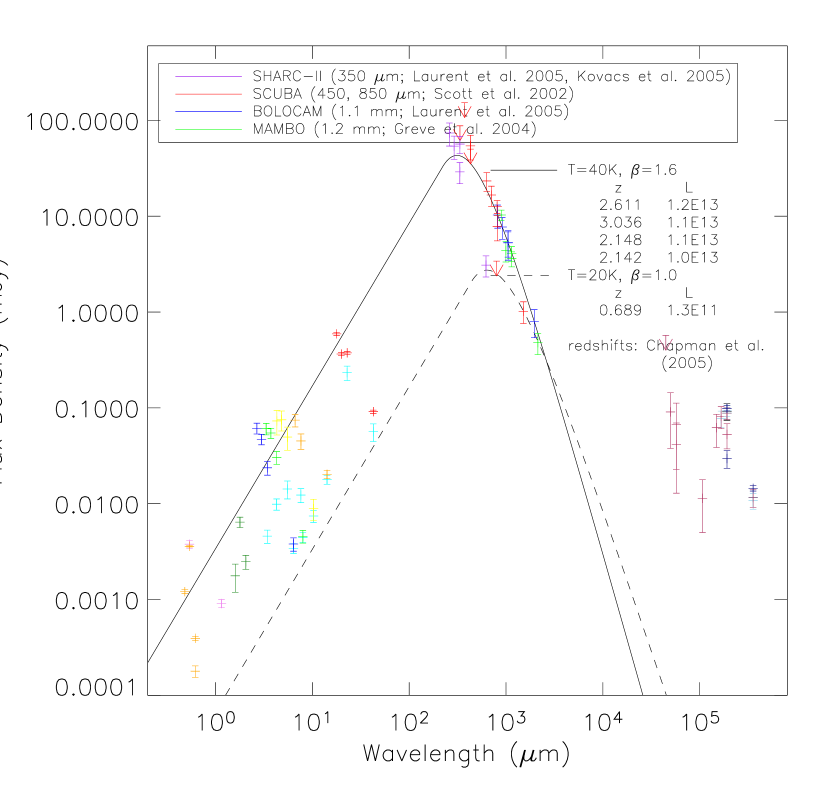
The submillimeter spectral energy distributions (SEDs) of the coincident SHARC / Bolocam detections is shown in Figure 3. Five of the 17 Bolocam galaxy candidates (5, 8, 14, 16, 17) have spectroscopic redshifts from Chapman et al. (2005, see Appendix B). In order to properly compare the SEDs, it is necessary to shift each of the SEDs to a common redshift. Thus, each observed SED was brought to a redshift of 2.0 (the mean redshift of the five Bolocam galaxies) using the spectroscopic redshifts. The composite SED of these five Bolocam galaxies can be seen in Figure 4.

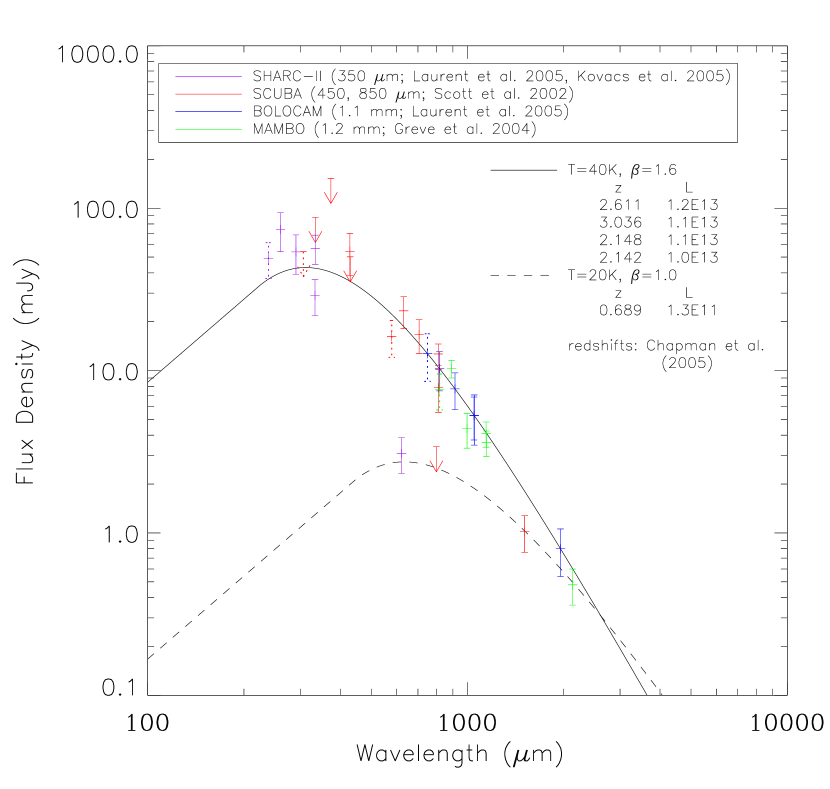
In addition to redshifting the SEDs to align their rest wavelengths, a cosmological dimming term was applied by assuming a flat (), = 0.7 cosmology. Finally, to account for variations in their intrinsic brightnesses, we normalize the flux densities of these five Bolocam galaxies by tying together their SEDs at the observed Bolocam wavelength of 1.1 mm. To account for the spread of the redshifted wavelengths of the 1.1 mm Bolocam observations, the flux densities were normalized to the Laurent et al. (2005) model based on the observations cited in the Blain et al. (2002) paper. The model assumes a single dust temperature of 40 K () and is overplotted as a solid line in Figure 4. Note that only the Bolocam observations are constrained to pass through this model.
Upon inspection, we find that at least four of the five Bolocam galaxies with spectroscopic redshifts (5, 8, 14, 16) exhibit very similar SEDs in the submillimeter and millimeter wavelengths. They are modeled adequately by the 40 K composite SED based on nearby dusty IRAS galaxies, high redshift submillimeter galaxies, gravitationally lensed high-redshift galaxies, and high redshift AGN. The Bolocam galaxy 17, however, appears to peak at a much higher wavelength and lower flux density than the others. We believe that there is enough source confusion to question whether the Chapman et al. (2005) redshift for this galaxy ( = 0.689) corresponds to the SED shown (see § 5.4). If the spectroscopic redshift is valid, the SED is modeled much better by a T = 20 K () grey-body dust spectrum.
5 Redshifts
5.1 Introduction
With the multiwavelength photometry of the Bolocam sources, we fit photometric redshifts using various models based on different portions of the SED. Photometric redshifts based on the far-IR-to-radio correlation were derived using the models of Carilli & Yun (1999) and Yun & Carilli (2002). The shape of the submillimeter and millimeter part of the spectrum was also fit without the radio points, assuming a blackbody emission spectrum modified by a dust emissivity term (Wiklind, 2003; Laurent et al., 2005). A brief description of each of the models, fitting methods, and the redshift results are discussed in the next section.
5.2 Redshift Techniques
This section attempts to briefly describe each of the five photometric redshift techniques used in this paper and the results of the fits when applied to the Bolocam galaxy candidates. The following section will compare the relative merits of each of the photometric redshift fitting techniques and discuss the results of redshift distributions.
1) FIR-Radio Spectral Index – Carilli & Yun (1999) used the semianalytic, linear relationships derived by Condon (1992) between the massive star formation rate and the radio synchrotron luminosity and far-IR dust emission from active star-forming galaxies to show that the spectral index between these two frequencies, , is a well behaved function of redshift:
| (1) |
where we adopt the standard value in Condon (1992) of -0.8 for , and a value of +3.2 for (an average of the spectral indices between 270 and 850 GHz for M82 and Arp 220. The relation is believed to be a result of relativistic electrons accelerated in supernova remnants (producing synchrotron radiation) and dust heated by the interstellar radiation field (with a thermal peak of m for a galaxy with and T = 40 K). Photometric redshifts determined using only the Bolocam and radio flux densities are listed in Table 2. Redshift results from Bolocam sources with multiple radio counterparts are listed using the higher S/N detection in the case of coincident detections by independent surveys or are listed together in the case of multiple counterparts detected by a single group.
The error bars listed in Table 2 (and elsewhere throughout this paper) were obtained from Monte-Carlo simulations of the fits and represent statistical errors due to measurement uncertainty in the flux densities. The flux densities at each observed wavelength were varied about their mean value assuming a Gaussian distribution of flux errors. Each Monte-Carlo SED was then fit to the photometric redshift models with a standard, least-squares minimization fitting routine. Each simulation was repeated 1000 times, with the error bars quoted being the minimum-length 1 confidence intervals from the resulting histogram of redshifts. It should be noted that these confidence intervals represent only the statistical goodness of fit and that uncertainties in the templates themselves are expected to dominate the photometric redshift errors.
2) Entire FIR-Radio SED – Yun & Carilli (2002) utilized the entire Far-IR to radio spectral energy distribution to estimate photometric redshifts and SFRs. The redshift template is based upon the theoretical models of thermal dust emission, thermal bremsstrahlung (free-free) emission, and nonthermal synchrotron emission for dusty starburst galaxies. Photometric redshift fits of the five Bolocam galaxy candidates (5, 8, 14, 16, 17) with spectroscopic redshifts (Chapman et al., 2005) are shown in Figure 5, with best-fit redshifts (and errors) also listed in Table 2. The solid lines in the figure represent the best fit spectrum to the submillimeter, millimeter, and radio point shown. The dotted line represents a second fit using the Yun & Carilli (2002) model, this time fixing the spectroscopic redshift and normalizing (varying only the SFR) to the submillimeter points.

| Bolocam | NRadio | NSubmm | NSpitzer | Carilli & Yun | Yun & Carilli | Wiklind | Laurent | MRK231 | ARP220 | Chapman |
|---|---|---|---|---|---|---|---|---|---|---|
| 1.1 mm | 1999 | 2002 | 2003 | et al. 2005 | et al. 2005 | |||||
| Number | zphot | zphot | zphot | zphot | zphot | zphot | zspec | |||
| 1 | 2(S) | 3 | 3 | 4.6 | 4.1 | 3.2 | 3.2 | 15 | 3.0 | |
| ” | 1(N) | ” | 3 | 4.6 | 4.1 | ” | ” | 1.8 | 2.0 | |
| 2 | 2,1(N,S) | 2 | 0 | 2.2, 3.9 | 0.6, 2.9 | 4.2 | 3.9 | |||
| 3 | 2(NE) | 2 | 5 | 2.6 | 0.7 | 4.7 | 4.2 | 0.2 | 3.1 | |
| ” | 2(SW) | 2 | 3 | 3.7 | 1.6 | 4.9 | 4.3 | 10 | 2.3 | |
| 4 | 1 | 2 | 0 | 5.7 | 5.1 | |||||
| 5 | 3(E) | 4 | 5 | 4.3 | 3.4 | 2.5 | 2.6 | 1.2 | 2.6 | 2.611 |
| 6 | 2,2(E,W) | 2(E) | 0 | 4.2, 3.1 | 3.5, 2.0 | 3.2 | 3.2 | |||
| ” | 2 | 2(W) | 0 | 1.6 | 0.8 | 1.9 | 2.0 | |||
| 7 | 1 | 1 | 0 | 4.2 | 3.6 | |||||
| 8 | 2(N) | 4 | 4 | 5.1 | 4.7 | 3.1 | 3.1 | 0.6 | 2.4 | |
| ” | 1(S) | ” | 4 | 5.1 | 4.7 | ” | ” | 0.7 | 3.1 | 3.036 |
| 9 | 2 | 1 | 5 | 3.9 | 3.2 | 1.3 | 1.8 | |||
| 10 | 0 | 1 | 0 | |||||||
| 11 | 1 | 1 | 2 | 3.2 | 2.5 | 0.4 | 0.8 | |||
| 12 | 0 | 1 | 0 | |||||||
| 13 | 2,1(NE,SE) | 1 | 0 | 3.9, 4.8 | 3.2, 4.4 | |||||
| ” | 1(E) | ” | 4 | 5.0 | 4.6 | 0.7 | 2.4 | |||
| 14 | 4 | 5 | 5 | 3.7 | 3.1 | 3.2 | 3.2 | 7.3 | 3.0 | 2.148 |
| 15 | 1 | 1 | 5 | 4.1 | 3.5 | 0.6 | 1.0 | |||
| 16 | 2 | 4 | 5 | 4.1 | 3.2 | 1.9 | 2.0 | 0.4 | 2.3 | 2.142 |
| 17 | 3(SE) | 4 | 10 | 3.8 | 2.8 | 3.4 | 3.3 | 3.4 | 3.1 | 0.689 |
| ” | 1(NW) | ” | 5 | 5.3 | 4.1 | ” | ” | 0.3 | 3.0 |
Note. — Best fit photometric redshifts of the Bolocam galaxy candidates using the models of Carilli & Yun (1999), Yun & Carilli (2002), Wiklind (2003), and Laurent et al. (2005), and cool and warm ULIRGs Arp 220 and MRK 231. NRadio, NSubmm, and NSpitzer are the number of coincident radio, submillimeter and Spitzer infrared points, respectively.
3) Modified Blackbody – Wiklind (2003) found that observations of local ULIRGs exhibit a remarkably low dispersion in the far-IR to millimeter wavelengths (m), independent of whether the power source of the thermal emission is due to AGN or intense star formation. Wiklind (2003) fit a simple blackbody emission spectrum (modified by a dust emissivity term) to sample of 37 local ULIRGs from Klaas et al. (2001):
| (2) |
where is the Planck function evaluated at dust temperature, , and frequency, , and is the optical depth of the dust:
Wiklind (2003) made no assumption about the Wien side of the spectrum, as only the submillimeter ( 450 m) and millimeter points were fit. Using the best-fit parameters from Wiklind (2003): , Hz (250 m), and K, we fit photometric redshifts to the SHARC II 350 m, SCUBA 450 and 850 m, Bolocam 1.1 mm, and MAMBO 1.2 mm flux densities of the galaxies detected in our Bolocam survey. The two parameter fit (redshift and overall flux density normalization) yields redshifts for 9 of the 17 bolocam galaxies with 2 submillimeter/millimeter points. Seven of the Bolocam galaxies (Bolocam 7, 9, 10, 11, 12, 13, 15) have no counterpart in the submillimeter/millimeter and one (Bolocam 4) has detections only at 1.1 and 1.2 mm, which is an insufficient wavelength spread in order to properly constrain the galaxy redshift using this two parameter model. Redshift results for each of the 9 Bolocam galaxies are listed in Table 2. The best fit models to the five galaxies with Chapman et al. (2005) redshifts (Bolocam 5, 8, 14, 16, 17) are shown in Figure 6.

Similar to the method of Wiklind (2003), Laurent et al. (2005) created a composite SED of nearby dusty IRAS galaxies, high-redshift submillimeter galaxies, gravitationally lensed high-redshift galaxies, and high-redshift AGNs (Blain et al., 2002, and references therein), and found fit parameters of = 40 K, = 3700 GHz, and = 1.6 for Equation 2. Redshift results for each of the 9 Bolocam galaxies are listed in Table 2. The best fit models to the five galaxies with Chapman et al. (2005) redshifts (Bolocam 5, 8, 14, 16, 17) are shown in Figure 6.
4) Near IR Stellar Bump – Egami et al. (2004) used the multiband imaging capabilities of the IRAC and MIPS IR cameras of the Spitzer Space Telescope to observe 38 VLA radio sources in the Lockman Hole. They classified the resulting IR SEDs into two types: those showing a clear near-IR stellar continuum hump at a rest wavelength of 1.6 m (due to the minimum opacity of the H- ion at 1.6 m from photo-detachment and free-free transitions, which results in a local maximum in the the SEDs of cool stars, Sawicki 2002), and those with a featureless power-law continuum (from AGN). We fit the Spitzer IR counterparts of the Bolocam galaxies with each of these spectra, using the Egami et al. (2004) models of a cool ULIRG Arp 220 (from Silva et al., 1998) and a warm (dominated by an AGN) ULIRG Mrk 231. Only two fit parameters were used: the redshift, and an overall normalization. Photometric redshifts were fit for each of the 12 Bolocam galaxies (Bolocam 1, 3, 5, 8, 9, 10, 11, 13, 14, 15, 16, 17) with 2 IR Spitzer points. Three Bolocam galaxies (Bolocam 2, 6, 12) were outside of the field surveyed by Egami et al. (2004). Two galaxies (Bolocam 4, 7) have Spitzer counterparts, but due to the high density of Spitzer sources in the field, they could not be uniquely associated with the Bolocam sources (because of a lack of another coincident detection in the submillimeter and/or radio). The best-fit photometric redshifts for both Arp 220 and Mrk 231 (fitting only the Spitzer near- and mid-infrared points) are shown in Figure 7, with the resulting redshifts also listed in Table 2.

5.3 Comparison of Photometric Redshift Techniques
Comparing the results of each of the photometric redshift techniques with the spectroscopic redshifts of Chapman et al. (2005) yields widely varying degrees of agreement. Histograms of redshift errors for each of the photometric redshift models (other than Carilli & Yun, 1999, in which coincident radio detections were treated separately) are shown in Figure 8. The histogram from fitting models of Arp 220 and Mrk 231 to the Spitzer IRAC and MIPS observations are the fits that result in the lowest residual (Arp 220 for Bolocam 5, 8, 14, and 16, and Mrk 231 for Bolocam 17).
The Yun & Carilli (2002) model (as well as Carilli & Yun, 1999) yields systematically high photometric redshifts compared to the spectroscopic redshifts by Chapman et al. (2005). The comparison of model SEDs for photometric (solid line) and spectroscopic (dotted line) redshifts in Figure 5 suggests that SED data points at the extreme ranges of wavelength coverage strongly influence the model fit and that the systematic tendency to derive a high redshift is primarily driven by the lower than expected radio continuum flux density. This is supported by the fact that fits to only the submillimeter and millimeter-wave points yield much more accurate photometric redshifts (see below). This is perhaps not surprising, given recent evidence (Chapman et al., 2005) suggesting a large degree of dispersion in the radio-to-far-IR correlation at higher redshift. Nevertheless, it is unlikely that the Yun & Carilli (2002) model template, which is derived from the ensemble average of 23 infrared luminous galaxies in the local universe, is systematically biased by radio bright objects because 98% of all FIR-selected galaxies follow the well known and tight radio-FIR correlation, independent of FIR luminosity (Yun, Reddy, & Condon, 2001). Aside from Bolocam source 17 whose spectroscopic redshift by Chapman et al. (2005) appears suspect (see § 5.4), these comparisons suggest that the observed radio continuum in Bolocam galaxies is 2-5 times fainter than predicted by the synchrotron flux densities (which dominate thermal brehmsstrahlung by a factor of 13 at 20 cm) from the low-redshift ULIRGs for which the local FIR-radio correlation was derived (see further discussions in 6.2).

In contrast to the far-IR-to-radio correlation photometric redshift techniques, both the Wiklind (2003) and Laurent et al. (2005) modified blackbody curves correctly estimate the redshifts for three of the five Bolocam galaxies with spectroscopic redshifts (within the uncertainties of the photometric redshift techniques). The strength of the submillimeter / millimeter-only photometric redshift technique is twofold. First, while abandoning the radio points limits the number of points (as few as two, in some cases) to which we may fit a model, we ensure that the physics that dominates the region of the spectrum to which we are fitting is directly relevant to star formation-heated dust emission. Synchrotron radiation, by contrast, is dependent upon high energy electrons streaming through interstellar magnetic fields, whose properties may vary as a function of environment (e.g. inverse-Compton losses for cosmic rays with higher CMB energy densities at high redshift – see § 6.2). Indeed, these galaxies are typically at least an order of magnitude more luminous than the low-redshift, infrared-luminous galaxies from which the FIR-radio correlation was derived.
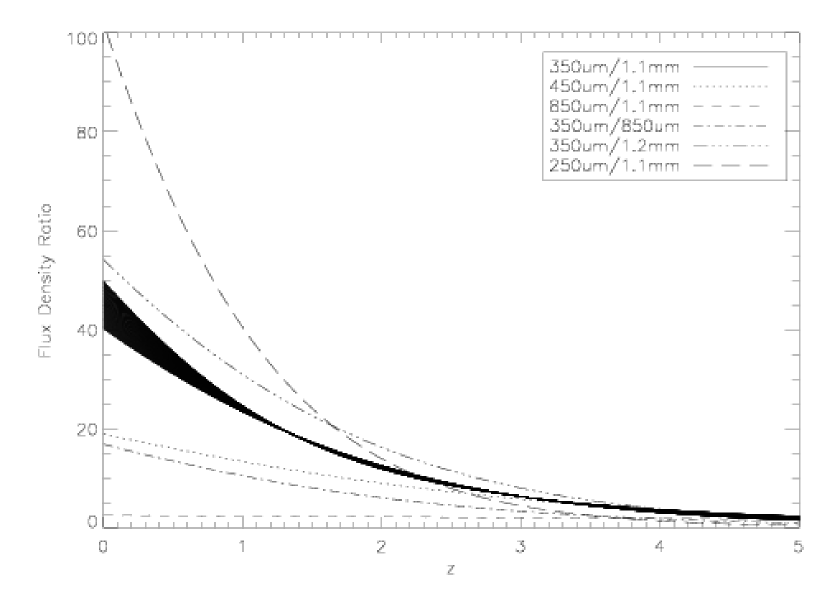
Second, having the Bolocam 1.1 mm flux densities on the Rayleigh-Jeans side of the spectrum and the SHARC II 350 m flux densities near the peak of the SED makes the 350 m/1.1 mm flux density ratio a strong function of redshift. This can be seen in Figure 9, which shows the flux density ratios between various wavebands based on the Laurent et al. (2005) model SED. The importance of the SHARC II 350 m waveband is apparent. For intermediate to high () redshifts, the SHARC II flux density drops rapidly as a power law ( due to the hotter components of dust) with redshift on the Wien side of the spectrum, while the millimeter-wave climbs up the steep Rayleigh-Jeans portion of the SED. Photometric redshifts using the 450 or 850 m wavebands are less sensitive than the 350 m / 1.1 mm wavebands. Extending this analysis shows the discriminatory power of the BLAST and Herschel space telescope 250 m bands in conjunction with a millimeter waveband, although the far-IR waveband begins to probe a range of hotter dust temperatures. (The flux density ratio of these wavebands may not be well correlated, as discussed in § 6.1.) BLAST (Balloon-borne Large-Aperture Submillimeter Telescope, Devlin et al., 2001) is a balloon-based instrument which incorporates a 2-meter primary mirror and is equipped with large-format bolometer cameras operating at 250, 350, and 500 m which, when complete, will provide the first sensitive large-area (0.5-40 deg2) submillimeter surveys at these wavelengths. The bolometer arrays are prototypes of the Spectral and Photometric Imaging Receiver (SPIRE) focal plane cameras for the Herschel satellite (Griffin, Swinyard & Vigroux, 2001), which will further investigate the formation and evolution of AGNs and star formation in high redshift submillimeter galaxies.
It is important to note that while both the Wiklind (2003) and Laurent et al. (2005) modified blackbody curves both produce reasonably accurate photometric redshifts (and produce nearly identical SEDs on the Rayleigh-Jeans portion of the spectrum), they make substantially different assumptions about the dust properties: and are 68 K and 1.8 for the Wiklind (2003) model SED and 40 K and 1.6 for the Laurent et al. (2005) model SED. This points to the degeneracy of the dust temperature and the grain emissivity index. While the shapes of the submillimeter SEDs are reasonably modeled by either dust model and thus predict photometric redshifts with some accuracy, essentially no information about the dust temperatures can be inferred. In fact, representing the dust SED with two (or more) components produces similar values (and thus similar redshifts), with both temperatures lower than that of the single dust temperature model (Wiklind, 2003).
The photometric redshifts determined by fitting the Spitzer infrared observations yield redshifts that are equivalent to both the Laurent et al. (2005) and Wiklind (2003) model SEDs. This confirms the conclusions of Egami et al. (2004), in which starburst-dominated galaxies (”cold”) show remarkably similar SEDs in the infrared. The resulting photometric redshifts are highly sensitive to the 1.6 m continuum hump (and PAH features), with a sharp minimum in . (The ARP 220 fits may be biased towards particularly good fits as 4 of the 5 galaxies with spectroscopic redshifts lie between 2 3, which is optimal for the 8 m PAH feature to be shifted into the observed 20 m IRAC waveband.) AGN-dominated (”warm”) galaxies also show very similar SEDs, but lacking a strong continuum feature in the infrared, are subject to larger redshift fitting uncertainties; a brighter, higher redshift galaxy is characterized by a similar shape in the infrared portion of the SED as a cooler, low-redshift galaxy, with the Wien side of the spectrum well-modeled with a power-law (Blain et al., 1999).
5.4 Bolocam Source 17: Spectroscopic Misidentification?
We bring special attention to photometric redshift analysis of Bolocam source 17 (corresponding to SCUBA source 8), as the Laurent et al. (2005), Wiklind (2003), and Spitzer IR models are consistent in overpredicting the redshift of this galaxy ( = 0.689) by ( = 3.3, 3.4, and 3.4, respectively). We point out that the large offset between the spectroscopic and photometric redshifts is possibly the result of source confusion, as two radio sources (both with Spitzer and optical counterparts) fall near the center of the Bolocam, SCUBA, MAMBO, and SHARC II error circles, within 4 of each other. (Egami et al. 2004 refer to the northwest and southeast radio sources as LE850.8a and LE850.8b, respectively.) The northwest radio source is believed by Lehmann et al. (2001) to be the counterpart to the ROSAT X-ray emission, who find a redshift of 0.974 using optical Keck spectroscopy. Using XMM-Newton observations, however, Ivison et al. (2002) conclude that the X-ray source corresponds to the southeast radio source. Indeed, the linear fit of a combination of ARP 220 and MRK 231 ULIRG models to the Spitzer points coincident with the southeast radio source yields a 100% warm (AGN dominated) component. It is near this radio position that Chapman et al. (2005) find a spectroscopic redshift of 0.689. In fact, the X-ray emission observed with both instruments appears to fall between these two radio sources. Optical R-band images from both Yun et al. (2005), and Ivison et al. (2005) show multiple optical counterparts at the southeast radio source position. Furthermore, the spectroscopic position quoted by Chapman et al. (2005) appears to coincide with an optical source 2 to the south of the southeast radio source, a source detected with four-color SDSS photometry (in addition to Yun et al. 2005 and Ivison et al. 2005 R-band photometry) and cataloged as a low-redshift galaxy. We conclude that it is possible that the submillimeter detections may either be suffering from source confusion from two or more galaxies, or that the Chapman et al. (2005) redshift corresponds to a source other than that of the southeast radio detection. If the latter is true, then the consistent redshifts predicted by the Laurent et al./Wiklind (2005, 2003) and Spitzer IR models may further point to the accuracy of these photometric redshift techniques.
6 Discussion
6.1 IR Spectrum
SEDs over the entire IR-radio spectral range of the five Bolocam galaxies with spectroscopic redshifts are shown in Figure 10. These spectra have the same redshift, cosmological dimming, and normalization corrections as in Figure 4. While four of the five galaxies have closely correlated spectra in the submillimeter region of the spectrum, the infrared spectra (Spitzer 3.6, 4.5, 5.8, and 8.0 m IRAC and 24 m MIPS observations) exhibit a large degree of dispersion. This dispersion may be the result of several things: 1) Because the spectra have been normalized to a T = 40 K () spectrum at their 1.1 mm Bolocam flux densities to account for intrinsic brightness variation between the galaxies, the normalization will result in an artificial reduction in the submillimeter flux density dispersions. This effect is not likely to dominate, as the flux density normalization has a 10% effect on the flux densities of the galaxies. 2) The Spitzer detection associated with Bolocam source 14 lies systematically low compared to the other three galaxies well-modeled by a T=40 K dust spectrum. While these Spitzer observations (Egami et al., 2004) are from a different data set than the remaining Spitzer observations (this work), it is unlikely that their flux densities are systematically uncertain by nearly an order of magnitude. 3) The 40 K dust temperature model of the submillimeter portion of the spectrum for Bolocam sources 5, 8, 14, and 16 assume a single dust temperature for each of the four sources. The temperature fit parameter is somewhat degenerate with other fit parameters, including the critical frequency, , where the optical depth of the dust is unity. Thus, if Bolocam source 14 has a lower characteristic dust temperature, then the infrared portion of the 40 K model will significantly overestimate the infrared flux density. Chapman et al. (2005) estimates the temperature of Bolocam source 14 to be 33 K from two photometric points (850 m SCUBA and 1.4 GHz VLA radio observations) and the dust SED templates of Dale & Helou (2002). This temperature uncertainty likely dominates our uncertainty in matching the infrared flux densities. 4) In addition to heating by the ultraviolet and optical flux density from young stars associated with ongoing star formation, the thermal dust emission responsible for the bright submillimeter flux densities may be contributed to by an energetic AGN. While not dominating the total bolometric output from the galaxy, they may have a non-negligible (20%) contribution (Alexander et al., 2005). If this is the case, then the shape of the infrared continuum may be vary according to the relative contribution of star formation rates for these galaxies. 5) Another possible explanation for the larger dispersion in Spitzer infrared flux density as compared to our single dust temperature model may be from the fact that the infrared flux densities trace separate epochs of star formation within the galaxy. It is plausible that the dust heated by the ultraviolet and optical flux density from from current star formation is not well correlated to the current infrared flux density of older stars (from previous star formation). Furthermore, models of UV to millimeter emission of star clusters embedded in optically thick giant molecular clouds (GMCs) suggest that the near-infrared to far-infrared portion of starburst galaxy SEDs vary considerably with age of the starburst (Efstathiou, Rowan-Robinson, & Siebenmorgen, 2000).
6.2 Radio Spectrum / FIR-Radio Correlation
The composite SED (including the radio points) of the 5 Bolocam sources with spectroscopic redshifts is shown in Figure 10. Two interesting observations can be made about the radio continuum emission associated with these galaxies: (1) the radio continuum is lower (or the submillimeter continuum is higher) on average than the well established radio-FIR correlation for the local universe by Yun, Reddy, & Condon (2001, cf. § 5.3); and (2) like the infrared flux densities, the 6 and 20 cm VLA radio flux densities for the four galaxies with closely correlated spectra in the submillimeter region of the spectrum show a large degree of dispersion (factor of 5 in 20 cm flux density). This scatter is much larger than the quoted uncertainties of the VLA radio observations (which constrain the 20 cm radio flux density of each galaxy to better than 20%) This degree of dispersion is also larger than the factor of 3 scatter in the radio-FIR correlation seen among the FIR selected galaxies in the local universe. In fact, while the spectroscopic redshifts are similar for the four galaxies (2.1 3.0), varying the 20 cm flux density over the observed range causes the best fit photometric redshifts of Yun & Carilli (2002) to vary from to 4.8. This dispersion undoubtably contributes to the large errors of the photometric redshifts discussed in § 5.
Deep radio continuum imaging using the VLA is a technically challenging task, and the disparate 20 cm flux densities by 50% reported for Bolocam sources 2 and 6 (cf. § 4.2) exemplifies the difficulty of the photometry at radio wavelengths. Most systematic noises in interferometry tend to suppress the brightness of astronomical sources, and part of the lower radio continuum flux density might be related to the imaging and photometry problems.
It is important to note that due to the low S/N ratios at which the sources have been detected in the submillimeter wavebands ( for the vast majority of SHARC, SCUBA, Bolocam, and MAMBO detections), flux bias (Laurent et al., 2005) plays a major role in overestimating the flux densities at these wavelengths. While this factor indeed results in a systematic shift of the entire submillimeter portion of the spectrum to higher flux densities, it is unlikely that the magnitude of this effect ( 20% for the Bolocam flux densities) could fully account for the lower than expected (from the FIR-radio correlation) radio continuum flux densities. Calibration errors may also contribute to a systematic overestimate of the submillimeter flux densities. Finally, as two or more independent radio sources are found within the Bolocam error circle in 8 out of 17 cases in Figure 2, source confusion or source blending may also contribute to the apparently lower radio continuum flux if only one radio source is identified as the counterpart.
The lower radio continuum flux density and the larger scatter may also reflect an actual breakdown in the radio-FIR correlation. Inverse-Compton losses for the high energy cosmic rays responsible for the synchrotron radiation is thought to be significant at , and a possible breakdown in the radio-FIR correlation has been considered previously (see Condon 1992, Carilli & Yun 2000). This effect is demonstrated in Figure 7, in which models of local ULIRGs Arp 220 and Mrk 231 systematically overestimate the radio flux densities of these submillimeter galaxies. Higher quality data on a larger sample of high redshift systems are needed to examine the importance of inverse-Compton loss and the possible breakdown in the radio-FIR correlation.
X-ray heating of the circum-nuclear gas and dust is an important source of luminosity in the far-IR if a luminous AGN is present (Maloney, Hollenbach, & Tielens 1996). Radio-quiet AGN FIR emission could reduce the 1.4 GHz flux density with respect to the FIR heating. Alexander et al. (2005, and references therein) make the case using X-ray detections and spectral indices that many, perhaps most, submillimeter galaxies have AGN but that they are not bolometrically important. However, the statistics of X-ray detected submillimeter galaxies for which hard/soft ratios can be measured is not large and it cannot be ruled out that many submillimeter galaxies are Compton thick (NH 1.5 1024 cm-2). We conclude that the generally low radio flux densities in our sample could be due to small number statistics, source confusion, or generally depressed radio emission, perhaps due to quenching of high energy cosmic rays, although radio-quiet, Compton-thick AGN contributions to the dust heating cannot be ruled out. There are new AGN versus star formation spectral diagnostics emerging (Ivison et al., Egami et al.), and it is possible that to definitively settle the issue may ultimately require ALMA, Constellation-X, and interferometric FIR spectral line diagnostic capability.
6.3 Inferred Luminosities
To obtain the intrinsic bolometric luminosities of the five Bolocam galaxies with spectroscopic redshifts, the spectra of § 4.4 (based on the Laurent et al. 2005 model) were integrated for each galaxy in their respective rest frames. The resulting bolometric luminosities are listed in Figure 4. The four galaxies well-modeled by a 40 K dust spectrum have luminosities ranging from . The lower redshift galaxy (Bolocam source 17) has an inferred luminosity two orders of magnitude lower ( ). If the spectroscopic redshift of 0.689 does not apply to this galaxy and it instead lies at = 3.4 (the photometric redshift predicted by the Laurent et al. 2005 / Wiklind 2003 and Spitzer IR models), then its luminosity of agrees well with the others.
6.4 Stellar and Dust Masses Implied from the Integrated Submillimeter Luminosities
Three hundred and fifty micron observations combined with far-infrared and millimeter-wavelength photometry enables accurate measurements of luminosity for galaxies near = 2 because no interpolation across the peak of the SED is required. Characteristically, integration of the SEDs of the galaxies in our sample from far-infrared to millimeter-wavelengths yields luminosities of 1 1013 L⊙. Assuming: 1) that the luminosity derives from star formation (young stars, which may overestimate stellar masses due to contribution from intermediate mass giants), 2) a characteristic (Salpeter) form of the initial mass function (IMF) from Chabrier (2003), and 3) all of the optical and ultraviolet radiation is reprocessed to long wavelengths by dust, enables the stellar mass content of the galaxies to be approximately estimated. We adopt the luminosity function of Demircan & Kahraman (1991). Because the luminosity function is so steep, the derived mass depends strongly on the assumed upper mass limit of integration. The lower limit of integration is not well constrained by the data, although masses less than 0.3 M⊙ are not likely to dominate the mass because the IMF flattens considerably at low mass. Lower mass limits of 0.7 and 1.0 M⊙ could be relevant because: 1) Dwek et al. (1998) argued that a Salpeter IMF for 1 galaxies cannot extend much lower than this without producing too many low mass stars that would be present today and 2) Chabrier (2003) suggests (with caution) that the high-z IMF could cut off 1 M⊙ based on multiple circumstantial lines of evidence. Varying from 0.3 to 1.0 M⊙ and limiting to 50 M⊙ yields a mininum stellar mass of 1010 M⊙ and a maximum of a few 1011 M⊙, consistent with the stellar mass content of large elliptical galaxies, as previously pointed out by many authors (e.g., Smail et al., 2002; Lilly et al., 1999). This range must be considered an upper limit because AGN could be responsible for some of the dust heating.
For all of the galaxies with secure 350 m detections, especially those with Chapman et al. (2005) spectroscopic redshifts, it is clear that the Bolocam 1.1 mm observations lie on the optically thin Rayleigh-Jeans side of the SED, and therefore enable dust mass estimates. The flux density, , of a galaxy at an observed frequency, , is related to the dust mass, M, by
where is the luminosity distance to redshift z, is the Plank function evaluated at the emitted frequency, , and is the dust opacity. Using the range of observed Bolocam flux densities (4.0 - 6.8 mJy), assuming a redshift of 2.1, and applying the dust cross section of = 12.4 cm2/g (Ossenkopf & Henning, 1994) most relevant for high mass star formation (high gas density and thin ice mantle model), leads to dust masses of 3 - 5 108 M⊙ (2 - 3 108 M⊙) for a dust temperature of 40 K (50 K). Blindly applying a dust-to-gas mass ratio of 1/100 implies gas masses of 3 - 5 1010 M⊙. These gas masses are comparable to those from a recent sample of 8 submillimeter galaxies of Genzel et al. (2004) and Neri et al. (2003) which yield median molecular gas masses (from CO emission) of 2.2 1010 M⊙ and 2.8 1010 M⊙, with median dynamical masses of 1.1 1011 M⊙ and 6.2 1010 M⊙ (assuming the most probable inclination angle of sin ), respectively. These gas mass estimates are uncertain to at least a factor of a few due to 1) the Bolocam flux density bias, which causes the measured flux densities to be overestimated by 10 - 30%, 2) our assumed values of and T, which may vary by a factor of a few and 20 K, respectively, and 3) increasing our assumed redshift of 2.1 (the mean of the 5 Chapman spectroscopic redshifts of the Bolocam galaxies) to = 2.4 increases our calculated gas mass by 30%. Nevertheless, taking these factor into account still imply that a considerable fraction of the mass could already by in stars and substantial gas remains for star formation. This major epoch of galaxy formation at approximately = 2 is consistent with the conclusions of Fontana et al. (2004) from spectral fitting of a sample of 500 elliptical galaxies at 0.2 2.5 that approximately 35% of elliptical galaxy stellar mass was assembled by = 2 and approximately 80% by = 1.
7 Conclusions
We have obtained 350 m SHARC II observations toward galaxy candidates from the Bolocam Lockman Hole survey. The Lockman Hole has rich, deep, multiwavelength observations enabling detailed studies of galaxies. The 350 m photometry is near the peaks of the SEDs of galaxies with characteristic temperatures of 50 K and redshifts of 2 to 3. They therefore enable measurements of luminosities and estimates of temperatures and photometric redshifts without interpolating over the peak of the FIR thermal SEDs. Seven galaxies detected at 1.1 mm with Bolocam were detected at 350 m, two of which have two 350 m counterparts; these were combined with two 350 m detections from the survey of Kovács et al. (2005), bringing the total number of Bolocam galaxies detected with SHARC II to nine. Two additional galaxies not associated with the Bolocam sources were also detected. The SHARC II detections range in significance from 3.0 to 6.8 , with flux densities ranging from 14 mJy to 64 mJy.
We combined our observations with 850 m and 1.2 mm photometry from the literature to fit the submillimeter/millimeter-wave spectra to thermal dust models. We found that two models with significantly different dust temperatures (40 K and 68 K) and spectral indices (1.6 and 1.8, respectively) yielded similar quality fits owing to the degeneracy in T and , rendering them indistinguishable without better SED sampling. However, there is little consequence of the degeneracy to the derived luminosities, photometric redshifts, and dust masses within the statistical uncertainties. Five of the galaxies have spectroscopic redshifts in the literature, with four ranging from = 2.1 to 3.0 and one at = 0.689. The four high-z galaxies have luminosities of (1.0 - 1.2) 1013 L⊙, while the = 0.689 galaxy is best fit by a 20 K, = 1.0, spectrum with a much lower luminosity: 1.3 1011 L⊙. (Given the source confusion in the optical and radio, along with consistent photometric redshifts, we suggest that the = 0.689 spectroscopic redshift of Bolocam source 17 may be a misidentification.) The characteristic dust masses for the four high- spectroscopic galaxies are 4 108 M⊙, implying gas masses of 4 1010 M⊙. The dominant uncertainties in this estimation are the dust opacity and the gas-to-dust conversion factor, which make the estimation uncertain to a factor of a few. Assuming a Salpeter IMF and that the submillimeter emission derives completely from star formation yields stellar masses of 1010 to a few times 1011 M⊙, broadly consistent with the stellar content of modern-day elliptical galaxies.
The photometric redshifts of the full sample of seven galaxies span the range of = 2.0 to = 4.3, with statistical uncertainties of = 0.3 to 0.6 (1 ). Photometric redshifts utilizing composite radio/FIR spectra representative of local star-forming ULIRGs yields systematically higher redshifts, on the order of = 1. For the four galaxies with optical spectroscopic redshifts the anomolously high redshifts arise from systematically low 1.4 GHz observed flux densities. The discrepancy could arise from small number statistics, inverse-Compton losses of high energy cosmic rays off the CMB, heating by radio-quiet AGN, or suppressed synchrotron emission from supernova remnants in the unusually luminous galaxies. For comparison, photometric redshifts derived using only Spitzer MIPS and IRAC data points yielded slightly more precise and accurate redshifts than the submillimeter/millimeter-wave data alone, with discriminatory power between heating by AGN and star formation (albeit with limited bolometric luminosity constraints).
Appendix A Multiwavelength Coverage
Observations at both longer and shorter wavelengths are necessary to characterize high redshift submillimeter galaxies. Radio identifications provide precise astrometry which allow optical and infrared counterparts to be identified. The radio observations detect the synchrotron emission (presumably from high energy cosmic rays associated with supernova explosions, see review by Condon 1992), which is known to be correlated to the far-infrared luminosity (and is thus correlated to the Bolocam flux density, which traces the dust emission that is responsible for the infrared luminosity). The Bolocam and radio points may then be used to obtain temperature and redshift estimates. Multiple submillimeter wavelengths are essential in confirming the Bolocam sources and allow for a photometric redshift measurement that is independent of the radio-to-far-IR correlation (i.e. using only the submillimeter portion of the spectrum for an assumed temperature). Furthermore, a third photometric redshift estimate using the 1.6 m bump in the stellar emission spectrum is possible using the near- and mid-infrared portion of the spectrum. In this appendix we briefly discuss the multiwavelength coverage (submillimeter, radio, infrared, optical, and X-ray) of the Lockman Hole and the coincident detections of each survey. Figure 2 presents an overview of the Bolocam detections, including all of the submillimeter, radio, and infrared counterparts.
A.1 Submillimeter Surveys
Four submillimeter / millimeter surveys of the Lockman Hole region are considered. Three of the surveys (Bolocam, SCUBA, MAMBO) represent blank-field surveys, while the SHARC II survey covers only the 17 Bolocam sources. The surveys include:
1) Entire Bolocam Lockman Hole survey at 1.1 mm (Laurent et al., 2005). The survey covers 324 arcmin2 down to an RMS of 1.4 mJy/beam and includes 17 source candidates ( 3 ) ranging in flux densities from 4.0 to 6.8 mJy. Extensive simulations and jackknife tests yielded 6 expected false detections. The Bolocam beam size is 31 and observations were taken without chopping while scanning at 60/s. The Bolocam survey includes the entire regions surveyed by the published 8 mJy 850 m JCMT SCUBA (Scott et al., 2002) and 1.2 mm IRAM MAMBO (Greve et al., 2004) surveys. Using a model SED based on nearby, dusty, star-forming galaxies (see § 5) gives relative flux densities of 1 : 2.0 : 0.8 and relative RMSs of 1 : 0.9 : 0.61.4 for the Bolocam, SCUBA, and MAMBO surveys, respectively, for a galaxy redshift of (with the range given for MAMBO due to nonuniform noise).
2) JCMT SCUBA 8 mJy survey (Scott et al., 2002). The survey covers 122 arcmin2 (in the Lockman Hole) to an RMS of 2.5 mJy/beam with a 14 beam, and includes 36 source candidates ( 3 ). Five sources of the Scott et al. (2002) catalog (LE850.9, 10, 11, 15, 20) were retracted by Ivison et al. (2002) on the basis of large values (and lack of radio identifications). The SCUBA survey detects 6 of the 8 Bolocam detections in the overlap region between the surveys (Bolocam 5, 8, 13, 14, 16, and 17).
3) 1.2 mm IRAM MAMBO survey (Greve et al., 2004). The survey covers 197 arcmin2 (in the Lockman Hole) to an RMS of 0.6-1.5 mJy/beam, with a 10.7 beam. The survey includes 23 sources ( 3 ). The MAMBO survey detects 7 of the 11 Bolocam detections in the overlap region between the surveys (Bolocam 1, 4, 5, 8, 14, 16, and 17).
4) 350 m SHARC II observations of the Lockman Hole (this work – See § 2). The instrument beam is 9 and the observations were taken with a Lissajous scan pattern with uniform coverage regions of 95 18 to an RMS of 6-18 mJy/beam (with deeper integrations taken for fainter sources). A total of 14 sources were detected (3 by Kovács et al., 2005), 11 of which coincide with 9 Bolocam sources. (An additional 3 SHARC II sources were detected outside of the Bolocam positional error circles.)
To summarize, the majority of the Bolocam sources within the regions covered by other submillimeter surveys were detected (SCUBA detects 6 of 8 Bolocam detections, MAMBO detects 7 of 11, and SHARC II detects 9 of 17). Seven of the Bolocam source candidates were not detected by any other submillimeter survey (Bolocam 7, 9, 10, 11, 12, 13, and 15, each of which was detected at 3.5 ), which is consistent with the 6 false detections (Poisson distributed) expected from simulations. These results point to the robustness of the remaining Bolocam galaxy candidates.
A.2 Radio Detections
Three independent VLA radio surveys were used to identify counterparts to the Bolocam sources. In addition, this work re-analyzes the Ivison et al. (2002) data set to obtain a complete source catalog over the entire Bolocam source catalog. The radio surveys include:
Published Surveys:
1) VLA radio source list at 1.4 GHz of the SCUBA 8 mJy survey sources (Ivison et al., 2002). The Lockman East radio survey reached an average noise level of 4.8 Jy beam-1 with a 1.3 FWHM circular beam. Coincident sources (and upper limits) are given for each of the 21 brighter () SCUBA sources, with 20 positive detections over 14 of the sources. Five of the 21 SCUBA sources (LE850.9, 10, 11, 15, 20) are ignored on the basis of large values (and lack of radio identifications). Of the 8 Bolocam detections covered by this VLA survey, 5 (Bolocam 5, 8, 14, 16, 17) coincide with 7 Ivison et al. (2002) sources. Ivison et al. (2002) also report continuum data at 4.9 GHz (using the VLA in the C configuration), with a resulting noise level of 11 Jy beam-1. Positive detections exist for 8 of the SCUBA galaxies, 4 of which are coincident with Bolocam sources (Bolocam 5, 14, 16, 17).
2) A source list from the 6 cm VLA survey of the Lockman Hole (Ciliegi et al., 2003). The survey has a noise level of Jy and covers the northeast quadrant of the Bolocam survey, including 7 of the Bolocam sources. A total of 63 sources were detected at 4.5 , with a radio counterpart for only one of the Bolocam sources (Bolocam 8).
Unpublished Surveys:
3) A source list of 20 cm VLA observations was obtained from Yun et al. (2005). The observations were broken into four fields, with the northeastern section being deeper (10 Jy/beam RMS) than the other three fields (15 Jy/beam). The observations cover the entire Bolocam field, with a total of 640 sources . The source list contains counterparts for 10 of the Bolocam sources (Bolocam 1, 2, 3, 5, 6, 8, 9, 13, 14, 17).
4) Re-analysis of the VLA map from Ivison et al. (2002) by Biggs & Ivison (2006). The survey reached a median noise level in the locality of the 17 Bolocam sources of 4.4 Jy beam-1. Radio sources were extracted from the VLA map within 30 from the Bolocam source positions. Counterparts for 15 of the 17 Bolocam sources were detected (all except Bolocam sources 10 and 12). Seven of the detections are coincident with the Ivison et al. (2002) analysis (Bolocam 5, 8, 14, 16, and 17), with flux densities in good agreement (within the stated uncertainties).
In total, 15 of the 17 Bolocam galaxy candidates are found to have at least one radio counterpart (all except Bolocam 10 and 12). As only the VLA observations from Yun et al. (2005) and Ciliegi et al. (2003) include an entire source catalog, we are limited to estimating accidental detection rates for these two surveys. The accidental detection rate is defined as the Poisson likelihood that one or more of these known radio sources, randomly distributed, fall within the 2 positional confidence region of the Bolocam beam (see § 3). The rates for the Yun et al. (2005) and Ciliegi et al. (2003) surveys are 17-24% and 8-11%, respectively. (The accidental radio detection rate is dominated by the Yun et al. 2005 survey due to its greater relative depth.)
A.3 Infrared Detections
Both published and unpublished Spitzer observations were used to obtain infrared counterparts to the Bolocam / radio sources. They include:
1) Spitzer postage stamps and an extracted source list (this work) with the IRAC (3.6, 4.5, 5.8, and 8.0 m) and MIPS (24 m) instruments were obtained for 14 of the 17 Bolocam source candidates for areas within a 16 radius of the Bolocam beam centers. (Note that this radius is smaller than the 2 positional errors of Bolocam.) Bolocam.LE.1100.2, 6, and 12 fall outside of the region observed with Spitzer. Multiple Spitzer sources were detected within each of the 14 Bolocam positional error circles.
2) Spitzer observations of SCUBA/VLA selected sources (Egami et al., 2004) with IRAC (3.6, 4.5, 5.8, 8.0 m) and MIPS (24 m) in a 5’ x 5’ area of the Lockman Hole region. The MIPS 24 m field of view is 5.4’ x 5.4’. The total integration time was 300 seconds per pixel, with a 3 detection limit of 120 Jy. The observed region contains the following Spitzer, VLA radio, SCUBA, and Bolocam correlations:
-
•
The field imaged by IRAC and MIPS contains 10 SCUBA sources of the Scott et al. (2002) catalog (LE850.1, 4, 7, 8, 10, 14, 18, 23, 24, 35).
-
•
Ivison et al. (2002) detected radio counterparts for 5 (LE850.1, 7, 8, 14, 18) of the 7 secure ( 3.5 ) SCUBA sources at high significance and a radio counterpart for LE850.4 with lower significance.
-
•
Egami et al. (2004) finds an additional radio counterpart to LE850.4 upon re-examination of the VLA map.
-
•
Of these 7 SCUBA sources with a total of 9 radio components (LE850.1, 4, 7, 8a, 8b, 14a, 14b, 18, 35), all are found to have Spitzer counterparts.
-
•
Spitzer counterparts are found only for the sources with radio detections.
-
•
Four of the 9 Spitzer detections (LE850.1, 8a, 8b, 8c) fall within 2 of the Bolocam positional error circles (Bolocam.LE.1100.14 and 17).
A.4 Optical Detections
Optical counterparts to the Bolocam / radio sources were obtained from three deep surveys, including:
1) SDSS u, g, r, i, z photometry was obtained from the public SDSS data release 3 (DR3) website444http://cas.sdss.org/dr3/en/tools/search/rect.asp, including 7,148 objects in the Lockman Hole region. The 61 objects falling within the Bolocam positional error circles include 43 galaxies (extended) and 18 stars (point-like).
2) A list of objects with Johnson R-band (SUBARU) photometry was obtained from Yun et al. (2005) for each of the Yun et al. (2005) VLA 20 cm radio sources. The optical catalog consists of 1,031 objects down to a limiting magnitude of R = 24.5. 29 sources were found within the positional error circles of the 10 Bolocam sources covered by the catalog. As no radio sources were detected by Yun et al. (2005) for Bolocam sources 4, 7, 10, 11, 12, 15, and 16, no optical coverage was available for these sources.
3) Optical Johnson R-band (SUBARU) photometry was also obtained from Ivison et al. (2005) for most of the Lockman Hole region (with no coverage for Bolocam sources 6, 9, and 11). 50,297 sources were detected down to a limiting magnitude of R = 27. 950 sources lie within the positional error circles of the 14 Bolocam sources covered by the survey.
A.5 X-ray Detections
Finally, two X-ray surveys were used to identify Bolocam sources with a possible AGN contribution. The X-ray surveys include:
1) The ROSAT Ultra Deep Survey (Lehmann et al., 2001) source list of the Lockman Hole was cross referenced with the positions of the 17 Bolocam galaxy candidates. The survey reached a flux density level of 1.2 10-15 erg cm-2 s-1 in the 0.5-2.0 keV energy band, detecting 94 X-ray sources. Two of the sources coincide with the Bolocam positions, coincident with the eastern radio source of Bolocam 8 and in-between the two radio sources associated with Bolocam 17. Despite the positional offset, Lehmann et al. (2001) associate the X-ray emission coincident with Bolocam source 17 with the northwestern radio (and optical) source. An additional X-ray detection exists of SHARC II source 3 (in the field of Bolocam source 9), although the SHARC II and X-ray positions lie well outside the positional error circle of the Bolocam source.
2) XMM-Newton observations of the Lockman Hole ( 100 ksec) were taken during the Performance Verification phase of the instrument (Mainieri et al., 2002), yielding 98 sources with more than 70 net counts (flux density limit of 1.6 10-15 erg cm-2 s-1 in the 0.5-7 keV band). Cross referencing the source list with the 17 Bolocam sources yields a coincidence list identical to that of the ROSAT survey.
3) A deep, (1 Msec) unpublished (Ivison et al., 2005) XMM-Newton survey of the majority of the Bolocam good coverage region (Bolocam 2, 6, 11, and 12 are not covered) confirms the above results with only one identification, coincident with Bolocam source 17.
| Bolocam | Bolocam | SHARC II | SCUBA | MAMBO | Yun | Yun (deep) | Biggs | Ivison | Ivison | Ciliegi | Spitzer | Spitzer | Spitzer | Spitzer | Spitzer | SDSSaaThe two listed numbers correspond to the SDSS galaxy and star classifications, respectively. | YunbbThe Optical R band source list (Yun et al., 2005) includes only sources within 3 of the corresponding radio source. | Ivison | Notes |
|---|---|---|---|---|---|---|---|---|---|---|---|---|---|---|---|---|---|---|---|
| Number | 1.1 mm | 350 m | 850 m | 1.2 mm | 20 cm | 20 cm | 20 cm | 20 cm | 6 cm | 6 cm | 3.6 m | 4.5 m | 5.8 m | 8.0 m | 24 m | u,g,r,i,z | R | R | |
| mJy | mJy | mJy | mJy | Jy | Jy | Jy | Jy | Jy | Jy | mJy | mJy | mJy | mJy | mJy | |||||
| 1 | 6.81.4 | 38.09.3 | X | 5.71.0 | - | 6013 | 525.7 | X | X | - | 1(4) | 1(4) | -(-) | -(-) | 1(-) | -(1,1) | - | 1(48) | S radio source |
| ” | ” | ” | X | ” | - | - | 535.6 | X | X | - | 1 | 1 | - | 1 | - | - | X | - | N radio source |
| 2 | 6.51.4 | 20.95.2 | X | X | 37358 | X | 5079.0 | X | X | X | X | X | X | X | X | 1,0(0,1) | 1 | 1(74) | N radio source |
| ” | ” | ” | X | X | - | X | 909.7 | X | X | X | X | X | X | X | X | - | X | 1 | S radio source |
| 3 | 6.01.4 | 15.13.8 | XccSee source description in § 4.2 | - | 24139 | X | 2899.0 | X | X | X | 1(10) | 1(4) | 1(1) | 1(-) | 1(2) | 0,1(0,2)ccSee source description in § 4.2 | 2ddThe multiple Yun et al. (2005) R-band optical sources coincident with the radio source are close in both position ( 1) and flux ( 0.2 mag), and are likely due to a lack of merging close sources in the catalog. | 1(35) | NE SHARC II source |
| ” | ” | 14.03.5 | XccSee source description in § 4.2 | - | 8420 | X | 967.8 | X | X | X | 1 | 1 | - | - | 1 | - | - | 1 | SW SHARC II source |
| 4 | 5.21.4 | - | - | 3.20.7 | - | X | 206.7 | X | X | X | XccSee source description in § 4.2(14) | XccSee source description in § 4.2(13) | XccSee source description in § 4.2(1) | XccSee source description in § 4.2(1) | XccSee source description in § 4.2(3) | 1,0(3,2) | X | 1(41) | |
| 5 | 5.11.3 | 35.69.7 | 112.6 | 2.90.7ccSee source description in § 4.2 | X | 5113 | 519.3 | 5414 | 6035 | - | 1(10) | 1(6) | 1(1) | 1(-) | 1(2) | -(2,0) | 3ddThe multiple Yun et al. (2005) R-band optical sources coincident with the radio source are close in both position ( 1) and flux ( 0.2 mag), and are likely due to a lack of merging close sources in the catalog. | 1(47) | E radio source |
| ” | ” | - | - | ” | X | 5913 | 426.5 | X | X | - | 1 | 1 | 1 | 1 | 1 | 1,0 | 3 | 1 | S radio source |
| ” | ” | - | - | 3.10.7 | X | - | 275.9 | X | X | - | X | X | X | X | X | - | X | - | W radio source |
| ” | ” | - | - | - | X | - | 297.8 | X | X | - | X | X | X | X | X | - | X | - | N radio source |
| 6 | 5.01.5 | 27.66.9 | X | X | 6017 | X | 559.9 | X | X | X | X | X | X | X | X | 1,0(4,0) | - | X | E SHARC II, E radio source |
| ” | ” | ” | X | X | 10522 | X | 13811 | X | X | X | X | X | X | X | X | - | - | X | E SHARC II, W radio source |
| ” | ” | 63.615.8 | X | X | 61193 | X | 93916 | X | X | X | X | X | X | X | X | 1,0 | 1 | X | W SHARC II source |
| 7 | 4.91.5 | - | X | X | - | X | 5123 | X | X | X | -(6) | -(5) | -(1) | -(-) | -(2) | -(-) | X | -(71) | |
| 8 | 4.81.3 | 34.59.3 | 10.92.4 | 4.80.6 | X | - | 277.6 | 2911 | - | - | 1(13) | 1(13) | 1(-) | -(-) | 1(6) | -(2,1) | X | 1(83) | S radio source |
| ” | ” | ” | ” | ” | X | 4612 | 286.7 | 249 | - | - | 1 | 1 | - | 1 | 1 | - | -(2) | 1 | N radio source |
| ” | ” | ” | - | - | X | 13623 | 1578.0 | X | X | 5811 | X | X | X | X | X | 0,1 | 3 | 1 | E radio source |
| 9 | 4.81.5 | -ccSee source description in § 4.2 | X | X | 6018 | X | 6811 | X | X | X | 1(13) | 1(14) | 1(-) | 1(-) | 1(5) | -(1,0) | 2 | X | |
| 10 | 4.71.4 | - | - | - | - | X | - | X | X | X | -(6) | -(6) | -(3) | -(1) | -(1) | -(2,1) | X | -(60) | |
| 11 | 4.61.5 | - | X | X | - | X | 11633 | X | X | X | 1(6) | 1(4) | -(-) | -(-) | -(-) | 1,0(3,2) | X | X | |
| 12 | 4.61.4 | -ccSee source description in § 4.2 | X | X | - | X | - | X | X | X | X | X | X | X | X | -(3,0) | X | -(66)ccSee source description in § 4.2 | |
| 13 | 4.51.4 | - | -ccSee source description in § 4.2 | - | 6318 | X | 637.2 | X | X | X | -(7) | -(7) | -(1) | -(-) | -(2) | 1,0(3,0) | 3ddThe multiple Yun et al. (2005) R-band optical sources coincident with the radio source are close in both position ( 1) and flux ( 0.2 mag), and are likely due to a lack of merging close sources in the catalog. | 1(58) | NE radio source |
| ” | ” | - | - | - | - | X | 277.9 | X | X | X | 1 | 1 | 1 | - | 1 | 0,1 | X | 1 | E radio source |
| ” | ” | - | - | - | - | X | 307.6 | X | X | X | - | - | - | - | - | - | X | - | SE radio source |
| 14 | 4.41.3 | 24.16.0 | 10.51.6ccSee source description in § 4.2 | 3.40.6 | 7619 | 7815 | 737.3 | 7310 | 5637 | - | XccSee source description in § 4.2(7) | XccSee source description in § 4.2(3) | XccSee source description in § 4.2(-) | XccSee source description in § 4.2(-) | XccSee source description in § 4.2(1) | -(1,1) | - | 1(83) | S radio source |
| ” | ” | - | - | - | - | X | 347.2 | X | X | - | 1 | 1 | 1 | 1 | 1 | - | X | 1 | W radio source |
| ” | ” | - | - | - | - | 4512 | 268.4 | X | X | - | XccSee source description in § 4.2 | XccSee source description in § 4.2 | XccSee source description in § 4.2 | XccSee source description in § 4.2 | XccSee source description in § 4.2 | - | 1 | 1 | NE radio source |
| ” | ” | - | - | - | - | - | 268.3 | X | X | - | - | - | - | - | - | 1,0 | X | 1 | SW radio source |
| 15 | 4.41.4 | - | X | - | - | X | 507.7 | X | X | - | 1(13) | 1(12) | 1(3) | 1(2) | 1(2) | 1,0(5,0) | X | 1(60) | |
| 16 | 4.11.4 | 44.09.0 | 6.11.8 | 2.80.5 | X | - | 498.5 | 4112 | 3222 | - | 1(9) | 1(7) | 1(-) | 1(-) | 1(-) | -(1,1) | X | 1(112) | |
| 17 | 4.01.3 | 15.53.9 | 5.11.3 | 2.40.6 | - | - | 206.6 | 2211 | - | - | 1(4) | 1(5) | 1(1) | 1(0) | 1(2) | 0,1(3,2) | 1 | 1(91) | NW radio source |
| ” | ” | ” | ” | ” | - | 5413 | 589.4 | 5812 | 5732 | - | 1 | 1 | 1 | 1 | 1 | - | 3(4) | 1 | SE radio source |
Note. — An (X) corresponds to Bolocam sources not covered by the survey / source list. Items in parentheses correspond to the detection of sources within the Bolocam positional error circle, but not likely associated with the source.
Appendix B Previous Redshift Estimates of Bolocam Galaxies
Several of the Bolocam galaxies with radio counterparts have had their redshifts determined with either photometric or spectroscopic techniques. We briefly discuss the results of each of these redshift surveys in this section. The spectroscopic redshifts will form the basis of comparison to the photometric redshift techniques discussed in § 5. The previous photometric redshifts also prove useful in considering the merits of including 350 m SHARC II observations when estimating redshifts of submillimeter galaxies.
1) Chapman et al. (2005) obtained spectroscopic redshifts for a sample of 73 submillimeter galaxies, the largest set of spectroscopic redshifts to date. The sources are a subset of 150 SCUBA/JCMT sources detected at 850 m over seven separate fields. Requiring accurate positions for spectroscopic identification, 104 of the SCUBA galaxies have radio identifications from deep VLA radio maps at 1.4 GHz. Of these, a subset of 98 sources were observed with the Low Resolution Imaging Spectrograph (LRIS) on the Keck I telescope, resulting in the spectroscopic identification of 73 of these galaxies. Twelve of the sources correspond to the SCUBA sources in the Lockman Hole, 5 of which a coincident with Bolocam galaxy candidates (Bolocam 5, 8, 14, 16 and 17). Chapman et al. (2005) find redshifts of 2.611, 3.036, 2.148, 2.142, 0.686 for the five Bolocam galaxies, respectively. While spectra for each of the Bolocam galaxies are not included among the sample spectra, Chapman et al. (2005) comment that all of the above detections have multiple-line identifications and can therefore be considered robust. The subset of Chapman et al. (2005) redshifts with Bolocam detections () is consistent with the overall redshift distribution of the entire sample (with a median redshift of 2.2).
2) Aretxaga et al. (2003) implement a Monte Carlo photometric redshift technique, using existing far-IR - radio multiwavelength data for 77 sources first identified at 850 m (SCUBA) or 1.2 mm (MAMBO). The technique produces the redshift probability distribution for an individual galaxy by choosing an evolutionary model and generating a catalog of luminosities and redshifts based on template SEDs from local starbursts, ULIRGs, and AGN. Thirteen of the sources correspond to SCUBA sources in the Lockman Hole, including 5 Bolocam galaxies (Bolocam 5, 8, 14, 16 and 17 – the same subset with Chapman et al. 2005 spectroscopic redshifts). Five different evolutionary models were used, with the results listed in Table 4. Given the stated uncertainties in the photometric redshifts, the Aretxaga et al. (2003) results are in general agreement with the spectroscopic measurements. Note that the photometric redshift for Bolocam source 17 is consistent with both the modified blackbody and near IR stellar bump models (see § 5.4), further supporting a possible misidentification by Chapman et al. (2005).
| Bolocam | Chapman | Aretxaga | Lehmann | Oyabu | Egami |
|---|---|---|---|---|---|
| Number | et al. (2005) | et al. (2003) | et al. (2001) | et al. (2005) | et al. (2004) |
| 5 | 2.611(NE) | 2.7(NE) | |||
| 6 | 0.362(W) | ||||
| 8 | 3.036(S) | 5.8 | 1.110(E) | ||
| 14 | 2.148(S) | 2.6(S) | 2.6(S) | ||
| 16 | 2.142 | 3.3 | |||
| 17 | 0.689(SE) | 3.7 | 0.974(NW) | 3(SE), 0.9 |
3) The ROSAT Ultra Deep Survey (Lehmann et al., 2001) of the Lockman Hole reached a flux density level of 1.2 10-15 erg cm-2 s-1 in the 0.5-2.0 keV energy band detecting 94 X-ray sources. Spectroscopic identifications of 90% of the sources based on highly accurate positions (2 FWHM) with the High Resolution Imager (HRI) and Keck R-band images were performed with the LRIS spectrometer on the Keck telescopes, yielding a single spectroscopic redshift for the northwest optical component of Bolocam source 17. Multiple lines were detected (Mg II, [Ne V], and [O II]) giving a redshift of 0.974 (cf. § 5.4).
4) Oyabu et al. (2005) spectroscopically identified 29 of the 44 far-infrared sources (with accurate 1.4 GHz VLA radio positions) detected in the 0.9 deg2 ISO survey of the Lockman Hole. Optical identifications of the radio sources were performed in both the I- and R-bands (using the University of Hawaii 88 and Subaru telescopes), with optical spectroscopy performed with both the Keck II and WIYN telescopes. Five of the ISO sources fall in the region covered by Bolocam, with 2 sources coinciding with Bolocam sources (6 and 8). Oyabu et al. (2005) find a redshift of 0.362 for the most westerly radio source of Bolocam 6 and a redshift of 1.110 for eastern radio source of Bolocam 8.
5) With Spitzer IRAC and MIPS, Egami et al. (2004) positively detect all 9 of the radio sources associated with 7 SCUBA galaxies, including 4 detections of two Bolocam sources (14 and 17). The photometric redshifts using only the near- and mid-infrared points are 2.6 for Bolocam 14, and 3 and 0.9 for the two radio sources near Bolocam 17.
References
- Alexander et al. (2005) Alexander, D. M., Bauer, F. E., Chapman, S. C., Smail, I., Blain, A. W., Brandt, W. N., & Ivison, R. J. 2005, ApJ, 632, 736
- Aretxaga et al. (2003) Aretxaga, I., Hughes, D. H., Chapin, E. L., Gaztanaga, E., Dunlop, J. S., & Ivison, R. J. 2003, MNRAS, 342, 759
- Biggs & Ivison (2006) Biggs, A. D., Ivison, R. J. 2006, in prep
- Blain et al. (1999) Blain, A. W., Kneib, J.-P., Ivison, R. J., & Smail, I. 1999, ApJ, 512, L87
- Blain et al. (2002) Blain, A., Smail, I., Ivison, R. J., Kneib, J.-P., & Frayer, D. T. 2002, Phys. Rept.369, 111
- Carilli & Yun (1999) Carilli, C. L., & Yun, M. S. 1999, ApJ, 513, L13
- Chabrier (2003) Chabrier, G. 2003, PASP, 115, 763
- Chapman et al. (2005) Chapman, S. C., Blain, A. W., Smail, I., & Ivison, R. J. 2005, ApJ, 622, 772
- Ciliegi et al. (2003) Ciliegi, P., Zamorani, G., Hasinger, G., Lehmann, I., Szokoly, G., & Wilson, G. 2003, A&A, 398, 901
- Dale & Helou (2002) Dale, D., & Helou, G. 2002, ApJ, 576, 159
- Devlin et al. (2001) Devlin, M., et al. 2001, in Lowenthal, J., Hughes, D. H., eds, Deep Millimetre Surveys: Implications for Galaxy Formation and Evolution. World Scientific, p. 59
- Demircan & Kahraman (1991) Demircan, O., & Kahraman, G. 1991, Ap&SS, 181, 313
- Dwek et al. (1998) Dwek, E., Arendt, R. G., Hauser, M. G., Fixen, D., Kelsall, T., Leisawitz, D., Pei, Y. C., Wright, E. L., Mather, J. C., Moseley, S. H., Odegard, N., Shafer, R., Silverberg, R. F., Weiland, J. L. 1998, ApJ, 508, 106
- Efstathiou, Rowan-Robinson, & Siebenmorgen (2000) Efstathiou, A., Rowan-Robinson, M., & Siebenmorgen, R. 2000, MNRAS, 313, 734
- Egami et al. (2004) Egami, E., Dole, H., Huang, J.-S., Perez-Gonzalez, P., Floc’h, E. Le, Papovich, C., Barmby, P., Ivison, R. J., Serjeant, S., Mortier, A., Frayer, D. T., Rigopoulou, D., Lagache, G., Rieke, G. H., Willner, S. P., Alonso-Herrero, A., Bai L., Engelbracht, C. W., Fazio, G. G., Gordon, K. D., Hines, D. C., Misselt, K. A., Miyazaki, S., Morrison, J. E., Rieke, M. J., Rigby, J. R., & Wilson, G. 2004, ApJ, 154, 130
- Fontana et al. (2004) Fontana, A., Pozzetti, L., Donnarumma, I., Renzini, A., Cimatti, A., Zamorani, G., Menci, N., Daddi, E., Giallongo, E., Mignoli, M., Perna, C., Salimbeni, S., Saracco, P., Broadhurst, T., Cristiani, S., D’Odorico, S., & Gilmozzi, R. 2004, A&A, 424, 23
- Genzel et al. (2004) Genzel, R., Baker, A. J., Ivison, R. J., Bertoldi, F., Blain, A. W., Chapman, S. C., Cox, P., Davies, R. I., Eisenhauer, F., Frayer, D. T., Greve, T., Lehnert, M. D., Lutz, D., Nesvadba, N., Neri, R., Omont, A., Seitz, S., Smail, I., Tacconi, L. J., Tecza, M., Thatte, N. A., & Bender, R. 2004, preprint (astro-ph/0403183)
- Genzel et al. (2000) Genzel, R., Lutz, D., Moorwood, A. F. M., Rigopoulou, D., Spoon, H. W. W., Sternberg, A., Sturm, E., & Tran, D. 2000, LNP, 548, 199
- Greve et al. (2004) Greve, T. R., Ivison, R. J., Bertoldi, F., Stevens, J. A., Dunlop, J. S., Lutz, D., & Carilli, C. L. 2004, MNRAS, 354, 779
- Griffin, Swinyard & Vigroux (2001) Griffin, M. J., Swinyard, B. M., & Vigroux, L. 2001, phso conf, 37
- Ivison et al. (2002) Ivison, R. J., Greve, T. R., Smail, I., Dunlop, J. S., Roche, N. D., Scott, S. E., Page, M. J., Stevens, J. A., Almaini, O., Blain, A. W., Wilcott, C. J., Fox, M. J., Gilbank, D. G., Serjeant, S., & Hughes, D. H. 2002, MNRAS, 337, 1
- Ivison et al. (2005) Ivison, R. J., et al., 2005, private communication
- Khan et al. (2005) Khan, S. A., Shafer, R. A., Benford, D. J., Staguhn, J. G., Chanial, P., Le Floc’h, E., Babbedge, T. S. R., Farrah, D., Moseley, S. H., Dwek, E., Clements, D. L., Sumner, T. J., Ashby, M. L. N., Brand, K., Brodwin, M., Eisenhardt, P. R., Elston, R., Gonzalez, A. H., Mckenzie, E., & Murray, S. S., 2004, preprint (astro-ph/0508405)
- Klaas et al. (2001) Klaas, U., Haas, M, Muller, S. A. H., Chini, R., Schulz, B., Coulson, I., Hippelein, H., Wilke, K., Albrecht, M., & Lemke, D. 2001, A&A, 379, 823
- Kovács et al. (2005) Kovács, A., et al., 2005, ApJ, in prep.
- Laurent et al. (2005) Laurent, G. T., Aguirre, J. E., Glenn, J., Ade, P. A. R., Bock, J. J., Edgington, S. F., Goldin, A., Golwala, S. R., Haig, D., Lange, A. E., Maloney, P. R., Mauskopf, P. D., Nguyen, H., Rossinot, P., Sayers, J., & Stover, P. 2005, ApJ, 623, 742
- Lehmann et al. (2001) Lehmann, I., Hasinger, G., Schmidt, M., Giacconi, R., Trumper, J., Zamorani, G., Gunn, J. E., Pozzetti, L., Schneider, D. P., Stanke, T., Szokoly, G., Thompson, D., & Wilson, G. 2001, A&A, 371, 833
- Lilly et al. (1999) Lilly, S. J., Eales, S. A., Gear, W. K. P., Hammer, F., Le Fevre, O., Crampton, D., Bond, J. R., & Loretta, D. 1999, ApJ, 518, 641
- Lutz et al. (2001) Lutz, D., Dunlop, J. S., Almaini, O., Andreani, P., Blain, A., Efstathiou, A., Fox, M., Genzel, R., Hasinger, G., Hughes, D., Ivison, R. J., Lawrence, A., Mann, R. G., Oliver, S., Peacock, J. A., Rigopoulou, D., Rowan-Robinson, M., Scott, S., Sergeant, S., & Tacconi, L. 2001, A&A, 378, 70
- Mainieri et al. (2002) Mainieri, V., Bergeron, J., Hasinger, G., Lehmann, I., Rosati, P., Schmidt, M., Szokoly, G., & Della Ceca, R. 2002, A&A, 393, 425
- Neri et al. (2003) Neri, R., Genzel, R., Ivison, R. J., Bertoldi, F., Blain, A. W., Chapman, S. C., Cox, P., Greve, T. R., Omont, A., & Frayer, D. T. 2003 ApJ, 597, L113
- Ossenkopf & Henning (1994) Ossenkopf, V., & Henning, T. 1994, A&A, 291, 943
- Oyabu et al. (2005) Oyabu, S., Yun, M. S., Murayama, T., Sanders, D. B., Kawara, K., Taniguchi, Y., Veilleux, S., Okuda, H., Matsuhara, H., Cowie, L. L., Sato, Y., Wakamatsu, K., & Sofue, Y. 2005, preprint (astro-ph/0507240)
- Sawicki (2002) Sawicki, M. 2002, AJ, 124, 3050
- Scott et al. (2002) Scott, S. E., Fox, M. J., Dunlop, J. S., Serjeant, S., Peacock, J. A., Ivison, R. J., Oliver, S., Mann, R. G., Lawrence, A., Efstathiou, A., Rowan-Robinson, M., Hughes, D. H., Archibald, E. N., Blain, A., & Longair, M. 2002, MNRAS, 331, 817
- Silva et al. (1998) Silva, L., Granato, G. L., Bressan, A., & Danese, L. 1998, ApJ, 509, 103
- Smail et al. (2002) Smail, I., Ivison, R. J., Blain, A. W., & Kneib, J.-P. 2002, MNRAS, 331, 495
- Wiklind (2003) Wiklind, T. 2003, ApJ, 588, 736
- Yun et al. (2005) Yun, M. S., et al., 2005, in prep
- Yun & Carilli (2002) Yun, M. S., & Carilli, C. L. 2002, ApJ, 568, 88
- Yun, Reddy, & Condon (2001) Yun, M. S., Reddy, N. A., & Condon, J. J. 2001, ApJ, 554, 803