First detection of a VHE gamma-ray spectral maximum from a Cosmic source: H.E.S.S. discovery of the Vela X nebula.
The Vela supernova remnant (SNR) is a complex region containing a number of sources of non-thermal radiation. The inner section of this SNR, within 2 degrees of the pulsar PSR B0833$-$45, has been observed by the H.E.S.S. -ray atmospheric Cherenkov detector in 2004 and 2005. A strong signal is seen from an extended region to the south of the pulsar, within an integration region of radius around the position (, J2000.0). The excess coincides with a region of hard X-ray emission seen by the ROSAT and ASCA satellites. The observed energy spectrum of the source between 550 GeV and 65 TeV is well fit by a power law function with photon index and an exponential cutoff at an energy of TeV. The integral flux above 1 TeV is . This result is the first clear measurement of a peak in the spectral energy distribution from a VHE -ray source, likely related to inverse Compton emission. A fit of an Inverse Compton model to the H.E.S.S. spectral energy distribution gives a total energy in non-thermal electrons of erg between 5 TeV and 100 TeV, assuming a distance of 290 parsec to the pulsar. The best fit electron power law index is , with a spectral break at 67 TeV.
Key Words.:
ISM: plerions, Gamma rays: observations1 Introduction
The region surrounding the Vela supernova remnant (SNR) is very well studied across the electromagnetic spectrum and contains a number of complex objects, including the SNR RX J0852.0$-$4622, which has been previously detected in the very high energy -ray (VHE) range (Katagiri et al., 2005; Aharonian et al., 2005b). The Vela SNR itself, at a distance estimated to be 290 pc (Dodson et al., 2003; Caraveo et al., 2001), extends over a diameter of . It is the nearest SNR to contain a young active pulsar, PSR B0833$-$45, with a period of 89 ms and a period derivative Ṗ of . This implies a spin-down luminosity of and age of 11,000 years. Observations by Chandra (Helfand et al., 2001) clearly show the torus-like morphology of the compact X-ray nebula surrounding the pulsar and have allowed its rotation axis to be inferred. The plane of the torus (i.e. pulsar equator) appears to intersect the plane of the sky at a position angle of relative to North (Ng & Romani, 2004), and its X-ray spectral index of 1.5 (Mangano et al., 2005) is typical of pre-cooled pulsar wind torii.
The SNR also contains a number of regions of non-thermal emission, including those labelled by Rishbeth (1958) from radio observations as Vela X, Vela Y and Vela Z (which is part of the shell of RX J0852.0$-$4622). A diffuse emission feature has been detected by ROSAT (Markwardt & Ögelman, 1995) in hard X-rays (– keV), coinciding with the centre of the Vela X region. It was first suggested that this feature, which is aligned closely with a filament detected at radio wavelengths, corresponds to the outflow jet from the pole of the pulsar (Frail et al., 1997). However, the Chandra observations showed that this feature lies along the extension of the pulsar equator, although bending to the southwest.
The study of Vela X is important from two perspectives: It was the first middle-aged pulsar wind nebula (PWN) to be detected, thereby introducing the concept of PWN evolution (Weiler & Panagia, 1980). Also, it served as the first prototype for offset PWN as a result of SNR expansion into an inhomogeneous medium (Blondin et al., 2001), of which G18.0-0.7 served as a second example (Gaensler et al., 2003). This second PWN was also recently identified with VHE source HESS J1825–137 (Aharonian et al., 2005c).
Here we discuss observations of the Vela pulsar and the centre of the Vela SNR with H.E.S.S., including the Vela X feature. A region of extended -ray emission is detected, to the south of the pulsar position (previously reported by Khélifi et al. (2005). This region was previously observed by the CANGAROO collaboration (Yoshikoshi et al., 1997) and emission of VHE -rays was claimed from a source to the southeast of the pulsar. However doubt was later cast on the significance of this detection (Dazeley et al., 2001). A recent paper from the CANGAROO collaboration (Enomoto et al., 2005) retracts the claimed detection, and suggests some evidence for an excess coincident with the H.E.S.S. signal.
2 Observations with H.E.S.S.
H.E.S.S. is a system of four atmospheric Cherenkov telescopes designed to look for astrophysical -ray emission above 100 GeV; a review of the detector is given by Hinton (2004). The Vela region was observed between January and March 2004 with the complete H.E.S.S. array. In total 10.3 hours of data were obtained, after standard data quality selection, at zenith angles between 20∘ and 40∘. These observations were taken using a method (wobble mode) whereby the source is offset by a small angular distance from the centre of the field of view, alternating between 28 minute runs in the positive and negative declination (or right ascension) directions. The observations were made at offsets of 0.5∘ in declination from the position of the Vela pulsar, (, J2000.0), which is referred to as position I for the purposes of this paper.
Following a detection of extended -ray emission to the south of the pulsar in the 2004 dataset, further observations were made in 2005 surrounding the position , (J2000.0), here referred to as position II, which was measured as the centre of gravity of the excess. These were also taken in wobble mode, and the mean offset for the 2005 data is 0.5∘. After data quality selection 7.2 hours of observations were available for analysis, giving total observation live time over the two years of 16.4 hours, after dead time correction (approximately 10%). The mean zenith angle for the complete set of observations is .
3 Analysis
The observations of the Vela region were calibrated using standard H.E.S.S. calibration procedures, as discussed by Aharonian et al. (2004) and analysed using the scaled width method, as discussed by Aharonian et al. (2005a). The hard cuts, as defined in the latter paper were applied to this source. These cuts improve the angular resolution and reduce systematic effects due to uncertainties in the background estimation, relative to the standard cuts, albeit at the expense of a higher than usual energy threshold (450 GeV for the analysis presented here).
The background level in this analysis was estimated using the on-off method, based on a sample of runs taken at similar zenith angles (external to the Vela SNR) which contain no excess -ray signal. This method allows the background level to be estimated in cases where the integration region for the source is comparable to the size of the field of view. The off runs are carefully chosen to match well the on source observations in zenith angle and system configuration.
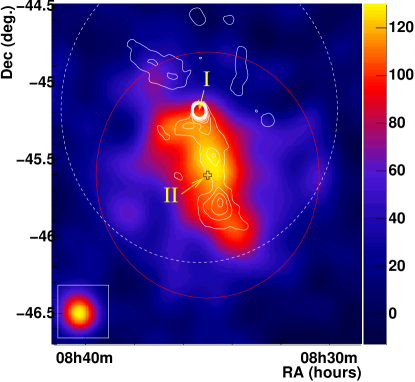
Figure 1 shows a sky map of the excess in the region south of the Vela pulsar. The map has been smoothed with a Gaussian function with a sigma of and is not corrected for variations in the -ray radial acceptance of the detector, which are less than 10% across the integration region. Position II, as defined above, is marked by a black cross. The extent and position of the excess has been determined by fitting a two dimensional, elongated Gaussian, convolved with the point spread function of the instrument for these measurements, which is 0.08∘ (68% containment radius), to an uncorrelated excess map of the source. The best fit intrinsic width along the major axis is , while the best fit intrinsic width along the minor axis is . The major axis of the fitted distribution is at a position angle of . The best-fit centre of gravity of the emission region (, J2000.0) is consistent with position II, within the statistical error of 2 arcminutes. The VHE source is thus identified as HESS J0835–455.
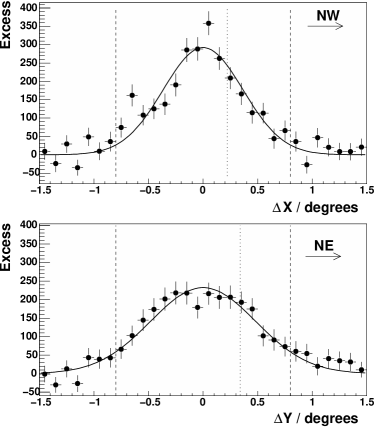
Profiles of the excess parallel to, and perpendicular to, the major axis of the fit are shown in Figure 2. Profiles of the elongated Gaussian fit are shown for comparison. It can be seen that, given the statistical errors in each bin, the elongated Gaussian fits the excess well, with a of 277.8 for 250 degrees of freedom. A circular Gaussian fit to the same excess gives a width of , with a /dof of 290.0/252.
The radius of the integration region used for estimating the flux and spectrum of the VHE emission was , surrounding position II, as defined above. This size was chosen so as to encompass the entire excess, as seen in Figure 1. A total of 9610 on-source counts and 7879 off-source counts were detected above 450 GeV, with a normalisation factor of 0.94 between the on and off observations, giving an excess of 2152 events within the integration region. The statistical excess significance is , calculated using the method described by Li & Ma (1983).
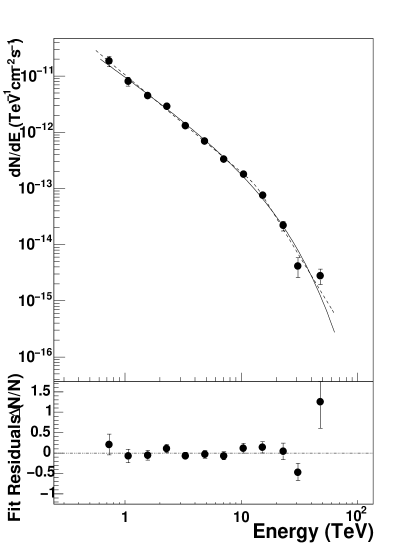
Figure 3 shows the energy spectrum of the signal seen from the integration region. The spectrum is well fit (with a /dof of 13.1/10) by a power law function with photon index and an exponential cutoff at an energy of TeV. The data may alternatively be described using a broken power law function, with a spectral break at TeV and photon index of at lower energies hardening to above the break energy. The /dof of the broken power law fit, which includes a term for the width of the transition region, is 9.0/8. A straight power law fit (/dof of 74.1/11) is rejected. The integral flux above 1 TeV (from the exponential cutoff fit) is . The systematic error on the flux estimation is estimated at 30%, mainly due to uncertainties in the transparency of the atmosphere to Cherenkov light. In fitting the energy spectrum for this source, the energy of each event is corrected for the detector optical efficiency, relative to that used in Monte Carlo simulations to estimate the effective area of the instrument. The optical efficiency is estimated from single muon events detected during each observation run (Leroy et al., 2003; Bolz, 2004). The mean energy correction is .
In order to test for a point source component in VHE -rays from position I (the pulsar position, as marked in Figure 2), the residual excess within 0.1∘ from the pulsar, after subtraction of the Gaussian fit to the extended excess, has been measured. No significant excess after subtraction is seen, and a upper limit on the integral flux above 1 TeV, assuming a point source at the position of the pulsar, is .
4 Discussion
The new VHE source reported here, HESS J0835–455, is situated to the south of the pulsar and the compact X-ray nebula (as seen by Chandra). The integral flux is estimated to be 50 of that of the Crab nebula above 1 TeV. As the distance to the pulsar is well measured, one can estimate the size of the emission region seen by H.E.S.S. to be 5.1 parsec (full length for 68% containment) along the major axis by 3.8 parsec (full width). The luminosity of the emission region in the energy range from 550 GeV to 65 TeV can be estimated to be , using the power law fit to the spectrum with the exponential cutoff.
HESS J0835–455 appears to be spatially coincident with the X-ray (– keV) emission as seen by ROSAT (shown in Figure 1). It has been suggested (Blondin et al., 2001) that the Vela X feature corresponds to the pulsar wind nebula, displaced to the south by the unequal pressure of the reverse shock from the SNR. This hypothesis is consistent with the H.E.S.S. observations which demonstrate conclusively for the first time that this feature emits non-thermal radiation. A similar explanation has been proposed for the emission seen by H.E.S.S. (HESS J1825–137) close to the pulsar wind nebula G18.0–0.7 (Aharonian et al., 2005c).
The size of the feature described by Markwardt & Ögelman (1995) has been measured as 45 12 arcmin2, whereas the VHE intrinsic size is 58 43 arcmin2. An extension of the X-ray feature to the southwest was suggested by Lu & Aschenbach (2000), however this may be unrelated thermal emission, a suggestion which is supported by the fact that no excess is seen in this region by H.E.S.S.

The larger VHE size probably indicates that synchrotron cooling in the X-ray domain was (or still is) important. This is confirmed by the detection of a cooled X-ray photon index of 2.1 (Markwardt & Ögelman, 1997) in the emission region, which is consistent with the uncooled photon index of 1.5 closer to the source. Figure 4 shows a spectral energy distribution (SED) for Vela X, including the H.E.S.S. result reported here. Two possible X-ray spectra are shown, the lower including only the ’Cocoon’ feature defined in the above paper, while the upper flux includes the emission from the ’SNR’ component extrapolated over the H.E.S.S. integration region.
A simple one-zone model of inverse Compton emission from interactions with the cosmic microwave background (CMBR) is also shown. The H.E.S.S. observations show the expected peak in the IC emission; this result is the first clear measurement of such a peak at VHE energies. The total energy content in non-thermal electrons between 5 TeV and 100 TeV is erg, for a distance of 290 parsec. The best fit electron power law index is , with a break at 67 TeV and a post-break index of 9. The /dof of this fit is 10.2/9. In Figure 4 three possible synchrotron spectral energy distributions are shown, for magnetic field levels in the emission region from G to G. The synchrotron distributions are not constrained by the X-ray data, a combined fit on the X-ray and -ray data would more closely reproduce the measured X-ray spectral slope. A magnetic field of this magnitude may be expected in the scenario of a nebula displaced from the pulsar by an asymmetric shock.
This result demonstrates the usefulness of H.E.S.S. observations in clarifying the complex morphology of this source. VHE observations of inverse Compton scattering of the CMBR allow direct inference of the spatial and spectral distribution of non-thermal electrons in a PWN, independent of contamination by thermal emission or variations in the local magnetic field.
Acknowledgements.
The support of the Namibian authorities and of the University of Namibia in facilitating the construction and operation of H.E.S.S. is gratefully acknowledged, as is the support by the German Ministry for Education and Research (BMBF), the Max Planck Society, the French Ministry for Research, the CNRS-IN2P3 and the Astroparticle Interdisciplinary Programme of the CNRS, the U.K. Particle Physics and Astronomy Research Council (PPARC), the IPNP of the Charles University, the South African Department of Science and Technology and National Research Foundation, and by the University of Namibia. We appreciate the excellent work of the technical support staff in Berlin, Durham, Hamburg, Heidelberg, Palaiseau, Paris, Saclay, and in Namibia in the construction and operation of the equipment. We have made use of the ROSAT Data Archive of the Max-Planck-Institut für Extraterrestrische Physik (MPE) at Garching, Germany.References
- Aharonian et al. (2004) Aharonian, F. A. et al. (H.E.S.S. Collaboration) 2004, Astroparticle Physics, 22, 109
- Aharonian et al. (2005a) Aharonian, F. A. et al. (H.E.S.S. Collaboration) 2005a, A&A, 430, 865
- Aharonian et al. (2005b) Aharonian, F. A. et al. (H.E.S.S. Collaboration) 2005b, A&A, 437, L7
- Aharonian et al. (2005c) Aharonian, F. A. et al. (H.E.S.S. Collaboration) 2005c, A&A, 442, L25
- Blondin et al. (2001) Blondin, J. M., Chevalier, R. A., & Frierson, D. M. 2001, ApJ, 563, 806
- Bolz (2004) Bolz, O. 2004, PhD thesis, Karl-Ruprecht University Heidelberg (http://www.ub.uni-heidelberg.de/archiv/4812)
- Caraveo et al. (2001) Caraveo, P. A., De Luca, A., Mignani, R. P., & Bignami, G. F. 2001, ApJ, 561, 930
- Dazeley et al. (2001) Dazeley, S. A., Patterson, J. R., Rowell, G. P., & Edwards, P. G. 2001, Astroparticle Physics, 15, 313
- Dodson et al. (2003) Dodson, R., Legge, D., Reynolds, J. E., & McCulloch, P. M. 2003, ApJ, 596, 1137
- Enomoto et al. (2005) Enomoto, R., Tsuchiya, K., Adachi, Y., et al. 2006, ApJ, 683
- Frail et al. (1997) Frail, D. A., Bietenholz, M. F., Markwardt, C. B., & Ögelman, H. 1997, ApJ, 475, 224
- Gaensler et al. (2003) Gaensler, B. M., Schulz, N. S., Kaspi, V. M., Pivovaroff, M. J., & Becker, W. E. 2003, ApJ, 588, 441
- Helfand et al. (2001) Helfand, D. J., Gotthelf, E. V., & Halpern, J. P. 2001, ApJ, 556, 380
- Hinton (2004) Hinton, J. A. 2004, New Astronomy Review, 48, 331
- Katagiri et al. (2005) Katagiri, H., Enomoto, R., Ksenofontov, L. T., et al. 2005, ApJ, 619, L163
- Khélifi et al. (2005) Khélifi, B. et al. 2005, in Proceedings of the 29th International Cosmic Ray Conference (Pune), Vol. 1, 101
- Leroy et al. (2003) Leroy, N. et al. 2003, in Proceedings of the 28th International Cosmic Ray Conference (Tsukuba), Vol. 1, 2895 (ArXiv: astro-ph/0307452)
- Li & Ma (1983) Li, T.-P. & Ma, Y.-Q. 1983, ApJ, 272, 317
- Lu & Aschenbach (2000) Lu, F. J. & Aschenbach, B. 2000, A&A, 362, 1083
- Mangano et al. (2005) Mangano, V., Massaro, E., Bocchino, F., Mineo, T., & Cusumano, G. 2005, A&A, 436, 917
- Markwardt & Ögelman (1995) Markwardt, C. B. & Ögelman, H. 1995, Nature, 375, 40
- Markwardt & Ögelman (1997) Markwardt, C. B. & Ögelman, H. B. 1997, ApJ, 480, L13
- Ng & Romani (2004) Ng, C.-Y. & Romani, R. W. 2004, ApJ, 601, 479
- Rishbeth (1958) Rishbeth, H. 1958, Australian Journal of Physics, 11, 550
- Weiler & Panagia (1980) Weiler, K. W. & Panagia, N. 1980, A&A, 90, 269
- Yoshikoshi et al. (1997) Yoshikoshi, T., Kifune, T., Dazeley, S. A., et al. 1997, ApJ, 487, L65