Color, Structure, and Star Formation History of Dwarf Galaxies over the last Gyr with GEMS and SDSS
Abstract
We present a study of the colors, structural properties, and star formation histories for a sample of dwarfs over look-back times of Gyr (). The sample consists of 401 distant dwarfs drawn from the Galaxy Evolution from Morphologies and SEDs (GEMS) survey, which provides high resolution Hubble Space Telescope (HST) Advanced Camera for Surveys (ACS) images and accurate redshifts, and of 1291 dwarfs at 10–90 Mpc compiled from the Sloan Digitized Sky Survey (SDSS). The sample is complete down to an effective surface brightness of 22 mag arcsec-2 in and includes dwarfs with to mag. Rest-frame luminosities in Johnson and SDSS filters are provided by the COMBO-17 survey and structural parameters have been determined by Sérsic fits. We find that the GEMS dwarfs are bluer than the SDSS dwarfs by mag in , which is consistent with the color evolution over Gyr of star formation histories involving moderate starbursts and long periods of continuous star formation. The full color range of the samples cannot be reproduced by single starbursts of different masses or long periods of continuous star formation alone. Furthermore, an estimate of the mechanical luminosities needed for the gas in the GEMS dwarfs to be completely removed from the galaxies shows that a significant number of low luminosity dwarfs are susceptible to such a complete gas loss, if they would experience a starburst. On the other hand, a large fraction of more luminous dwarfs is likely to retain their gas. We also estimate the star formation rates per unit area for the GEMS dwarfs and find good agreement with the values for local dwarfs.
1 Introduction
Until recently the study of dwarf galaxies has been primarily concentrated either on clusters, where a large number of dwarfs can be observed within a relatively small area of sky (e.g., Binggeli & Cameron, 1991; Trentham, 1998; Drinkwater, Gregg, Holman, & Brown, 2001), or on the Local Group, where dwarfs can be studied in great detail due to their proximity (for recent reviews see Mateo, 1998; van den Bergh, 2000; Grebel, 2000). Dwarfs outside of these regimes are numerous, but widespread. Many of them are associated with giant galaxies, forming galaxy groups (Karachentsev, 2005), which to some extent have been studied photometrically (Bremnes, Binggeli, & Prugniel, 1998, 1999, 2000; Jerjen, Binggeli, & Freeman, 2000) and kinematically (Bottinelli, Gouguenheim, Fouque, & Paturel, 1990; Karachentsev, Makarov, & Huchtmeier, 1999). Studies of dwarfs between clusters and groups are rather rare and are mainly composed of small samples, which have been selected more or less randomly (Makarova, 1999; Barazza, Binggeli, & Prugniel, 2001; Parodi, Barazza, & Binggeli, 2002) or examine specific types of dwarfs, e.g., blue compact dwarfs (BCDs; Noeske, Papaderos, Cairós, & Fricke, 2003; Gil de Paz, Madore, & Pevunova, 2003).
The evolution of dwarfs is a complex problem, where evolutionary paths may depend on a variety of external and internal factors. Our knowledge of the local volume ( Mpc) has deepened, in particular due to strong efforts in determining distances to many nearby galaxies (Karachentsev et al., 2003, and references therein). However, it is still unclear what governs the evolution of dwarfs in low density regions and how the different morphological types form. Progress has in part been hampered by the fact that many early studies are based on small samples, suffer from small number statistics and had systematic selection biases. Headway toward constraining the evolutionary history of dwarf galaxies and identifying the fundamental physical processes involved requires, as a first step, the study of large, statistically significant samples of dwarfs, selected over a large region of the sky without systematic biases.
In a cosmological context, empirical constraints on dwarf galaxies at different look-back times are essential for testing hierarchical models of galaxy formation (White & Frenk, 1991; Steinmetz & Navarro, 2002). One such aspect is the possibility that star formation in low mass dark matter halos gets suppressed due to a number of reasons, including the ejection of gas out of a shallow potential well by early, possibly primordial, episodes of star formation (Silk, 2003; Burkert, 2004).
Many questions remain unresolved in simulations. Over what epochs does the suppression happen: is this a primordial process only, or do dwarfs present a few Gyrs ago also exhibit signs of blowout? What types of masses and star formation histories do dwarf galaxies exhibit empirically, and with such empirically established star formation histories, are they expected to retain their gas? What type of descendants would dwarfs at these epochs yield, if star formation was turned off?
In this paper, we present a study of the properties of dwarf galaxies over the last 3 Gyr ()111We assume in this paper a flat cosmology with and =70 km s-1 Mpc-1. drawn from GEMS (Galaxy Evolution from Morphologies and SEDs, Rix et al., 2004) and the Sloan Digitized Sky Survey (SDSS, Abazajian et al., 2004). Our initial sample consists of 988 dwarfs from the GEMS survey in the redshift range (corresponding to look-back times of 1 to 3 Gyr), and a comparison local sample of 2847 dwarfs with ( Gyr) from SDSS. In this paper, we concentrate on the colors, star formation rates (SFR), star formation histories, and structural properties of dwarf galaxies. In a follow-up paper (Barazza et al. in prep.) we will present a detailed morphological analysis of the dwarf sample from GEMS and also take into account their environment. Throughout the paper we will refer to the dwarf samples from GEMS and SDSS just as without specifying classes (e.g., dE, Im etc.). However, we can assume that most of them are Sm, Im, or BCD in the classification scheme of Sandage & Binggeli (1984), which was also confirmed by a rough visual inspection. This assumptions is based on the fact that both surveys particularly cover low density environments, where late type dwarfs dominate (Karachentsev et al., 2004). The rest of the paper is organized as follows: in 2 we give a brief description of the GEMS survey and explain the sample selections; in 3 follows the presentation of the comparisons performed and the resultant implications as well as a discussion of the findings; finally the summary and conclusions are given in 4.
2 Observations, Sample Selection, and Analysis
2.1 GEMS survey
GEMS is a two-band (F606W and F850LP) Hubble Space Telescope () large-area (800 arcmin2) survey using the Advanced Camera for Surveys (ACS), with accurate redshifts from Combo-17 (Wolf et al., 2004). The principal aim of the GEMS survey is the study of the evolution of galaxies out to Gyr (), using morphologies and structural parameters as well as spectral energy distributions (SEDs). The morphological information is provided by a large-area (800 arcmin2) two-filter ( and ) imaging survey with ACS on . The GEMS field is centered on the Chandra Deep Field-South and reaches depths of AB mag in F606W and AB mag in F850LP for compact sources. The actual GEMS survey provides high-resolution ( corresponding to 165 pc at ) ACS images for galaxies with accurate redshifts ( down to mag)222Henceforth, all magnitudes are given in the VEGA system. Details of the data reduction and galaxy catalog construction are given in Caldwell et al. 2006, in prep.
The dwarf sample drawn from the GEMS survey (see 2.2) has a median redshift of . Therefore, the structural parameters from the GEMS images correspond to a rest-frame filter between SDSS and SDSS . This has to be kept in mind and is further addressed in the discussion of the results presented below. On the other hand, the COMBO-17 survey provides absolute magnitudes in rest-frames and SDSS , and can be compared directly with the local dwarfs.
2.2 The GEMS dwarf sample
We identified and extracted dwarfs from the GEMS survey by applying an absolute magnitude cut of mag. This limit is motivated by two findings. First the luminosity functions of different clusters exhibit small dips around mag (e.g. Trentham & Hodgkin, 2002; Mobasher et al., 2003; Pracy et al., 2004), which might indicate the transition between giants and dwarfs. Secondly, the typical luminosity, which separates Sd from Sm galaxies is around mag (Sandage, Binggeli, & Tammann, 1985) and can be considered as the transition luminosity between disk galaxies massive enough to form spiral arms and disks with more irregular structures, commonly referred to as dwarfs. Thus, the applied cut also has morphological implications. The GEMS sample is complete down to mag, which roughly corresponds to a surface brightness in of mag arcsec-2. However, we limit our GEMS dwarf sample to a effective surface brightness () in of mag arcsec-2, since this is the completeness limit of the SDSS sample (see 2.3). We correct for the effect of cosmological surface brightness dimming using the factor . Finally, we select the redshift range for the GEMS dwarf sample. The lower limit corresponds to three times the expected error in redshift for our dwarf sample (), which is slightly larger than the average error of the GEMS sample, due to the lower luminosity of the dwarfs. The selection of the upper redshift limit was guided by the goal to target dwarfs over a large range of look-back times and potentially different evolutionary stages, while ensuring that the sample at the higher redshift end is not dominated by only bright galaxies, but includes a fair number of dwarfs in the range to mag. These selection conditions yield a sample of 401 objects.
Our goal is to compare the GEMS sample to a sample from the NYU Value-Added low-redshift Galaxy Catalog (NYU-VAGC, Blanton et al., 2005a) of the SDSS, whose completeness limits are defined with respect to effective surface brightness. We therefore fitted the GEMS dwarfs with a Sérsic model (Sérsic, 1968) using GALFIT (Peng et al., 2002), which provides half-light radii and Sérsic indices for all objects. The fits were performed on the -band images and we subsequently limited our final sample to mag arcsec-2. In view of the completeness limit of the GEMS survey (see above), our final GEMS sample is complete down to mag arcsec-2 in for objects with . The redshift distribution of the final sample, which consists of 401 objects, is shown in Figure 1. We note that the volume covered by this sample is rather small ( Mpc3) and the sample may suffer from cosmic variance and not be fully representative of the whole dwarf galaxy population at look-back times around 2 Gyr. Nonetheless, the advantage of this sample is that it allows us to study HST-based structural parameters of a complete sample of dwarfs at earlier look-back times ( Gyr) than has been possible to date.
2.3 SDSS low redshift dwarf sample
SDSS is acquiring ugriz CCD imaging of deg2 of the northern Galactic sky and selecting targets for spectroscopy, most of them galaxies with mag (Abazajian et al., 2004). The local dwarf sample is drawn from the low-redshift catalog of the NYU-VAGC (Blanton et al., 2005a), which is based on the second data release of SDSS.333The used data are therefore not affected by a recently described error in model magnitudes of extended objects (Strateva et al., 2005). This low-redshift catalog consists of 28089 galaxies with distances of 10–200 Mpc (), which have been determined by correcting for peculiar velocities. The catalog provides, among other properties, rest-frame absolute magnitudes as well as photometric parameters from a Sérsic fit in the SDSS filters. The NYU-VAGC SDSS sample of dwarfs was selected using the limits mag and . Finally, we again applied a cut at an effective surface brightness of 22 mag arcsec-2 in , which corresponds to the completeness limit of the NYU-VAGC, given with respect to the -band (Blanton et al., 2005a). The final sample of local dwarfs consists of 1291 objects and is complete down to our surface brightness limit. The luminosity distributions of the GEMS and SDSS samples are shown in Figure 2. The distributions are quite different in the sense that the fraction of low luminosity dwarfs ( mag) is larger in the GEMS sample. On the other hand, there is no large difference between the median values, which are mag and mag for the GEMS and SDSS samples, respectively.
3 Results and Discussion
3.1 Global colors
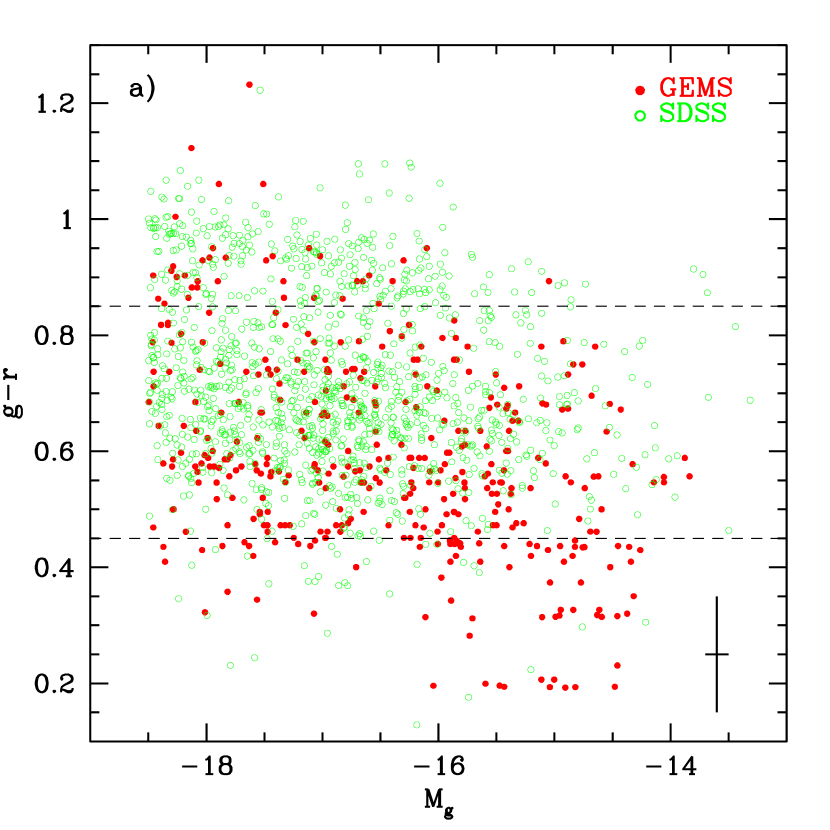
The Combo-17 survey provides rest-frame magnitudes in the SDSS bands, which allows us to directly compare the global colors of the GEMS and SDSS dwarf samples. The resulting color magnitude diagrams for both samples are shown in Figure 3a. The difference in global colors between the two samples is apparent in the histograms shown in Figure 3b. The median colors are 0.57 and 0.70 for GEMS and SDSS, respectively. A KS-test yields a probability of that the two color distributions stem from the same parent distribution.
In addition, there is a population of low luminosity, very blue GEMS dwarfs in Figure 3a, with hardly any local SDSS dwarf counterparts. We refer to these objects as low luminosity blue dwarfs (LLBDs) and include all objects with mag and mag to this group. This leads to 48 LLBDs in the GEMS sample in the redshift range ( of the sample) and 8 LLBDs in SDSS ( of the sample). The magnitudes and colors of the LLBDs are consistent with a recent intermediate- to low-mass starburst. We note, however, that the LLBDs are significantly bluer ( to mag) than typical blue compact dwarfs (, Cairós et al., 2001). On the other hand, there are two well studied dwarfs with luminosities and colors similar to the LLBDs: I Zw 18 (Izotov & Thuan, 2004; Östlin & Mouhcine, 2005) and SBS 1415+437 (Thuan et al., 1999; Aloisi et al., 2005). However, we have to emphasize that the number of LLBDs in GEMS might be strongly overestimated. Some of these objects exhibit abnormally high IR emission, which indicates that they might in fact be star forming galaxies at much higher redshifts. Furthermore, 10 LLBDs exhibit a second smaller peak in their redshift probability distributions in COMBO-17, which typically occurs at . This caveat has to be kept in mind, whenever we discuss LLBDs in the following sections.
Finally, the distribution of the SDSS galaxies defines a red sequence of dwarf galaxies, which has already been shown in the study of Blanton et al. (2005c). These red galaxies have been identified to be early type dwarfs, predominantly dwarf ellipticals. It is not clear, whether the GEMS dwarfs also exhibit a red sequence, probably because the number of objects is too small.
3.2 Structural parameters from Sérsic fits
We determined structural parameters such as half light radii () and effective surface brightnesses () by fitting a Sérsic model to the light distributions of the -band images for both samples. The NYU-VAGC does provide such parameters for all objects. However, these parameters deviate systematically from the ones for the GEMS sample, which were determined using GALFIT. It seems that these differences have been introduced by the different fitting procedures and weighting schemes (see Appendix). Hence, we repeated the Sérsic fits to the SDSS objects using GALFIT, making sure that both samples are fitted using exactly the same procedure, software, and weighting scheme. In Figure 4 we show the histograms of in the -band for both samples. The effective surface brightness is defined as the mean surface brightness within . The two distributions agree quite well and the corresponding median values are very similar (21.10 mag arcsec-2 for GEMS and 21.21 mag arcsec-2 for SDSS).
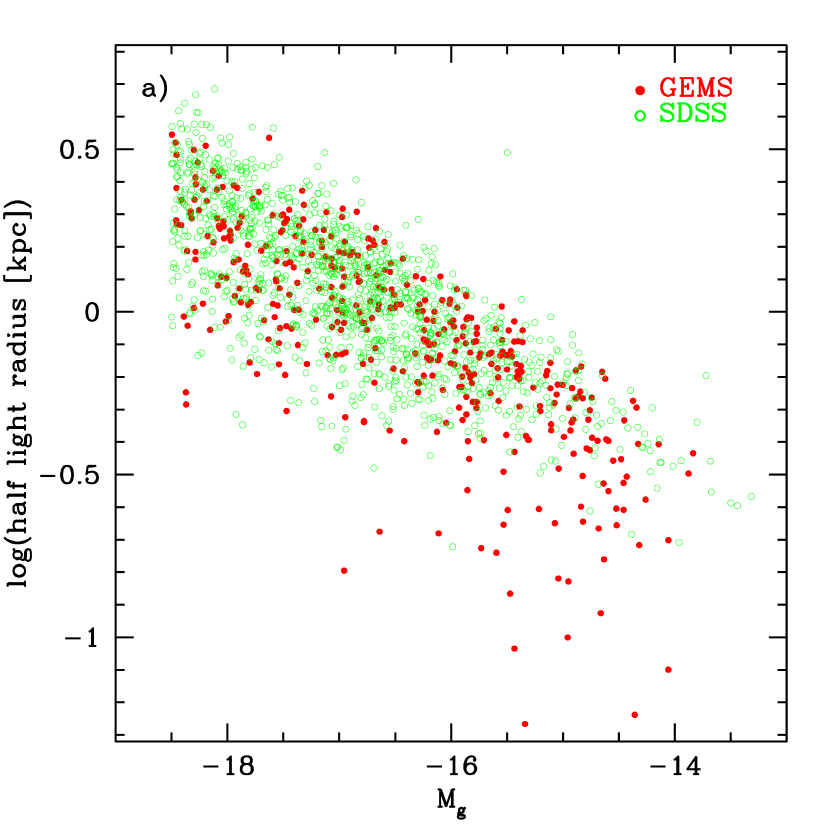
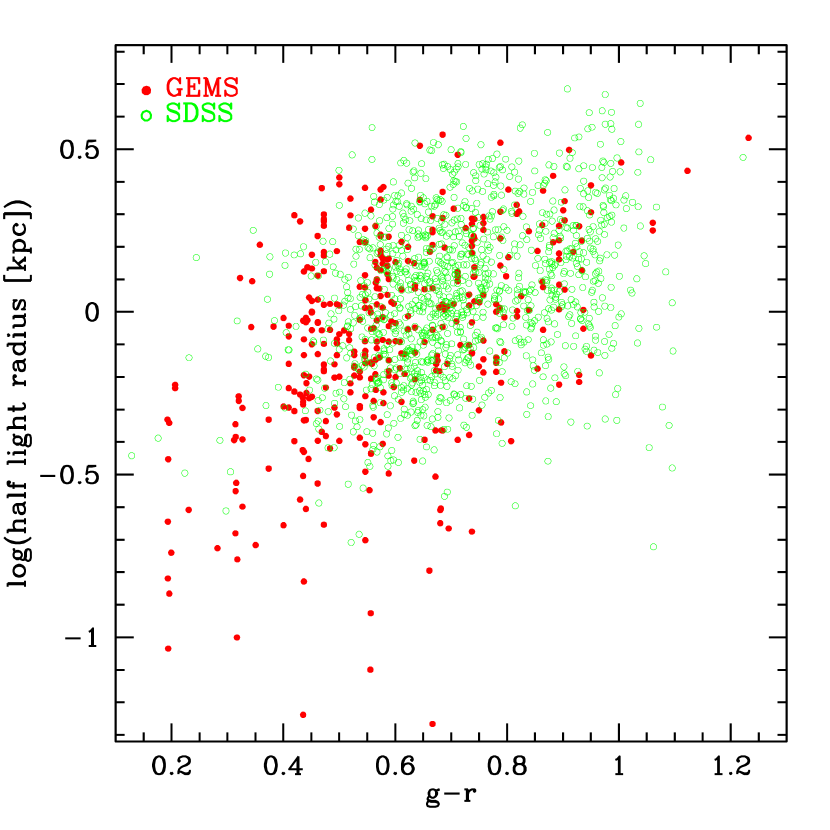
In Figure 5a we plot versus for both samples and Figure 5b shows the histograms for . The distributions overlap quite well, with the majority of GEMS dwarfs having comparable to SDSS dwarfs. There is however a tail of low values exhibited by a small number of GEMS dwarfs. The median for GEMS is 892 pc and for SDSS 1157 pc. A small contribution to this difference stems from the fact that, due to the redshift, the for the GEMS dwarfs have been measured in a slightly bluer band, which is actually closer to the -band than to the -band for the median redshift. Therefore, we also fitted Sérsic models to the SDSS -band images. The corresponding median value is 1125 pc. Thus, the difference in median values remains and might in part be caused by the red sequence dwarfs in SDSS (Figure 3a), which are much less prominent in GEMS. These objects are rather bright and therefore have rather large . On the other hand, there is a significant population of mag objects with below –0.5 in GEMS with almost no counterparts in SDSS (Figure 5a). These are the same objects, which make up the blue low luminosity group pointed out in 3.1 (Figure 6).
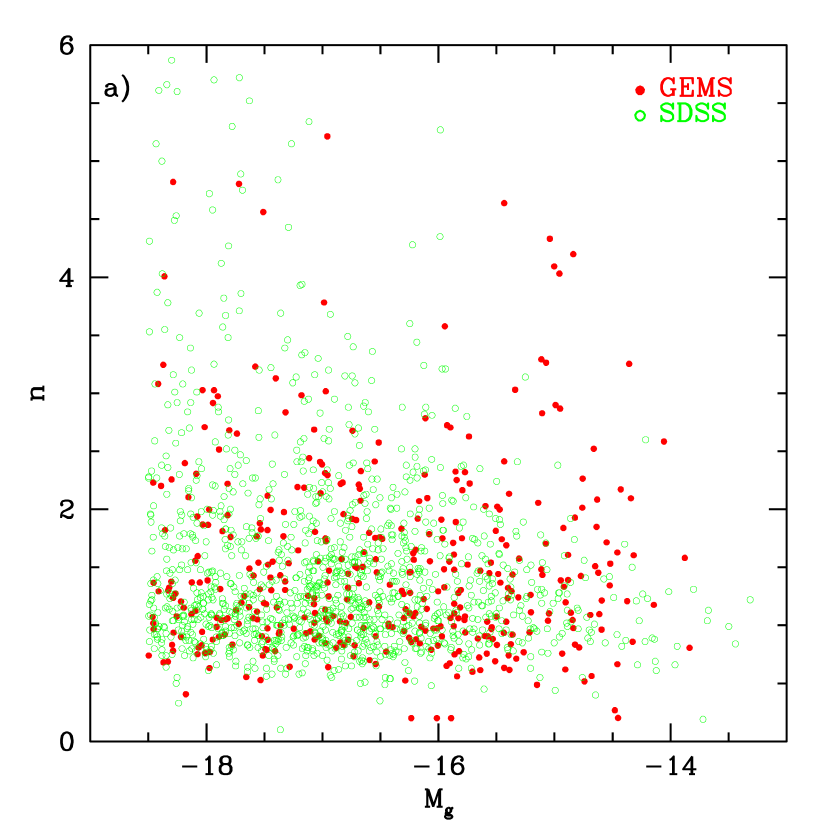
Finally, in Figure 7a the Sérsic index is plotted versus . For the Sérsic model is equivalent to an exponential model and for it is equivalent to a de Vaucouleurs model. The two distributions are quite similar, which is also exhibited in the histograms in Figure 7b. The distributions strongly peak around (median value for GEMS is and for SDSS ), which indicates that the surface brightness profiles of most of the dwarfs are close to an exponential model. In fact, an exponential model is commonly found to best characterize the surface brightness profiles of late-type dwarfs (Makarova, 1999; Barazza, Binggeli, & Prugniel, 2001; Parodi, Barazza, & Binggeli, 2002). On the other hand, for early-type dwarfs models with higher Sérsic indices seem to be more appropriate (Graham & Guzmán, 2003; Barazza et al., 2003). This provides some evidence that the GEMS and the SDSS samples are mainly composed of late-type dwarfs. There is also a group of low luminosity dwarfs in GEMS with quite high . These are mainly the LLBDs, already identified in the previous sections. Hence, while the majority of GEMS and SDSS dwarfs have Sérsic index , the LLBDs are more compact and have therefore higher .
3.3 Star formation histories of GEMS dwarfs
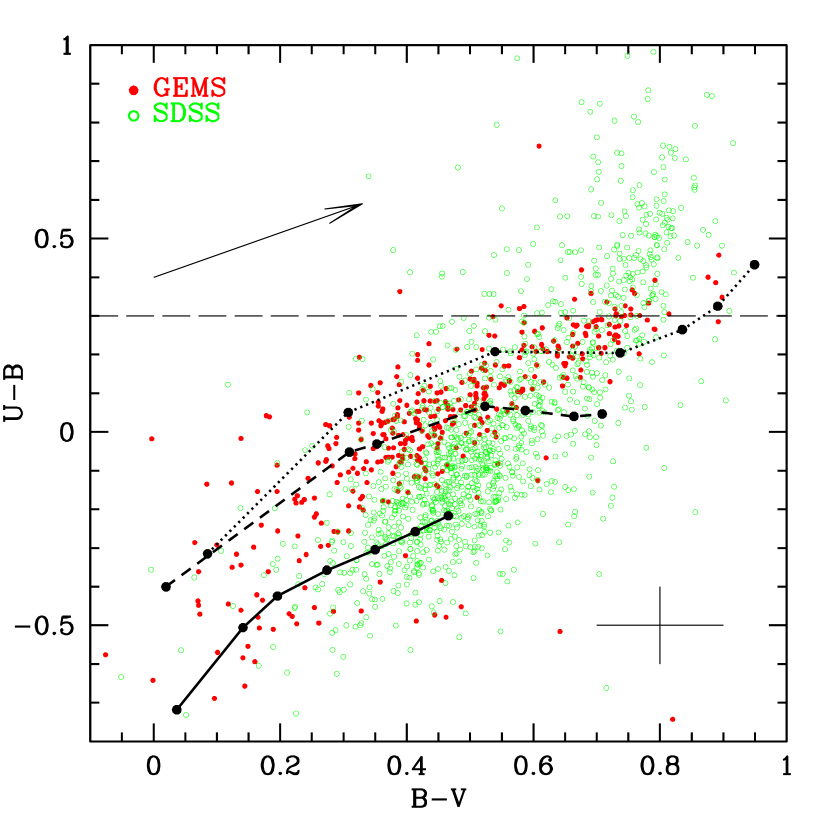
In order to study the colors and star formation histories of the GEMS and SDSS dwarf samples, we compare their and colors to model tracks constructed using Starburst 99 (Leitherer et al., 1999; Vázquez & Leitherer, 2005). We transform the SDSS colors to the Johnson colors using the following equations valid for the galaxy type Im: and (Fukugita et al., 1995). Since we did not derive morphological classes for our samples, we cannot transform the colors according to galaxy types. This introduces some uncertainty to the Johnson colors of the SDSS galaxies. However, as shown by the distribution of Sérsic indices ( 3.2), both samples are strongly dominated by late-type dwarfs (galaxy types Sm, Im). In addition, we are able to roughly identify early type dwarfs according to their colors and have therefore some control of the uncertainties. Assuming that most galaxies with are early-types, the color transformation discussed above adds an error to their color as large as 0.36. In addition, there is another error source introduced by a red leak to the filter and a bias in the sky subtraction reported on the SDSS web pages.444 http://www.sdss.org/dr2/start/aboutdr2.html#imcaveat Both uncertainties will predominantly affect galaxies with and, in particular, affect their color, causing it to be too red. Therefor, the star formation models are not expected to be able to reproduce the corresponding , color combinations. Thus, we will exclude all SDSS galaxies with (see Figure 8) from the following discussion (242 objects, of the SDSS sample), since their colors are too uncertain. The line is drawn on Figure 8 and 9 for reference.
In Figure 8 the versus color-color plot is shown. A general difference between the two samples is again obvious. In order to understand, whether this difference could be linked to the evolution of the galaxies over Gyr (corresponding to the look-back time of the GEMS sample), we compare the colors to different Starburst 99 model tracks. All models shown are based on a Kroupa Initial Mass Function (IMF, Kroupa, 2001). The solid line in Figure 8 represents a model with a constant star formation rate (SFR) of M☉ yr-1 and a metallicity of . These are typical values for field late type dwarfs (van Zee, 2001; Hunter & Elmegreen, 2004). The dashed line shows the color evolution of a Single Stellar Population (SSP) with a mass of M☉ and a metallicity of formed in a single starburst. The dotted line represents the same SSP, but with a metallicity of . The solid dots mark the following time steps (from left to right): 0.1, 0.5, 1.0, 2.0, 4.0, 8.0, 15.0 Gyr.
All three models seem to be able to account for the colors of specific subgroups in Figure 8. However, they are most likely too simple, in order to represent the star formation histories of these dwarfs. The model with constant star formation does reproduce the colors of the bluest objects in both samples, but its luminosity remains too low ( mag) and we would have to apply an unreasonably high SFR ( yr-1) to reach the observed luminosities. The single burst models are able to cover the colors of the redder objects in Figure 8 and they should be representative of galaxies, which do not form stars at the present time, i.e. of early type dwarfs. However, the stellar populations of early type dwarfs in the Local Group, the only such objects which can be studied in enough detail, are known to be more complex than a SSP (Grebel, 1998; Ikuta & Arimoto, 2002; Tolstoy et al., 2003). It is therefore reasonable to assume that the star formation histories of dwarfs constitute a mixture of multiple bursts and periods of constant star formation, probably with different SFRs. Figure 8 suggests that the combination of different modes of star formation can reproduce the observed colors.
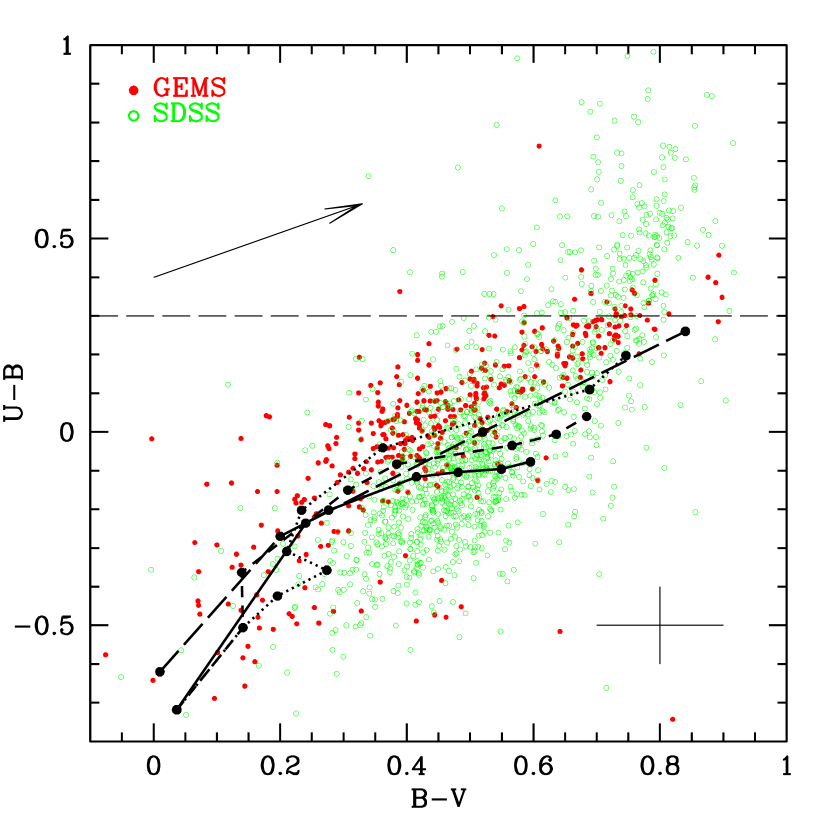
In Figure 9 we plot tracks of models, which combine a single starburst with continuous star formation. The onset of the burst occurs at different times: together with the star formation at the earliest time step (solid line), 0.9 Gyr after the beginning of the continuous star formation (short dashed line), and 3.9 Gyr after the beginning of the continuous star formation (dotted line). In addition, we add a model with an exponentially decreasing SFR (long dashed line). These models are still just an approximation to the real star formation histories. For instance, the starburst component of the star formation histories could also be represented by several minor bursts, instead of one larger burst. However, the models reproduce the required luminosity range ( mag between roughly 4–15 Gyr) and they cover the observed colors. The most important aspect of these model tracks is that they all exhibit a certain period of time, in which the color remains more or less constant, but the color changes significantly. This is in qualitative agreement with the color difference between the samples shown in Figures 8 and 9, and also with the different distributions in Figure 3b.
The models also show that an age difference of Gyr is enough to increase the color by , which is of the same order as observed. In addition, the color changes more rapidly at earlier times than at later times. This property is mostly caused by the burst component, whereas the passive evolution after the burst changes the colors only weakly. Interestingly, this characteristic is also shown by the observations. The median color difference between the samples decreases with increasing color. For the color bin the difference is 0.16 and then decreases along the distribution reaching 0.01 for the bin . This indicates that the sequence of galaxies in the color-color plot is mainly due to the age of the most recent episode of star formation. The bluest galaxies are those having experienced a recent episode of star formation, while the redder dwarfs are older remnants. The luminosity appears to be less important for this relation, which is also indicated by the shallow slope in the color magnitude diagram (Figure 3a) and its large scatter.
We can therefore conclude that the range of global colors shown by GEMS and SDSS dwarfs (over look-back times of 3 Gyr) is consistent with a star formation history involving multiple bursts of star formation, possibly combined with intermediate periods of relatively constant SFRs. Also a model representing an exponentially decreasing SFR is able to reproduce the observed colors. In particular, we note that a single burst model or a history of constant star formation alone, cannot reproduce the full color range. We also find that the bluer colors typical of GEMS dwarfs (present at or look-back times of 1–3 Gyr) can evolve by mag into the redder colors of SDSS dwarfs (present at ) over Gyr.
3.4 Feedback from star formation and requirements for blowaway in dwarfs
Empirical constraints on the luminosity, star formation histories, and star formation feedback in dwarf galaxies at different look-back times can provide useful constraints for hierarchical Lambda-CDM models of galaxy formation and, in particular, on the issue of feedback and blowout of gas via star formation in low mass galaxies. In a first step we, therefore, estimate the SFRs of the GEMS dwarfs. The COMBO-17 survey provides the rest-frame luminosities in a synthetic UV band centered on the 2800Å line. For the redshift range of our GEMS sample the luminosities in this band are based on extrapolations beyond the filter set used in COMBO-17. For the luminosities in this UV band, we can derive the fluxes in the 2800Å line, . In order to estimate the SFRs we then use the following equation (Kennicutt, 1998):
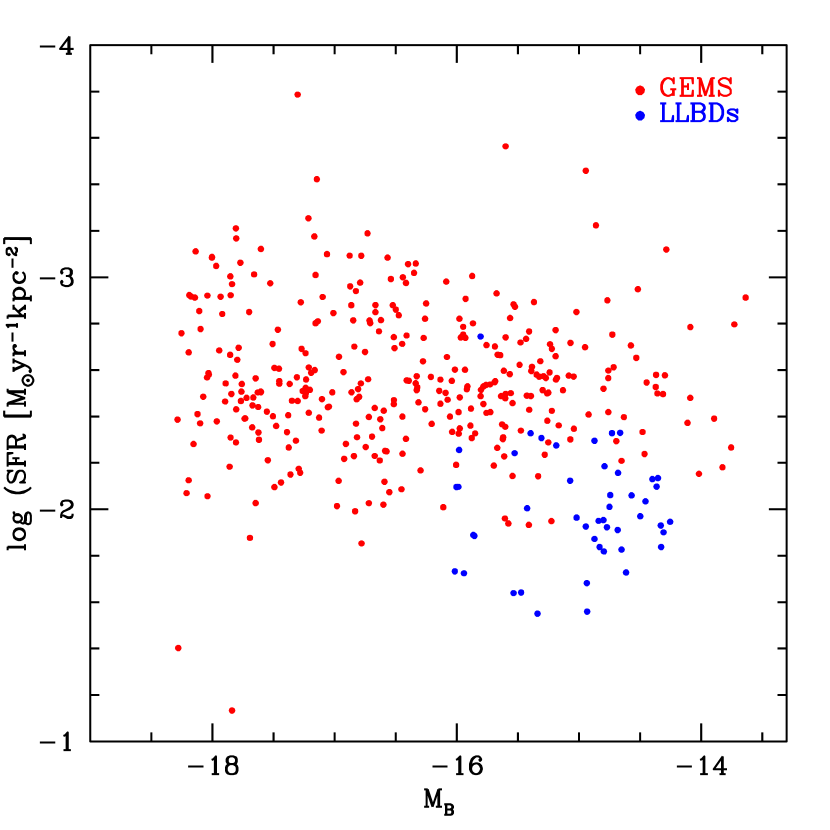
This equation applies to galaxies with continuous star formation over the last years, which is likely the case for a majority of our dwarfs. For objects, which experienced a starburst within the last years, the SFRs obtained in this way will underestimate the actual SFR. In Figure 10 we plot the normalized SFR versus . For the normalization we use the isophotal area provided by Sextractor. The range of normalized SFRs we obtained by this rough estimate agrees very well with the values found for a sample of nearby field dwarfs presented by Hunter & Elmegreen (2004). Figure 10 indicates that the LLBDs have relatively high SFRs per unit area.
In order to obtain an estimate of the energies needed for an ejection of gas via starbursts in dwarf galaxies we consider the model of Mac Low & Ferrara (1999). The study estimates the impact of repeated supernovae on the interstellar medium. Two specific scenarios are distinguished: blowout, in which gas is expelled from the disk, but will in part be reaccreted at later epochs, and blowaway, in which the gas becomes completely unbound and is lost to the dwarf. The latter scenario is the one we consider for our estimate. The mechanical luminosity needed for a blowaway to occur depends on the visible mass of the dwarf and the effective sound speed, which in turn is related to the axis ratio (Mac Low & Ferrara, 1999). The corresponding equations are:
and
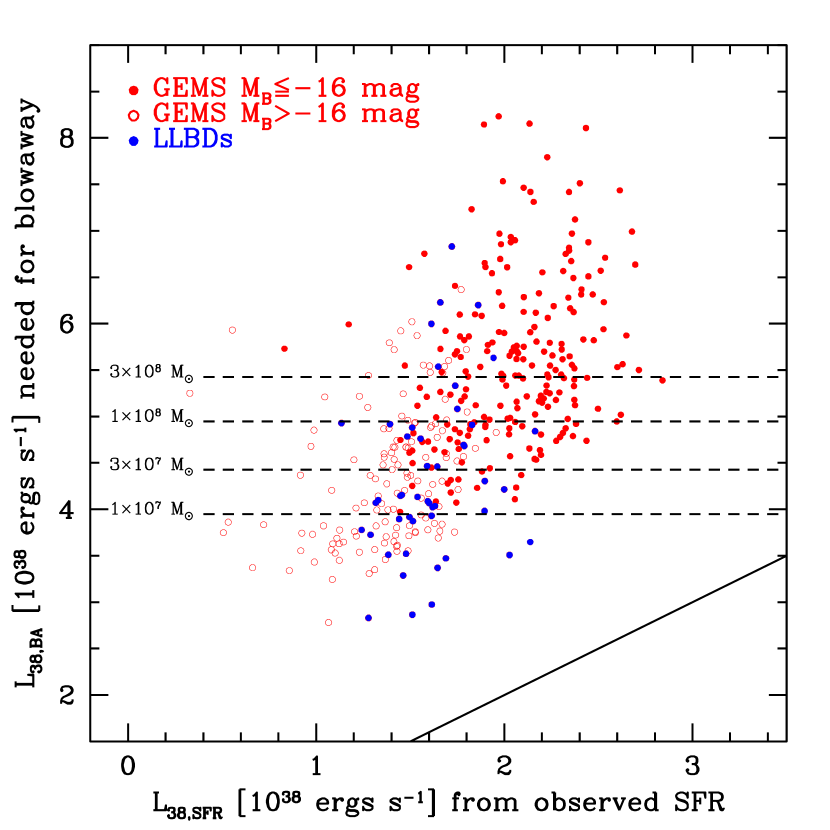
corresponds to the logarithm of the mechanical luminosity in units of ergs s-1, is the visible mass in units of , is a constant, is the dark-to-visible mass ratio given as , is a constant, is the effective sound speed in units of 10 km s-1, , where is the Hubble constant, and is the ellipticity. We estimate the visible mass of our galaxies using the -band luminosity. The axis ratios are provided by the Sérsic fits. It is clear that more luminous galaxies need a higher mechanical luminosity for complete blowaway of the gas. This is due to the fact that we used the luminosity to derive the mass, which was then used to determine the mechanical luminosity. For a given , there is a range in mechanical luminosities for blowaway due to the range in ellipticities. Note, however, that the mechanical luminosities obtained in this way have to be considered as lower limits, since we most likely underestimate the mass and use apparent ellipticities. The estimates of the mechanical luminosities needed for a complete blowaway of the gas in our dwarfs () is plotted versus the mechanical luminosities inferred from the SFRs () in Figure 11. The solid line corresponds to . Obviously, no significant gas loss would occur in these objects, if their SFRs would never exceed the ones inferred from their observed near-UV luminosities.
Next, using the star formation histories and starburst strengths that were found to reproduce the observed range in colors of GEMS and SDSS dwarf galaxies (see 3.3 and Figure 9), we computed the maximum mechanical luminosities, which can be injected into the ISM by the relevant starbursts of different masses. The range in luminosities is illustrated on Figure 11 by three dashed lines corresponding to starburst masses of M☉, M☉, M☉, and M☉. We find that for their derived star formation histories, the luminous ( to mag) dwarfs are likely to retain their gas and avoid blowaway. However, there are a fair number of low luminosity dwarfs ( to ) that are susceptible to a complete blowaway of gas, if they were to experience a starburst. However, in practice, only a small fraction of these low luminosity dwarfs may be actually undergoing a starburst. Even though, we do not have any clear evidence that some dwarfs in our sample experience a starburst at the time of observation, we are also not able to rule this out. The derived mechanical luminosities stem from the SFRs, which have been determined assuming that the dwarfs had a constant SFR over the last years. In addition, we used the near-UV luminosities, which could be affected by dust. In view of these uncertainties, the derived SFRs have to be considered as lower limits. The LLBDs could actually be a population, for which the SFRs have been significantly underestimated, since their magnitudes and colors are consistent with a recent low to intermediate starburst ( 3.1) and they are compact (Figure 6), such that they will likely have a high SFR per unit area. This is confirmed in Figure 10.
4 Summary and Conclusions
We present a study of the colors, structural properties, and star formation histories in a sample of dwarfs present over the last 3 Gyr (). Our sample consists of 401 dwarfs over (corresponding to of 1 to 3 Gyr) from the GEMS survey and a comparison sample of 1291 dwarfs with ( Gyr) from the SDSS. Our final sample is complete down to an effective surface brightness of 22 mag arcsec-2 in and includes dwarfs with to mag. The main results are:
The mean global color of GEMS dwarfs ( mag) is bluer than that of the SDSS dwarfs ( mag) by 0.13 mag. Using Starburst 99, we find that the full range of global colors shown by SDSS and GEMS dwarfs, over look-back times of 3 Gyr, is consistent with a star formation history involving bursts of star formation, combined with periods of relatively constant SFRs or exponentially decreasing SFRs. In particular, we note that a single burst model or a history of constant star formation alone, cannot reproduce the full color range. We also find that the bluer colors typical of GEMS dwarfs can evolve by mag into the redder colors of SDSS dwarfs over Gyr.
We identify a population of low luminosity ( to mag), blue ( mag) dwarfs (LLBDs) in the GEMS sample, with hardly any counterparts among local SDSS dwarfs. The very blue colors of the LLBDs are comparable to those of systems, such as I Zw 18 and SBS 1415+437. Their magnitudes and colors are consistent with a recent intermediate-to-low mass starburst. However, we have to stress the caveat that a large fraction of these objects might in fact be star forming galaxies at much higher redshifts. This is indicated by an abnormally high IR emission of some of these objects and the fact, that 10 LLBDs (out of 48) exhibit a second peak around in their redshift probability distributions.
We performed Sérsic fits to the GEMS and SDSS dwarfs using GALFIT making sure that both samples are fitted using the exact same procedure and weighting schemes. Our experience shows that this approach is essential for avoiding large spurious differences (see Appendix). We find that of GEMS dwarfs and of SDSS dwarfs have Sérsic . The majority of GEMS dwarfs have half light radii comparable to those of SDSS dwarfs.
We estimate the SFR per unit area of GEMS dwarfs using the rest-frame UV (2800Å) luminosity and find values in the range to M☉ yr-1 kpc-2. We note that the LLBDs have magnitudes and colors consistent with a recent low-to-intermediate mass starburst, small half light radii, and resultant high SFRs per unit area.
Finally, we estimate the mechanical luminosities needed for the gas in the GEMS dwarfs to become unbound and lost (blowaway). We then compare these to maximum mechanical power that would be injected by starbursts that are consistent with the derived star formation histories of these dwarfs. We find that the luminous ( to mag) dwarfs are likely to retain their gas and avoid blowaway. However, there are a fair number of low luminosity dwarfs ( to mag) that are susceptible to a complete blowaway of gas, if they were to experience a starburst.
Appendix A Systematic differences in Sérsic parameters derived using different fitting methods
During the analysis of the structural properties of the two samples we realized that there are systematic differences between the Sérsic parameters provided by the NYU VAGC and the results from GALFIT (Peng et al., 2002) used for the GEMS sample. The differences are larger than the expected errors and are most likely caused by specifics of the two fitting methods applied. In order to confirm this conjecture, we randomly selected 250 galaxies from SDSS covering the entire luminosity range considered in this study. We fitted the surface brightness distributions of this subsample with a Sérsic model using GALFIT. Five objects could not be fitted by GALFIT. The effective radii () of the remaining 245 galaxies are compared to the provided by the NYU VAGC in Figure 12. Obviously, GALFIT is systematically measuring larger radii. The fitting method used for the NYU VAGC is described in Blanton et al. (2005b). There appear to be two major differences in the fitting procedure compared to GALFIT: (1) all pixels are weighted equally in NYU VAGC, whereas in GALFIT each pixel is weighted by the Poisson noise, (2) in the NYU VAGC a axissymmetric model is assumed, whereas in GALFIT the ellipticity and the position angle are included in the fitting process. The latter discrepancy probably makes the largest contribution to the differences observed, as suggested by Figure 13. The largest differences occur in the most inclined objects, although with a very large scatter. After fitting both samples using the same method and weighting scheme as in GEMS, the differences in practically disappear (see 3.2).
The presented comparison does not intend to judge the quality or correctness of the two approaches, but it shows that one has to be very cautious by combining model parameters stemming from different fitting methods.
References
- Abazajian et al. (2004) Abazajian, K., et al. 2004, AJ, 128, 502
- Aloisi et al. (2005) Aloisi, A., van der Marel, R. P., Mack, J., Leitherer, C., Sirianni, M., & Tosi, M. 2005, ApJ, 631, L45
- Barazza, Binggeli, & Prugniel (2001) Barazza, F. D., Binggeli, B., & Prugniel, P. 2001, A&A, 373, 12
- Barazza et al. (2003) Barazza, F. D., Binggeli, B., & Jerjen, H. 2003, A&A, 407, 121
- Binggeli & Cameron (1991) Binggeli, B. & Cameron, L. M. 1991, A&A, 252, 27
- Blanton et al. (2005a) Blanton, M. R., et al. 2005a, AJ, 129, 2562
- Blanton et al. (2005b) Blanton, M. R., Eisenstein, D., Hogg, D. W., Schlegel, D. J., & Brinkmann, J. 2005b, ApJ, 629, 143
- Blanton et al. (2005c) Blanton, M. R., Lupton, R. H., Schlegel, D. J., Strauss, M. A., Brinkmann, J., Fukugita, M., & Loveday, J. 2005c, ApJ, 631, 208
- Bottinelli, Gouguenheim, Fouque, & Paturel (1990) Bottinelli, L., Gouguenheim, L., Fouque, P., & Paturel, G. 1990, A&AS, 82, 391
- Bremnes, Binggeli, & Prugniel (1998) Bremnes, T., Binggeli, B., & Prugniel, P. 1998, A&AS, 129, 313
- Bremnes, Binggeli, & Prugniel (1999) Bremnes, T., Binggeli, B., & Prugniel, P. 1999, A&AS, 137, 337
- Bremnes, Binggeli, & Prugniel (2000) Bremnes, T., Binggeli, B., & Prugniel, P. 2000, A&AS, 141, 211
- Bruzual & Charlot (1993) Bruzual A., G., & Charlot, S. 1993, ApJ, 405, 538
- Burkert (2004) Burkert, A. 2004, ASP Conf. Ser. 322: The Formation and Evolution of Massive Young Star Clusters, 322, 489
- Cairós et al. (2001) Cairós, L. M., Caon, N., Vílchez, J. M., González-Pérez, J. N., & Muñoz-Tuñón, C. 2001, ApJS, 136, 393
- Drinkwater, Gregg, Holman, & Brown (2001) Drinkwater, M. J., Gregg, M. D., Holman, B. A., & Brown, M. J. I. 2001, MNRAS, 326, 1076
- Fukugita et al. (1995) Fukugita, M., Shimasaku, K., & Ichikawa, T. 1995, PASP, 107, 945
- Gil de Paz, Madore, & Pevunova (2003) Gil de Paz, A., Madore, B. F., & Pevunova, O. 2003, ApJS, 147, 29
- Graham & Guzmán (2003) Graham, A. W., & Guzmán, R. 2003, AJ, 125, 2936
- Grebel (1998) Grebel, E. K. 1998, Highlights in Astronomy, 11, 125
- Grebel (2000) Grebel, E. K. 2000, ESA SP-445: Star Formation from the Small to the Large Scale, 87
- Hunter & Elmegreen (2004) Hunter, D. A. & Elmegreen, B. G. 2004, AJ, 128, 2170
- Ikuta & Arimoto (2002) Ikuta, C., & Arimoto, N. 2002, A&A, 391, 55
- Izotov & Thuan (2004) Izotov, Y. I., & Thuan, T. X. 2004, ApJ, 616, 768
- Jerjen, Binggeli, & Freeman (2000) Jerjen, H., Binggeli, B., & Freeman, K. C. 2000, AJ, 119, 593
- Karachentsev, Makarov, & Huchtmeier (1999) Karachentsev, I. D., Makarov, D. I., & Huchtmeier, W. K. 1999, A&AS, 139, 97
- Karachentsev et al. (2003) Karachentsev, I. D., et al. 2003, A&A, 398, 479
- Karachentsev et al. (2004) Karachentsev, I. D., Karachentseva, V. E., Huchtmeier, W. K., & Makarov, D. I. 2004, AJ, 127, 2031
- Karachentsev (2005) Karachentsev, I. D. 2005, AJ, 129, 178
- Kennicutt (1998) Kennicutt, R. C. 1998, ARA&A, 36, 189
- Kroupa (2001) Kroupa, P. 2001, MNRAS, 322, 231
- Leitherer et al. (1999) Leitherer, C., et al. 1999, ApJS, 123, 3
- Mac Low & Ferrara (1999) Mac Low, M.-M., & Ferrara, A. 1999, ApJ, 513, 142
- Makarova (1999) Makarova, L. 1999, A&AS, 139, 491
- Mateo (1998) Mateo, M. L. 1998, ARA&A, 36, 435
- Mobasher et al. (2003) Mobasher, B., et al. 2003, ApJ, 587, 605
- Noeske, Papaderos, Cairós, & Fricke (2003) Noeske, K. G., Papaderos, P., Cairós, L. M., & Fricke, K. J. 2003, A&A, 410, 481
- Östlin & Mouhcine (2005) Östlin, G., & Mouhcine, M. 2005, A&A, 433, 797
- Parodi, Barazza, & Binggeli (2002) Parodi, B. R., Barazza, F. D., & Binggeli, B. 2002, A&A, 388, 29
- Peng et al. (2002) Peng, C. Y., Ho, L. C., Impey, C. D., & Rix, H. 2002, AJ, 124, 266
- Pracy et al. (2004) Pracy, M. B., De Propris, R., Driver, S. P., Couch, W. J., & Nulsen, P. E. J. 2004, MNRAS, 352, 1135
- Rix et al. (2004) Rix, H., et al. 2004, ApJS, 152, 163
- Sandage & Binggeli (1984) Sandage, A. & Binggeli, B. 1984, AJ, 89, 919
- Sandage, Binggeli, & Tammann (1985) Sandage, A., Binggeli, B., & Tammann, G. A. 1985, AJ, 90, 1759
- Schlegel et al. (1998) Schlegel, D. J., Finkbeiner, D. P., & Davis, M. 1998, ApJ, 500, 525
- Sérsic (1968) Sérsic, J. L. 1968, Cordoba, Argentina: Observatorio Astronomico, 1968
- Silk (2003) Silk, J. 2003, MNRAS, 343, 249
- Steinmetz & Navarro (2002) Steinmetz, M., & Navarro, J. F. 2002, New Astronomy, 7, 155
- Strateva et al. (2005) Strateva, I. V., et al. 2005, AJ, 130, 1961
- Thuan et al. (1999) Thuan, T. X., Izotov, Y. I., & Foltz, C. B. 1999, ApJ, 525, 105
- Tolstoy et al. (2003) Tolstoy, E., Venn, K. A., Shetrone, M., Primas, F., Hill, V., Kaufer, A., & Szeifert, T. 2003, AJ, 125, 707
- Trentham (1998) Trentham, N. 1998, MNRAS, 293, 71
- Trentham & Hodgkin (2002) Trentham, N. & Hodgkin, S. 2002, MNRAS, 333, 423
- van den Bergh (2000) van den Bergh, S. 2000, The galaxies of the Local Group, by Sidney Van den Bergh. Published by Cambridge, UK: Cambridge University Press, 2000 Cambridge Astrophysics Series Series, vol no: 35, ISBN: 0521651816.,
- van Zee (2001) van Zee, L. 2001, AJ, 121, 2003
- Vázquez & Leitherer (2005) Vázquez, G. A., & Leitherer, C. 2005, ApJ, 621, 695
- White & Frenk (1991) White, S. D. M., & Frenk, C. S. 1991, ApJ, 379, 52
- Wolf et al. (2004) Wolf, C., et al. 2004, A&A, 421, 913