Full-Polarization Observations of OH Masers in Massive Star-Forming Regions: II. Maser Properties and the Interpretation of Polarization
Abstract
We analyze full-polarization VLBA data of ground-state, main-line OH masers in 18 massive star-forming regions previously presented in a companion paper. From the aggregate properties of our sources, we confirm results previously seen in the few individual sources studied at milliarcsecond angular resolution. The OH masers often arise in the shocked neutral gas surrounding ultracompact H II regions. Magnetic fields as deduced from OH maser Zeeman splitting are highly ordered, both on the scale of a source as well as the maser clustering scale of cm. Results from our large sample show that this clustering scale appears to be universal to these masers. OH masers around ultracompact H II regions live years and then turn off abruptly, rather than weakening gradually with time. These masers have a wide range of polarization properties. At one extreme (e.g., W75 N), -components are detected and the polarization position angles of maser spots show some organization. At the other extreme (e.g., W51 e1/e2), almost no linear polarization is detected and total polarization fractions can be substantially less than unity. A typical source has properties intermediate to these two extremes. In contrast to the well ordered magnetic field inferred from Zeeman splitting, there is generally no clear pattern in the distribution of polarization position angles. This can be explained if Faraday rotation in a typical OH maser source is large on a maser amplification length but small on a single (-folding) gain length. Increasing or decreasing Faraday rotation by a factor of among different sources can explain the observed variation in polarization properties. Pure -components (in theory 100% linearly polarized) have long been sought, but seldom found. We suggest that almost all -components acquire a signficant amount of circular polarization from low-gain stimulated emission of a -component from OH appropriately shifted in velocity and lying along the propagation path.
1 Introduction
Hydroxyl (OH) masers are common in massive star-forming regions (SFRs). Their small size and large Zeeman splitting coefficient allow them to serve as probes of the velocity and magnetic fields on a very small scale. Because OH masers often cluster together in large numbers on subarcsecond scales (e.g., Reid et al., 1980), very long baseline interferometric (VLBI) techniques are required to identify individual maser features. Due both to this close clustering of maser spots and to the tendency for the two components of a ground-state Zeeman pair to have highly unequal fluxes (Cook, 1966), the resolution afforded by VLBI is necessary in order to identify most Zeeman pairs (see, for instance, Fish et al., 2003). Likewise, identifying individual maser spots in a cluster is a prerequisite to understanding the linear polarization of OH masers, since blending of the linear polarization from adjacent masers with different polarization properties can corrupt the interpretation of the polarization.
Over a quarter century has passed since the first OH maser source was observed with VLBI resolution: W3(OH) by Reid et al. (1980). Since then, only a few more interstellar ground-state OH maser sources have been observed at VLBI resolution (Haschick et al., 1981; Zheng, 1997; Slysh et al., 2001, 2002). In order to understand the range of environments probed by OH masers in massive SFRs, we have undertaken a survey of the OH masers in 18 massive SFRs with the National Radio Astronomy Observatory’s111The National Radio Astronomy Observatory is a facility of the National Science Foundation operated under cooperative agreement by Associated Universities, Inc. Very Long Baseline Array (VLBA). The data have already been published as Fish et al. (2005, hereafter Paper I).
In this paper we analyze the results both in terms of relevance to individual sources and as a large collection of OH masers that can shed additional light on the physical processes of OH masers and the interpretation of their polarization. A brief overview of linear polarization theory is provided in §2. In §3, we consider the set of OH masers as a whole to derive statistical properties. In §4, we present plausibility arguments to attempt to identify the physical processes responsible for the observed properties of OH masers. Finally, we summarize our results in §5. Comments on individual sources are included in Appendix A.
2 Linear Polarization Theory
In the presence of a magnetic field, each of the main-line OH transitions split into three lines: two elliptically-polarized -components shifted in frequency by the Zeeman effect, and one linearly-polarized -component at the natural frequency of oscillation for the velocity of the emitting material (see, e.g., Davies, 1974). Due in part to unequal amplification, this clear pattern of three lines has only been seen once (Hutawarakorn, Cohen, & Brebner, 2002). To this point, there have been few, if any, unambiguous detections of -components. Often, a single -component is seen by itself, without an accompanying -component polarized in the opposite circular handedness strong enough to be detected. Significant linear polarizations, which could be produced by -components, have been seen (Slysh et al., 2002). However, -components associated with magnetic fields with a nonzero perpendicular (line-of-sight) component are in general elliptically polarized, and elliptical polarization is the sum of circular and linear polarizations. Thus, significant linear polarization fractions can be produced by both - and -components, the latter theoretically being 100% linearly polarized in all instances.
The existence of maser spots with large (but not unity) fractional linear polarization suggests that -components may in practice be partially circularly polarized as well. It is difficult to select an observational threshold of the linear polarization fraction that divides -components from -components. Theoretical modelling by Goldreich, Keeley, & Kwan (1973b) and Gray & Field (1995) suggests that amplification of -components is stronger than that of -components for , where is the angle of the magnetic field to the line of sight. This corresponds to a linear polarization fraction . But since linear and circular polarization fractions add in quadrature, a completely polarized spot is not more linear than circular until the linear polarization fraction exceeds 0.71. Even then it is unclear how -components, which are theoretically totally linearly polarized, can acquire a circular component of polarization. This issue is discussed in further detail in §4.4.
It is important to distinguish between - and -components, because the interpretation of the orientation of the magnetic field based on the linear polarization position angle is different for the two cases. The electric vector for a -component is perpendicular to the two-dimensional magnetic field direction (i.e., on the plane of the sky), while the electric vector for a -component is parallel to the two-dimensional magnetic field direction. Thus, without information as to which maser spots are -components and which are -components, there is a ambiguity in the direction of the magnetic field on the plane of the sky.
3 Results
3.1 Are Zeeman Triplets Ever Seen?
Hutawarakorn, Cohen, & Brebner (2002) identified a complete Zeeman triplet in the northernmost group of OH masers in W75 N (catalog W75N), the first and only OH Zeeman triplet identified. Figure 1 shows a spectrum of a subregion of the northernmost group of OH masers. Three maser lines can be seen at 4.1, 5.7, and 7.3 km s-1. The splitting of the 4.1 and 5.7 km s-1 maser lines is consistent with a magnetic field of mG and a velocity of 5.7 km s-1. We confirm the existence of this triplet, although the three components are not perfectly aligned spatially. The angular separation between the - and RCP -component is 55 mas, which corresponds to a two-dimensional linear separation of cm (110 AU). This is roughly the cluster scale of OH masers (see §3.2), though larger than the typical scale of separation between the two -components in a Zeeman pair. It is possible that the - and both -components all are located in the same cloudlet but from amplification paths that are not coincident.
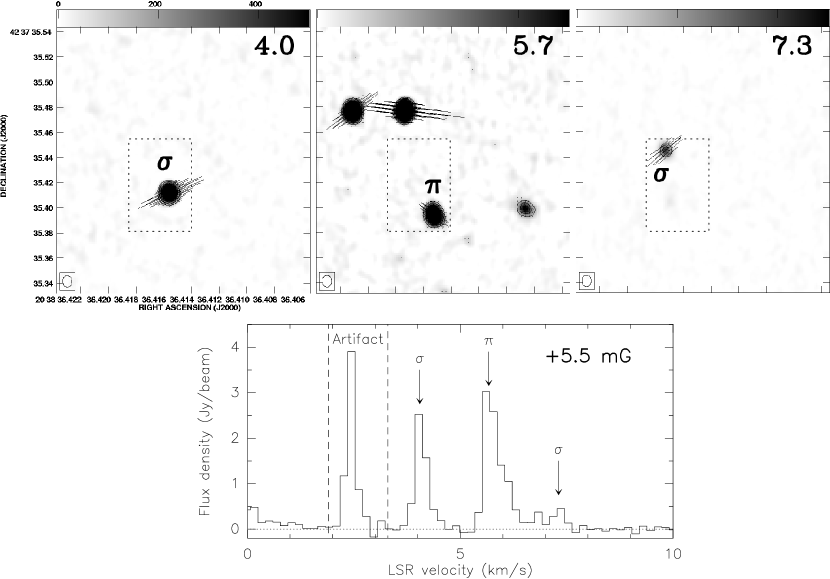
The linear polarization fractions of the -components are 16% and 20%, while the corresponding fraction of the -component is 86%. The polarization position angles of the -components at 4.1 and 7.3 km s-1 are and , respectively, while the position angle of the -component at 5.7 km s-1 is . This roughly fits the theory that -components are linearly polarized with a position angle perpendicular to that of the -components.
The angle of the magnetic field to the line of sight, , can be derived from the formula
| (1) |
where is the linear polarization fraction of a -component (Goldreich, Keeley, & Kwan, 1973a). This angle is and for the two -components of the Zeeman triplet. Equal amplification rates of the - and -components occur when , or for , with -components favored when the magnetic field is more highly inclined to the line of sight (Goldreich, Keeley, & Kwan, 1973b). Modelling of OH hyperfine populations for conditions typically found at maser sites shows that the amplification of -components falls off rapidly for (Gray & Field, 1995). For smaller , beaming and competitive gain favor -components, suppressing amplification of -components. Yet the inclination of the magnetic field to the line of sight is , not , in the only confirmed Zeeman triplet.
Figure 2 shows a plot of the fractional linear polarization of maser spots in the northernmost cluster of OH spots in W75 N versus the position angle of polarization. The masers seem to be grouped into two populations. The first group consists of masers whose position angle is less than . These masers have a high linear polarization fraction. The second group, with position angles , are mostly circularly polarized. If we interpret these groups as - and -components respectively, the magnetic field implied from linear polarization lies at position angle in the region, with a scatter of . This would indicate that the direction of the magnetic field on the plane of the sky is roughly aligned along the NE-SW distribution of maser spots and the elongation of the continuum source VLA 1.

3.2 Clustering Scale
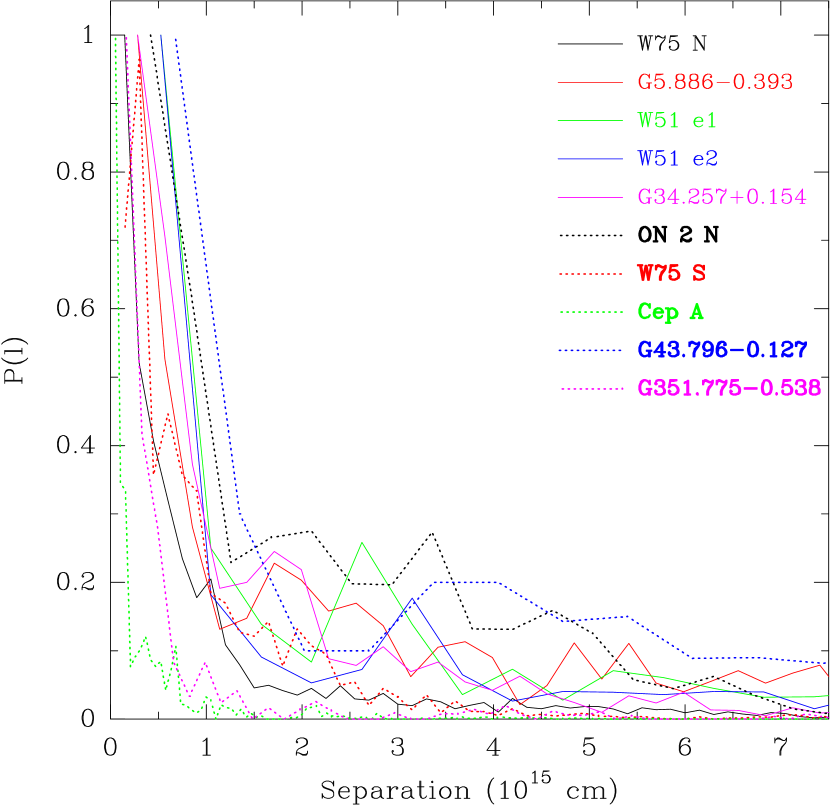
In W3(OH), Reid et al. (1980) found that the clustering scale of OH masers was approximately cm. They calculated a two-point spatial correlation function and found that the probability per unit solid angle of finding another maser spot within angular distance of a spot decreased sharply for cm. We performed a similar analysis on each of our sources, and the results for the ten having a large number of maser spots are shown in Figure 3. For all ten sources, the probability drops sharply between a separation of 0 and cm (67 AU). The other sources in this study show similar behavior, although the plots are “noisier” owing to the smaller number of maser spots in the sources. This evidence argues in favor of a common clustering scale for OH masers in all massive SFRs. The maser spots within these clusters represent paths in the same condensation where the physical conditions are favorable to exponential amplification. If so, the overall extent of these condensations is perhaps a few times as large ( AU), since paths through the periphery of the condensation are much less likely to produce comparable amplification lengths. In §4.6 we suggest that instabilities in the shocked neutral gas may lead to the formation of such condensations.
3.3 Zeeman Pairs and Component Intensities
In total, we find 184 Zeeman pairs in the entire sample set. These Zeeman pairs are listed in Table 21 of Paper I. A histogram of the distribution of implied magnetic field strengths is given in Figure 4. The distribution rises with increasing magnetic field strength to about 4 mG, then falls.
Few Zeeman pairs are found that imply a splitting greater than about 8 mG, and the largest magnetic field strength found is 21 mG in W51 (catalog ) e2. There is theoretical support for the existence of an upper limit to the strength of the magnetic field in a Zeeman pair for OH masers. The collapse of material increases both the density and the magnetic field; Mouschovias (1976) suggests that the relation could be as steep as , and Zeeman measurements of the magnetic field in molecular clouds are consistent with this relation (e.g., Crutcher, 1999). At some density, the rate of collisional deexcitation will be higher than the pump rate (presumably from radiative excitation), and the population inversion between the lower and upper states will be destroyed. The rate of collisions of H2 with OH is , where cms-1, and the pump rate likely is s-1, as would be expected for a far-infrared rotational transition (Goldreich, 1975). Thus the population inversion will be destroyed by thermal collisions when the density is a few times cm-3. We note that the range of detected magnetic fields in our Zeeman pairs is a factor of 35 (0.6 to 21 mG), or roughly . If the scaling law applies throughout this entire range, this implies that the range of densities sampled by those masers in Zeeman pairs is a factor of , or about , assuming that the 21 mG magnetic field in W51 e2 is near the upper end of magnetic field strengths allowable before collisional depopulation of the upper state is significant.
The lack of Zeeman pairs below 0.5 mG may be an observational effect. For such small magnetic fields, the splitting is less than a typical line-width, and we make no attempt to identify Zeeman pairs less than 0.5 mG due to the difficulty of distinguishing small Zeeman shifts from other effects. For example, consider a right-elliptically polarized -component in a region where the magnetic field orientation varies along the amplification path, as in Figure 5. The linear component of the polarization will be seen as weak emission in LCP. If there is also a velocity gradient along the amplification path, the linear polarization component may be shifted in velocity with respect to the circular polarization component. This would manifest itself in our observations as a velocity difference between the lines seen in the two circularly-polarized feeds: the RCP feed would detect nearly all the emission, while the LCP feed would detect only the weaker, velocity-shifted linear component. For the parameters shown in Figure 5, the shift between LCP and RCP velocity corresponds to an apparent magnetic field strength of 0.1 mG at 1667 MHz in the Zeeman interpretation, although broader lines and more extreme variations of the linear polarization fraction across a linewidth can produce larger apparent shift between the components.


Figure 6 shows a histogram of the separation between the -components in each Zeeman pair for which the -component separation is less than cm. Zeeman pairs with larger separations are identified when unambiguous, but they have been excluded from the present consideration in order not to introduce bias. The rapid falloff of the number of pairs identified with increasing component separation suggests that the dearth of identifiable Zeeman pairs at larger separations is real. Note that Figure 6 has not been normalized by area; were it to be so normalized, it would fall even faster. If the distribution of Zeeman component separations were uniformly random, a plot of the unnormalized number of identifiable Zeeman components versus component separation would be an increasing function of separation (at least up to a distance beyond which pairing is no longer unambiguous). This is certainly not observed, providing further evidence that the cm clustering scale is a physically significant scale over which physical parameters are sufficiently coherent to provide an environment conducive to maser activity.
Thus it appears that the spatial separation of the -components in a Zeeman pair is generally a factor of several smaller than the size of the cluster containing the pair. Nevertheless, there are some pairs of maser spots polarized predominantly in opposite circular senses whose separation is comparable to or exceeds cm. It is possible that these are not true Zeeman pairs of -components from the same masing subregion but rather two oppositely-polarized -components from different Zeeman pairs, of which only one component is seen in each. Such a situation could arise if amplification at each maser site favors only one sense of circular polarization, as described below. The magnetic fields implied by these Zeeman “cousins” would be less accurate due to two effects. First, the systemic velocity at each maser site may be different due to turbulence. Reid et al. (1980) calculate that a typical intracluster turbulent velocity is 0.6 km s-1. This corresponds to an effective Zeeman splitting of 1.0 mG in the 1665 MHz transition and 1.7 mG in the 1667 MHz transition. Second, the magnetic field strength may be different at the maser sites. This difference is generally less than 1 mG (see §3.5). The magnetic field strengths implied by Zeeman cousins should therefore be accurate to better than 2 mG.

Figure 7 shows the ratio of the LCP and RCP fluxes for the -components in each Zeeman pair. We observe that this ratio occasionally reaches values near 100. This is probably not a hard upper limit but a result of observational constraints. Maser spots weaker than 50 to 100 mJy are too weak to be detected in our survey; maser spots stronger than 10 Jy are rare.

A simple test to determine whether our data have unknown systematics is to compare the number of Zeeman pairs with greater flux in the LCP and RCP components. There are 119 Zeeman pairs in the 1665 MHz transition and 65 in the 1667 MHz transition. The LCP component is stronger than the RCP in 69 of the 1665 MHz pairs and 44 of the 1667 MHz pairs. If Zeeman pairs with stronger LCP and RCP components are equally common, we would expect the number of Zeeman pairs in each polarization to be at 1665 MHz and at 1667 MHz222For a binomial distribution, , where is the sample size and and are the probabilities of each outcome ( and ).. The deviations from these values are not statistically significant. The ratio of intensities of the -components in a Zeeman pair does not appear to be substantially different for the 1665 and 1667 MHz transtions.
Figure 8 shows a histogram of the flux ratios of Zeeman components. There is not an appreciable difference between the 1665 and 1667 MHz transitions for flux ratios less than 10. The larger number of high flux ratios () for the 1665 MHz transition appears real, although it may partially be due to a selection effect. As Figure 9 shows, the brighter component in a typical 1665 MHz Zeeman pair is brighter than that of a 1667 MHz pair. The detection limit in our survey varies somewhat by source but is approximately 0.1 Jy. Thus, the identification of a Zeeman pair with flux ratio requires that the stronger component have a flux density higher than Jy. The relative scarcity of 1667 MHz Zeeman pairs with a flux ratio greater than 10 can be explaned by the paucity of Zeeman components with a flux density greater than 1 Jy. Only in one-third of cases does a 1667 MHz Zeeman pair include a component stronger than 1 Jy, while over half of 1665 MHz pairs include a component above this threshold. At higher flux density thresholds, the difference becomes more extreme.
The relative absence of 1667 MHz Zeeman pairs with large flux ratios, noted previously in W3(OH) (Wright, Gray, & Diamond, 2004), is consistent with the picture that maser transitions with smaller Zeeman splitting coefficients tend to have Zeeman pairs in which the -components are more equal in intensity (e.g., Moran et al., 1978; Caswell & Vaile, 1995). Cook (1966) theorized that correlated velocity and magnetic field gradients could be the cause of unequal spot intensities in Zeeman pairs. Deguchi & Watson (1986) argued that even absent a magnetic field gradient, a velocity gradient alone is sufficient to produce unequal intensities. Velocity gradients (either alone or in combination with magnetic field gradients) are less likely to disrupt amplification of only one of the -components of a Zeeman pair for the 1667 MHz transition than for the 1665 MHz transition. Measured line widths for maser spots at 1667 and 1665 MHz are similar, but the Zeeman splitting coefficient is smaller for the 1667 MHz transition than for the 1665 MHz transition. The magnetic field strength required to produce an effective velocity shift greater than the linewidth of a component is therefore greater for 1667 MHz masers than for 1665 MHz masers.


3.4 Maser Spot Statistics
We find a total of 342 spots stronger in RCP and 351 in LCP at 1665 MHz, as well as 178 in RCP and 185 in LCP at 1667 MHz. As expected, there does not appear to be a preference for masers to appear preferentially in one circular polarization than the other, though occasionally an individual source may have a preponderance of maser spots in one polarization, as is the case in W75 S, in which we find 35 RCP and 19 LCP spots in the 1665 MHz transition. For a source with 54 spots, we would expect spots in each polarization, so the deviation seen in W75 S is not significant.
There are nearly twice as many spots detected at 1665 MHz than at 1667 MHz, although one source (G40.6220.137 (catalog G40.622-0.137)) has one more spot in 1667 MHz than at 1665 MHz. This fits with theoretical modelling, which shows that while 1665 MHz and 1667 MHz masing often occur under the same physical conditions, the area of physical parameter space conducive to amplification is larger for 1665 MHz masers than for 1667 MHz masers (Cragg, Sobolev, & Godfrey, 2002).
3.5 Magnetic Field Structure
Magnetic fields as determined from Zeeman splitting of OH masers are predominantly ordered in massive SFRs (e.g., Baart & Cohen, 1985; García-Barreto et al., 1988). In all sources with the possible exception of G43.7960.127 (catalog G43.796-0.127), the line-of-sight direction of the magnetic field (i.e., either toward or away from the Sun) is either constant for all Zeeman pairs or shows only one organized reversal in which there exists a line that can be drawn that separates the side of the SFR where the magnetic field is positive from the side where it is negative.
The relative consistency of magnetic field strengths in clusters of OH masers argues in favor of an organized field structure. When multiple Zeeman pairs are seen in the same cluster, the range of field strengths is rarely greater than 2 mG (i.e., mG) and often significantly less. In no case does the sign of the magnetic field change between two Zeeman pairs in the same cluster of spots within cm. Figure 10 shows the fractional variation of magnetic field strength measurements in clusters compared with the source as a whole. The intracluster variation in the magnetic field strength is generally smaller than the intrasource variation. If variations in magnetic field strength are due to variations in density, this suggests that density fluctuations within a cluster may also be smaller than fluctuations on the scale of the masing region of a massive SFR.
Given the uniformity of magnetic field direction in the line-of-sight dimension, it is somewhat surprising that linear polarization vectors in the same cluster, when converted to magnetic field directions, are often quite disordered. Table 1 shows the relative variation of polarization position angle (PPA) as a function of maser spot separation. This statistic has a range of [0°,90°], since a PPA of angle is equivalent to one of angle and the difference cannot exceed . For pairwise separations shown in the first column of Table 1, the rms of the difference in PPA between the two maser spots was calculated. The statistic was applied only to spots with a linear polarization fraction less than 0.707 (equal parts linear and circular for a totally polarized maser). This is designed to choose only -components. Any statistic comparing the magnetic field direction at both - and -components would have to account for the natural difference arising from the PPAs of - and -components in the same magnetic field. A sample of maser spots with a uniform random distribution of PPAs would have an rms of . The rms value of the PPA difference between maser spots is roughly constant to within the errors for all maser spot separations. Even at the smallest scale ( cm) the rms in PPA differences is consistent with a random distribution. Given the regularity of magnetic field direction both on source and cluster scales, the PPA differences cannot be due to magnetic field variations within a cluster. Probably Faraday rotation is large enough in most sources, even on AU scales, to scramble the linear polarization directions. See §4.2 for further discussion of the possible effects of Faraday rotation.
| Separation | Number of | PPA | Standard |
|---|---|---|---|
| (cm) | PairsaaNumber of pairs of maser spots with linear polarization fractions less than that shown in the column headings such that the separation between the maser spots is less than that shown in the first column. | rms | ErrorbbStandard error of the mean: . |
| 0 — | 25 | ||
| — | 189 | ||
| — | 566 | ||
| — | 1707 |
Note. — Table of rms variations in the PPA between pairs of maser spots for all sources. Only pairs of spots whose linear polarization fraction is less than 0.707 are considered.

3.6 Relation of OH Masers to the H II Region
The association between OH masers and UCH II regions has been noted by many authors, including Dieter, Weaver, & Williams (1966) and Mezger & Höglund (1967). Our larger sample of OH masers mapped with milliarcsecond resolution allows us to confirm this finding. For each continuum source with nearby masers, we determined an ellipse whose major and minor axes best matched the overall extent of continuum emission (full width at zero power for a detection). The center of the H II region was taken to be the center of the ellipse, and the radius of the H II region was taken to be the geometric mean of the semi-major and semi-minor axes. The distance of each OH maser from the center of the H II region, in units of H II region radii, was computed. Two possible sources of error are the uncertainty in map registration between the OH masers and continuum images and the uncertainty in the assignment of the center of continuum emission in each source. The former is estimated to be () by Argon, Reid, & Menten (2000). The latter may vary depending on source structure. For a circular H II region, we estimate a 10% error, which would correspond to a error of for a typical UCH II region, resulting in a total error of for the combination of the two effects. For large (e.g., G5.8860.393 (catalog G5.886-0.393)) or irregularly-shaped (e.g., G35.5770.029 (catalog G35.577-0.029)) H II regions, the error in the estimate of the center of continuum emission may be slightly higher.
The distribution of the distance of OH masers, normalized by area, from the center of the H II region is shown in Figure 11. Masers in G9.6220.195 (catalog G9.622+0.195), G34.2570.154 (catalog G34.257+0.154), and Cep A (catalog ) were treated as containing three, two, and four continuum sources respectively, and masers distances were calculated from the nearest source. Several sources were excluded from this analysis because no nearby continuum source was detected: the northern grouping of G9.6220.195, G40.6220.137, S269 (catalog G196.454-01.677), Mon R2 (catalog ), and G351.7750.538 (catalog G351.775-0.538). Additionally, W75 N and the two southeastern continuum sources of Cep A were excluded since it is not always clear which of several continuum sources to associate a maser spot with.
Including ON 2 N (catalog Onsala 2N) and G40.6220.137, 50% of maser spots are located within 1.5 radii of a UCH II region; this number grows to 58% when these two sources are excluded. The distribution of maser spots in these two sources is clearly offset from the H II region, suggesting that the masers may be associated with a second, undetected continuum source nearby. The large peak near 0.5 H II region radii in Figure 11 is due mainly to the western cluster of maser spots in G5.8860.393. Overall, it appears that the distribution of OH masers peaks near the center of the H II region, consistent with Garay, Reid, & Moran (1985). The tail of the distribution of maser spots at several radii from the UCH II region may represent spots associated with another star, not with the nearest detectable continuum source, as in ON 2 N and W51 (e1 and e2).
These results are not consistent with a random distribution of OH maser spots within a shell around the H II region. A uniform random distribution would peak at a projected radius (in H II region radii). For density distributions falling off as or , the peak of the distribution will be at . In all cases, the distribution of OH masers would be expected to double across because masers located behind the H II region would be obscured by the UCH II region, which is optically thick at cm. We see no evidence for this discontinuity at 1 H II region radius in our data.
Figure 12 shows the distribution of projected linear distances of OH masers from the center of the associated UCH II region. 82% of maser spots are located within 13000 AU of the center of the H II region. Also shown is the assumed dynamical age of the masers for an expansion speed of 3 km s-1. This is consistent with the speed measured in W3(OH) from both proper motion of OH masers (Bloemhof, Reid, & Moran, 1992) and direct expansion of the UCH II itself (Kawamura & Masson, 1998). The dynamical age of most masers is less than yr.
While the number of OH maser spots cuts off at a dynamical age of several yr, individual OH masers do not appear to fade appreciably during this time. Figure 13 shows the relation of maser power per bandwidth (i.e., flux density normalized to a constant distance) to the separation between the UCH II region center and the masers. Figure 14 shows the mean power per bandwidth and standard error of the mean for the same data. The maser power per bandwidth appears to be constant with distance from the center of the H II region. If the distance of the masers from the H II region is indeed correlated with their age, OH masers do not become systemically brighter (or fainter) with age, at least not in the yr timescale our data span. Figure 15 shows the relation of maser power per bandwidth to the size of the associated UCH II region. Since H II regions undergo expansion, their size is a measure of the age of the system. Again, there does not appear to be a correlation between the maser power per bandwidth and the age of the system. However, we do not see any maser spots located more than 30000 AU (0.15 pc) from the center of the associated UCH II region (including G351.7750.538, for which the nearest UCH II region is several arcseconds away).
Habing & Israel (1979) have observed that OH masers are not seen around H II regions once they leave the ultracompact phase ( pc). Indeed, not only are OH masers not seen around “compact H II (CH II) regions” ( pc), they are not seen at comparable radii around ultracompact H II regions. The lack of OH masers at large distances from the associated ultracompact H II region was first noted by Habing et al. (1974), who suggested that OH maser phenomena disappear at a radius of 15000 AU (0.07 pc). Our larger sample size at much higher angular resolution indicates that there is a sharp cutoff at about twice this radius. It is possible that the physical conditions (such as temperature and density) responsible for maser activity do not exist at large radii. Alternatively, the ionization front catches up to the shock front as the H II region expands into an environment whose density decreases with radius, thereby destroying the OH masers, which are believed to exist in the region between the ionization and shock fronts (see §4.6).


3.7 Relation of OH Masers to the Surrounding Material
In order to interpret the bulk motions of OH masers, it is necessary to determine the velocity of the massive star or stars being formed. Frequently this is determined through hydrogen recombination line observations, which give information on the velocity of the ionized H II region surrounding the central star. But recombination lines are not well suited to the task. Recombination lines are subject to sometimes severe Doppler and impact broadening. Even at high frequency, different recombination lines can be biased by a few km s-1 (Berulis & Ershov, 1983; Sams, Moran, & Reid, 1996) due to differing optical depths in an expanding H II region.
We have observed the line of ammonia in order to provide a context for the OH maser observations. Reid, Myers, & Bieging (1987) argue, based on the similarity of distribution of NH3 absorption and OH maser emission in W3(OH), that the two species are found in the same clumps of material. The physical conditions they deduce from NH3 and observations are consistent with the physical conditions necessary for OH maser activity. Also, the velocity of peak absorption in NH3 closely matches the average velocity of the OH masers. Unfortunately, in many sources NH3 absorption is not clearly detected, and NH3 emission velocities must be used instead. NH3 emission is a less reliable indicator of the velocity of the central star, since emission usually traces motions on a larger scale (often ). In the region of W3(OH), ammonia emission velocities differ from the average OH maser velocity by approximately 4 km s-1 (Wilson, Gaume, & Johnston, 1993). It is possible that systemic biases of a few km s-1 are introduced using emission velocities, but there is no way to obtain the radial velocity of the star to greater accuracy.
The spectra in Figures 40 to 42 of Paper I are provided for regions of emission or absorption located roughly coincident with the extent of OH masers on the sky. It is important to remember that while OH masers exist primarily near a UCH II region, the neutral NH3 may exist at a wide range of radii. Thus the inferred NH3 velocities could in principle be affected by motion of material quite distant from the H II region. The NH3 velocity may be shifted from the rest velocity of the star by an amount comparable to the velocity dispersion of the molecular cloud. From the virial theorem, the velocity dispersion is
| (2) |
where is the gravitational constant, is the total mass, and is the radius of the sphere. For a cloud with and a radius of 0.1 pc, km s-1.
When the velocity of the nearby NH3 is measured, it generally falls toward the middle of the range of OH maser velocities, as shown in Figures 40 to 42 of Paper I. There are some minor exceptions to this rule. In G35.5770.029 and Mon R2, the NH3 velocity is near an extremum of OH maser velocities. (In ON 1 (catalog Onsala 1) the OH masers fall into two disjoint groups at km s-1 and km s-1, and NH3 emission detected in a broad region located 5″ to 30″ north of ON 1 (not shown in the panel) falls near 11 km s-1.)
Figure 16 shows a histogram of the differences between OH maser velocities and the adopted NH3 velocity for all sources having detected NH3. Of the 926 OH maser spots, 51.7% are blueshifted with respect to the NH3 velocity, and 48.3% are redshifted. The median velocity difference is km s-1 with an rms of km s-1, while half the differences fall within the range to km s-1. Since a zero difference falls comfortably within this range, we cannot confidently state that OH masers are consistently blueshifted or redshifted with respect to the surrounding material, as might be expected if a single type of motion, such as expansion or contraction, dominates OH maser kinematics. When only maser spots located within one projected H II region radius are considered (), the median velocity difference is km s-1 with an rms of km s-1 (Figure 17), with half the differences falling in the range to km s-1. In either case, there does not appear to be a detectable difference between the OH and NH3 velocities to within our errors. If expansion dominates the dynamics of the masing regions, the masers projected atop the UCH II region (and therefore in front of it, since UCH II regions are in general optically thick at cm) should be blueshifted with respect to the large-scale ambient material. However, the opposite appeared to be true of W3(OH) (Reid et al., 1980), although later proper motion measurements of the OH masers definitively established that they are expanding (Bloemhof, Reid, & Moran, 1992). It is worth pointing out however that in G43.7960.127, where nearly all of the masers are projected against the UCH II region, the OH masers are preferentially blueshifted with respect to the NH3 emission, mildly suggestive of expansion.
Because of the aforementioned possibility of systemic errors of a few km s-1 in determining the radial velocity of the central star from NH3 velocity measurements, we cannot identify whether a single type of motion, such as gravitational infall or slow expansion, dominates the kinematics of OH masers in massive star-forming regions. We can in general rule out kinematic modes in which the OH masers would be moving at tens of km s-1 or more, such as a freely expanding H II region at km s-1.


4 Discussion
4.1 Saturation
Interstellar OH masers are most likely saturated (Reid et al., 1980). The saturation temperature, , for OH masers is given by
| (3) |
(Reid & Moran, 1988), where is the Einstein coefficient, is the decay rate, and is the solid angle of beaming. For = 0.03 s-1 as typical for a far-infrared rotational transition likely pumping the maser, the saturation temperature is K. The most compact maser component from the space-VLBI observation of G34.2570.154 by Slysh, Voronkov, & Val’tts (2002) has a beaming angle , which corresponds to a maximum saturation temperature K. For the most part, the brightness temperatures () listed in Tables 2 through 20 of Paper I are below this value. But these are apparent brightness temperatures calculated from the undeconvolved spot size, which are likely scatter broadened for most sources.
Many of our spots appear to be partially resolved, as shown in Table 2. However, several caveats apply to the deconvolved spot parameters. First, the measured spot size may be larger than the physical spot size due to interstellar scattering. Second, large deconvolved spot sizes may be the result of misidentifying spatially blended maser spots as a single spot. Third, determining the deconvolved spot size of a small maser spot is less accurate than for a large maser spot, because the deconvolved spot size is obtained from differencing two larger numbers (the squares of the undeconvolved spot size and the beam size). The net of all three effects is that maser spot sizes are probably smaller than that calculated from deconvolution, and that the overestimation may be greater for heavily scatter-broadened sources. Even a deconvolved spot size would underestimate the actual by the square of the ratio of the apparent spot size to the unbroadened spot size.
For a typical FWHM spot size of 3 mas in W75 N (which has very little scatter broadening), K. This corresponds to a flux density of , where is the solid angle subtended by the maser spot. Taking sr, the saturation value erg cm-2 s-1 Hz-1 sr-1, or 0.07 Jy. This is near our detection limit, so nearly all spots that we detect are partially saturated if the spot sizes for W75 N are typical.
| Distance | Number of | Median Deconvolved | 90% Range of Spot Sizes | ||
|---|---|---|---|---|---|
| Source | (kpc) | Spots | Spot Size (mas) | Min (mas) | Max (mas) |
| G5.8860.393 | 3.8 | 98 | 19.66 | 12.44 | 30.33 |
| G9.6220.195 | 5.7 | 38 | 16.44 | 10.86 | 21.05 |
| G10.6240.385 | 4.8 | 14 | 23.55 | 19.48 | 28.96 |
| G34.2570.154 | 3.8 | 88 | 5.46 | 0.00 | 13.50 |
| G35.5770.029 | 10.5 | 15 | 16.22 | 12.39 | 19.55 |
| G40.6220.137 | 2.2 | 39 | 19.68 | 15.57 | 24.22 |
| G43.7960.127 | 9.0 | 60 | 7.96 | 0.00 | 13.11 |
| W51 e1 | 7.0 | 97 | 10.51 | 6.62 | 20.07 |
| W51 e2 | 7.0 | 94 | 9.53 | 5.19 | 15.23 |
| ON 1 | 3.0 | 49 | 2.68 | 0.00 | 7.30 |
| K350 | 8.7 | 17 | 31.46 | 23.45 | 34.82 |
| ON 2 N | 5.6 | 73 | 25.29 | 13.69 | 37.11 |
| W75 S | 2.0 | 65 | 4.17 | 1.57 | 7.75 |
| W75 N | 2.0 | 120 | 3.14 | 0.00 | 8.90 |
| Cep A | 0.7 | 62 | 6.77 | 1.95 | 12.96 |
| NGC 7538 | 2.8 | 30 | 6.83 | 3.19 | 11.20 |
| S269 | 3.8 | 19 | 6.08 | 1.23 | 9.47 |
| Mon R2 | 0.9 | 27 | 7.86 | 2.20 | 13.49 |
| G351.7750.538 | 2.2 | 50 | 67.40 | 45.35 | 76.07 |
Note. — Spot sizes may be overestimates. See §4.1 for details.
4.2 Faraday Rotation
Faraday rotation can complicate the interpretation of linear polarization in two ways. First, external Faraday rotation between a maser and the observer will cause the polarization position angle (PPA) of linear polarization to rotate, making interpretation of the magnetic field direction on the plane of the sky more difficult. Second, internal Faraday rotation along the amplification path may decrease the linear polarization fraction of the radiation, completely circularizing it if the Faraday rotation is strong enough (Goldreich, Keeley, & Kwan, 1973a). Since this also reduces the effective gain length for linear polarization, Faraday rotation may also prevent otherwise highly linearly-polarized maser components from being amplified to the limits of detectability. Thus, spots with a large linear polarization fraction (e.g., -components and -components where the magnetic field is near the plane of the sky) may be suppressed relative to spots with a small linear polarization fraction (e.g., -components where the magnetic field is directed along the line of sight).
External Faraday rotation in the interstellar medium between a maser and the observer would cause a rotation of the PPA of the linear polarization of each spot, given by
| (4) |
where RM is the rotation measure in rad m-2, in cm-3, is the component of the magnetic field parallel to the direction of propagation in G, and in is the differential path length along the line of sight in pc (Thompson, Moran, & Swenson, 2001). In some regions, such as the northern cluster in W75 N, the linear polarization vectors are predominantly aligned along the line of maser spots (see §3.1). An RM of about 10 rad m-2 would produce a rotation of the PPAs in a source of . A rotation of the polarization vectors by an amount greater than this would cause the vectors to no longer appear to be aligned with larger structures, unless the rotation was near a multiple of . According to the ATNF Pulsar Catalogue (Manchester et al., 2005)333The catalogue is available online at http://www.atnf.csiro.au/research/pulsar/psrcat ., the only pulsar with known rotation measure located within of W75 N at comparable heliocentric distance is B2021+51, for which the RM is rad m-2 (Manchester, 1972).
Internal Faraday rotation over the region of amplification may destroy linear polarization in both - and -components, possibly suppressing -components altogether. The Faraday rotation over a region with average electron density and parallel magnetic field strength is
| (5) |
where is the wavelength of the transition. For a typical ground-state ( cm) OH maser, mG. The effective amplification length is likely to be less than the clustering scale due to velocity coherence. A crude estimate is that , where cm is the diameter of the masing cloud, km s-1 is a typical maser line width, and km s-1 is a reasonable velocity shift across the cloud based on observations of W3(OH) (Reid et al., 1980) and theoretical modelling (Pavlakis & Kylafis, 1996). Thus, for an effective amplification length cm, an electron density of about 300 cm-3 would be sufficient to produce a rotation of along the path of amplification. For H2 densities of to as is typical in OH masing regions (Cragg, Sobolev, & Godfrey, 2002), this would require a fractional ionization () of to . This is higher than the ionization rate that would be expected from cosmic-ray ionization alone (Shu, 1992), but consistent with the that occurs in the C II regions around H II regions where OH masers may exist (Sternberg & Dalgarno, 1995; García-Barreto et al., 1988). Ionized carbon and to a lesser extent sulfur may play an important role in producing free electrons, due to their abundance and ease of photoionization. While the hydrogen in the H II region absorbs all the ultraviolet photons with energies greater than 13.6 eV, many softer photons pass through undisturbed. Sternberg & Dalgarno (1995) calculate that the ionization fraction may be slightly greater than in the C II region, located around the H II region, and about in the S II region, in turn located around the C II region. Based on their models of photon-dominated regions as well as the locations of OH maser spots just outside H II regions, it is likely that they exist near or embedded in the C II regions.
We can form a consistent picture of linear polarization in OH masers if the amount of Faraday rotation in a typical maser source is near a critical point, i.e., such that the product several cm-2 mG. Based on maser line widths and brightness temperatures, the amplification length is typically at least 20 unsaturated gain lengths and probably greater for highly saturated masers (Reid & Moran, 1988). A typical maser spot has a significant amount ( rad) of Faraday rotation over the amplification length but a small amount ( rad) over a single gain length. In this case, some linear polarization will survive amplification, but Faraday rotation scrambles the PPA of the linear polarization, so it will not be simply interpretable as a magnetic field direction. If the Faraday rotation is a factor of smaller, the Faraday rotation over the amplification length will be small, so high linear polarization fractions may be observed, and the PPA may still be correlated with the magnetic field direction. On the other hand, if the Faraday rotation is a factor of larger, the Faraday rotation over a gain length can be large, and linear polarization fractions will approach zero (Goldreich, Keeley, & Kwan, 1973a). In cases where the Faraday rotation per gain length is significant, interpretation of the PPA will be difficult because maser amplification will stimulate emission in the orthogonal linear mode as well (Melrose & Judge, 2004). Significant generalized Faraday rotation may also circularize -components.
An example of a source with small internal Faraday rotation over the entire amplification length is W75 N, in which -components are detected in abundance, especially in the northernmost group of maser spots (see §3.1). As Figure 2 shows, - and -components are easily identifiable in this group based on the PPA of the linear polarization. It is interesting to note that modelling of the OH masers in W75 N by Gray, Hutawarakorn, & Cohen (2003) indicates that the maser amplification length is several orders of magnitude smaller than that typically assumed in other sources, although the density is also higher. For the range of ionization fractions given above, the resulting Faraday rotation would be less than 1 radian over the amplification length.
At the other extreme is W51 e1 and e2, in which practically no linear polarization whatsoever is detected. This is consistent with significant Faraday rotation along a gain length, which would suppress the amplification of -components and circularize the otherwise elliptically-polarized -components. Such Faraday depolarization may also explain certain maser features that are seen with similar flux densities in RCP and LCP but without any detected linear polarization, such as spots 18, 24, and 36 in Table 9 of Paper I. It is highly unlikely that the lack of linear polarization in W51 can be due to chance alignments of the magnetic field in an extremely narrow cone oriented toward or away from us at each maser site, producing -components that are purely circularly polarized, because the magnetic field is seen to reverse line-of-sight direction across the source. Thus, the inclination of the magnetic field to the line of sight must take on values intermediate to the and required for pure-circular masers in the absence of Faraday rotation.
A medium range of Faraday rotation would be enough to partially (but not totally) circularize -components. The observed circular polarization fraction will in general be a complicated function of the electron density, maser gain length, and angle of propagation with respect to the magnetic field direction, but the presence of Faraday rotation will strictly increase the circular polarization fraction compared to the case in which no Faraday rotation is present (Field & Gray, 1994). Straightforward application of equation (50) of Goldreich, Keeley, & Kwan (1973a) without accounting for Faraday rotation will cause the inclination of the magnetic field to the line of sight to be underestimated.
Faraday rotation may also explain why linear polarization vectors appear to be disorganized in some sources. If a large electron density is required for Faraday rotation along the amplification path in the interior of a masing cloud, it is likely that the electron density is high exterior to the masing cloud as well. This would rotate the apparent PPA of the maser emission. Fluctuations in the electron density, possibly caused by density inhomogeneities or anisotropy of the ionizing radiation field, could cause emission from adjacent maser spots to be Faraday rotated by different amounts. If this is indeed the case, reconstructing the magnetic field orientation in the plane of the sky is a difficult task, and reconstructing the full three-dimensional orientation of the magnetic field may be nearly impossible.
Scatter broadening of some sources implies strong density fluctuations and a high column density of electrons along the radiation propagation path. Since the scatter broadening is proportional to the distance between the source and the scattering screen (e.g., Boyd & Werner, 1972), a screen of electrons near the source is unlikely to increase the angular size as much as a cloud of electrons several kiloparsecs away in the Galactic plane. The lack of correlation between scattered size and Faraday depolarization provides further evidence that the scattering is external to the masing regions. W51 is not a particularly scatter-broadened source, yet essentially no linear polarization is detected. G351.7780.538 is heavily scatter-broadened, but several spots with a high degree of linear polarization are seen. Figure 18 shows a plot of the linear polarization fraction as a function of spot size for all sources combined. There does not appear to be a correlation of the linear fraction with the size of the observed maser spots. This suggests that the electron screen responsible for scattering is Galactic in origin.

4.3 Total Polarization
Of the maser spots in our sample, 97% are at least 75% polarized. Although Tables 2 to 20 of Paper I do not list the total polarization fraction explicitly, it can be approximated by noting that the total polarization fraction is , where and are the Stokes parameters. Stokes and can be obtained from the sum and difference, respectively, of the listed RCP and LCP flux densities of spots, and the linear flux density gives . In 86% of the maser spots, LCP and RCP fluxes are not both detected, implying that the spot is circularly polarized to the limits of detectability. For other spots, frequently , indicating that many spots are nearly 100% polarized, as shown in Figure 19. A portion of the discrepancy from equality in the above equation can be explained by a variety of factors. As can be seen in Tables 2 to 20 of Paper I, when the same maser spot is seen in both RCP and LCP emission, the position and velocity of the peak emission may be slightly different in both. Blending of strong adjacent maser spots can also make determination of fit parameters difficult. Furthermore, the linear polarization fraction of a maser spot may vary across a spot size.
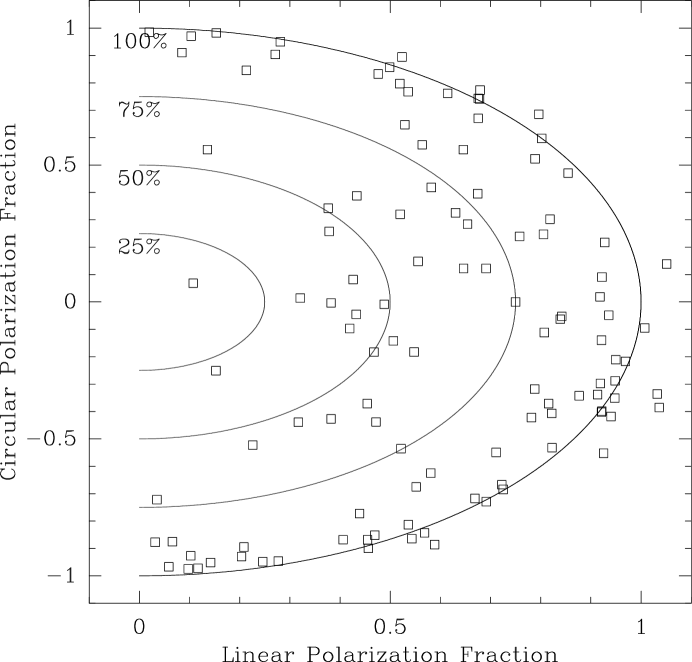
Nevertheless, there are certainly spots that appear to be only partially polarized (Figure 19). Unpolarized emission () would appear as equal flux densities in the LCP and RCP feeds with no detectable linear polarization. In W51 e1, for example, there are a number of maser spots where the LCP and RCP flux densities are nearly equal and centered at roughly the same position and velocity. Since there is nearly no detected linear polarization in the OH masers in this source, it is possible that these maser spots are only partially polarized. These maser spots could also be produced by masing in sites where the magnetic field splitting is small compared to the line width (Goldreich, Keeley, & Kwan, 1973a). Our data do not provide sufficient resolution to tell whether the spots with roughly equal RCP and LCP fluxes are due to two 100% polarized spots that are at slightly different positions and velocities or whether they are due to a single spot that is not 100% polarized.
4.4 Overlap of Masing Clumps
Theoretically, -components are favored for magnetic fields inclined to the line of sight (Goldreich, Keeley, & Kwan, 1973b; Gray & Field, 1995) and -components are favored for smaller angles. Consider an ensemble of maser sites, each threaded by an independent, randomly-oriented magnetic field. The fraction of maser sites for which amplification of -components is favored is
| (6) |
where the factor of two accounts for the possibilities of the magnetic field being oriented toward or away from the observer. Accounting for the fact that two -components are produced for each -component by Zeeman splitting, -components would comprise of total maser spots.
As discussed in §3.5, the magnetic field in any individual source is highly ordered, and the distribution of magnetic field orientations at maser sites is not oriented in a uniformly random direction. But for a large sample of sources distributed throughout the Galactic plane, it is plausible that the range of magnetic field directions sampled will approach a uniform random sample. However, in our sample a large majority of maser spots have a small or zero linear polarization fraction. Two-thirds of maser spots have no detectable linear polarization at all. As discussed in §4.2, amplification of -components may be reduced by Faraday rotation along the amplification path. Two additional effects pointed out by Elitzur (1996) may explain the larger fraction of -components we detect. First, although an inclination of divides angular phase space into two distinct regions in which - and -components dominate, the relative amplification of - and -components is larger for , where -components dominate, than for , where -components dominate. In the unsaturated regime, the ratio of the absorption coefficients for - and -components, , reaches a minimum of 0.5 at . For comparison, reaches a value of 2 at and grows in an unbounded manner as (see §3 of Elitzur). Unsaturated -components should on average be weaker than unsaturated -components, so the percentage of -components above a reasonable detection threshold would be higher than the 60% expected based on an analysis of the sizes of angular phase space alone. Second, as masers saturate, competitive gain will favor the stronger component. Saturated -components will reduce the absorption coefficient by a factor of 3, but saturated -components only reduce by a factor of 2 (Elitzur, 1996). Thus, -components should be even more numerous than -components even if the masers are saturated.
However, it is clear that some -components are seen in the maser transitions. Some maser spots exhibit a high degree of linear polarization as would be expected for -components, and the distribution of PPA in some sources strongly suggests that -components are seen (see §A.13). Nevertheless, maser spots that we believe are -components are not 100% linearly polarized. Since radiation is inherently linearly polarized, circular polarization must be generated externally. We speculate that these -components with nonzero circular polarization arise from the superposition of two masing clumps along the line of sight. If the emission from a -component spot intersects a region of OH appropriately shifted in velocity, it may stimulate emission in a mode. Since the incident radiation from the first cloud (i.e., the -component) is highly amplified and therefore bright, it can strongly stimulate the second cloud, since the incident linear polarization will be seen by the second cloud as a superposition of the two opposite-handed circular modes. Even if the amplification in the second cloud is very weak, a significant amount of circular polarization can be added, and the radiation will no longer be completely linearly polarized, as shown in Appendix B. The distinction between a - and a -component may be blurred if there is gain length of material in the second cloud.
This circularization of a bright -component due to an extremely weak -component requires that the weak cloudlet be in front of the bright maser from the observer’s perspective. If the -component is behind the -component, the propagation path of radiation passes first through the weak () cloudlet and then through the strong -component. The radiation field that the cloudlet amplifies, whether background continuum or its own spontaneous emission, is much weaker than in the case where the radiation from the -component stimulates emission from the -component, so the superposition of spots would be indistinguishable from an isolated -component with no surrounding material.
In principle the reverse scenario could occur as well: a -component stimulates emission in the -mode from a smaller cloud of OH gas at the appropriate velocity for amplification. This would have the effect of adding extra linear polarization to a -component. Since -components are in general elliptically polarized (i.e., have a nonzero linear polarization fraction), it may not be possible to distinguish observationally between a -component that has stimulated weak emission in the -mode from a second maser clump and one that has not. The linear polarization fraction of a -component is a function of the inclination of the magnetic field to the line of sight (Goldreich, Keeley, & Kwan, 1973a), so this effect could lead to overestimation of the magnetic field inclination at OH maser sites.
It is probable that the overlap of maser components along the line of sight would add circular polarization to -components more systemically than it would add linear polarization to -components. For most common bulk material motions (e.g., infall, outflow, rotation), the radial component of the velocity field will change monotonically along a ray from a maser spot to the observer. If the change in radial velocity along the line of sight exceeds the Zeeman splitting between a - and -component (1.2 km s-1 at 1665 MHz and 0.7 km s-1 at 1667 MHz for a 4 mG magnetic field), the radiation from the -component may stimulate weak amplification from OH in a mode. But a -component could only stimulate emission from the mode of a cloud of OH along the line of sight if the change in radial velocity were in the same sense as the Zeeman splitting of the -component.
Given that only a small column density of OH along the line of sight between a maser and the observer is required to add significant circular polarization to the observed maser, it is likely that a large fraction of -components will be misidentified as -components. Unless there is an abrupt outer edge to the radial distribution of OH in a massive star-forming region, the radiation from many -components will stimulate weak emission in a -mode of the surrounding OH.
4.5 Elongated Arrangements of Maser Spots
In several sources, OH masers are found in elongated filamentary arrangements. For instance, there is a line of maser spots near the origin in the W75 S map shown in Figure 25 of Paper I, and the masers in W75 N (Figure 27 of Paper I) appear to be oriented primarily along two perpendicular axes. In the filamentary arrangement of maser spots seen in the northern grouping of W75 N, the sky projection of the magnetic field as deduced from the PPA of the linear portion of the polarization implies that the magnetic field may be aligned predominantly along the line of elongation.
Often there is a velocity gradient along the elongation, such as in W75 S or the masers in a NE/SW line in ON 2 N. These lines of masers with velocity gradients are common in CH3OH. Norris et al. (1993) observed 10 sources for which the maser spots were distributed mostly in a line with the major axis of the distribution several times greater than the minor axis. Plots of the velocity of the maser spots versus the major axis offset are generally distributed into two quadrants rather than tightly along a straight line (Norris et al., 1998). The authors speculated that the masers are tracing circumstellar disks and that the deviation from a straight line in the velocity-major axis plots is due to maser amplification at different radii in the same circumstellar disk.
More recent observations do not seem to favor the interpretation of these maser arrangements as circumstellar disks, however. First, De Buizer (2003) looked for H2 S(1) emission in massive SFRs for which circumstellar disks were suspected on the basis of collinear444We will refer to structures of maser spots aligned along the same line as collinear to avoid any possible confusion with linear polarization. distributions of methanol masers. Since molecular hydrogen is a diagnostic of shocked outflows, it was expected that the H2 emission would be oriented primarily perpendicular to the putative disks. Instead, the H2 emission in almost all of the sources for which it was detected was preferentially oriented parallel to the line of methanol masers. De Buizer suggested that the masers were instead tracing an outflow. Second, the proper motions of maser spots in the two linear structures in G9.620.20 are directed primarily perpendicular to the structures Minier et al. (2001). This suggests that in at least some cases methanol masers may trace shocks rather than circumstellar disks. Whether this applies to similar arrangements of OH masers is not yet well established. It is believed that the lifetimes of methanol and hydroxyl masers overlap but are not identical (Reid, 2002). It is therefore possible that structures delineated by OH masers trace a different evolutionary phase of forming high-mass stars than do CH3OH masers.
An alternate possibility to the disk hypothesis is that these elongated arrangements of maser spots may simply be a result of the motion of material threaded by magnetic fields. This could be a result of 1) collapse in the early stages of star formation or 2) shock-driven outflows in later stages. In case 1), as clouds of OH and other material fall inward, they will draw the magnetic field inward with them. This will tend to align field lines with the material elongations, provided there is enough angular momentum to avoid spherical collapse. In case 2), a shock propagating outward from the boundary of the UCH II region compresses material ahead of it, leading to elongations along the shock front.
The drift speed for ambipolar diffusion of a magnetic field out of a maser cloud is
| (7) |
where is the radius of a maser spot, is the ion-neutral collision rate coefficient, and is the ionization fraction (Black & Hartquist, 1979). The drift speed is less than a typical shock speed ( km s-1), especially if carbon is ionized in any substantial fraction. Thus, the magnetic field will be dragged along and compressed by the shock, resulting in a field oriented parallel to the shock front and therefore along the material elongation. Unless the shock is totally planar, there may be velocity gradients along the elongations. The slight curvature to some of these elongations may also be explained by the expansion of a spherical shock front or a planar shock into an inhomogeneous medium. This is in contrast to models explaining elongated arrangements of maser spots as disks, where little curvature would be expected if preferentially seen edge-on. Nevertheless, some curvature along the elongations may be produced if a disk is inclined.
4.6 Is There a Connection Between Maser Clusters and Shocks?
As mentioned in §3.2, there is a characteristic maser clumping scale of cm. Additionally, maser clusters tend to be concentrated on or near the periphery of H II regions. This is not always the case in complicated sources such as W75 N, but more often than not these maser clusters appear near the boundary of an H II region, especially given that we observe three-dimensional distributions of masers in projection. Occasionally even individual clusters are elongated in a filamentary manner, as in W3(OH) (Reid et al., 1980).
It is possible that these clusters of OH masers form in shocked neutral gas outside the ionization boundary. The initial growth phase of a UCH II region involves an -type ionization front (see, e.g., Kahn, 1954). When the speed of the ionization front slows to twice the sound speed of the ionized material, a transition occurs and the ionization front changes to a weak -type (Shu, 1992). This is characterized by the existence of two separate fronts: an ionization (I) front and a shock (S) front that precedes it. Kawamura & Masson (1998) directly measured the expansion speed of the UCH II region, i.e., the I front, in W3(OH) to be km s-1. Since the speed of the I front is less than the sound speed in the ionized material ( km s-1), the ionization front must be of -type in W3(OH).
Others have theorized that masers near a UCH II region appear in the shocked neutral material between the I and S fronts (e.g., Baldwin, Harris, & Ryle, 1973; Elitzur & de Jong, 1978). Theoretical calculations suggest that I-S fronts are inherently prone to instabilities (Vandervoort, 1962). Less clear is the exact mechanism of instability growth, although there is no shortage of candidates (Dyson et al., 2002). Giuliani (1979) found that the slab of material between the I and S fronts was unstable to oscillatory transverse perturbations. The wavelength of fastest perturbation growth was found to increase with time. Vishniac (1983) obtained similar results and additionally suggested that unstable small-scale fragmentation would eventually allow neutral gas to be swept up behind the fragments and lead to Rayleigh-Taylor instabilities, although it is unclear whether this would occur at the time and size scales of ultracompact H II regions. Pottasch (1958) argued based on the evolutionary sequence of perturbation shapes of the bright rims in diffuse nebulae that the Rayleigh-Taylor instability alone cannot be the cause of fingering, although his analysis was based on older, lower-density H II regions. Vishniac also speculated that magnetic fields might produce elongated, filamentary structures. Two-dimensional simulations by García-Segura & Franco (1996) demonstrate the appearance of this hydrodynamical instability regardless of the density structure of the neutral gas and details of the radiative cooling law included. The wavelength of the fastest-growing perturbations increases with time, with interfragment spacings on the order of several times 100 AU near the base of the fingers and approximately 100 AU near the tips for UCH II ages near years, as shown graphically in their Figure 6. Note that this is consistent with both the clustering scale and the dynamical age of OH masers, as discussed in §§3.2 and 3.6.
Assuming that some clusters near UCH II regions form in the shocked neutral medium between the I and S fronts, two projection-related factors would imply that clusters should be more frequently found at the periphery of H II regions rather than atop them, an effect not seen (see §3.6). First, velocity gradients are likely to be higher along the fingers of shocked neutral material than across them. Amplification lengths should therefore be longer on average for fingers pointing in the plane of the sky, where the velocity gradient is tangential in projection, than for fingers pointing toward us (i.e., projected near the center of the H II region). Still, potential path lengths are longer along fingers rather than across them, and it is unclear whether velocity gradients are large enough to favor amplification across rather than along the fingers. Second, the magnetic field threading the neutral material will be dragged along with it. Field lines will be folded such that a field line entering the finger from the neutral material will exit the finger back into the neutral material after bending through . This would imply an effective reversal of the line-of-sight direction for lines of sight along fingers. However, intra-cluster magnetic field line reversals are never seen. Indeed, the magnetic fields deduced from OH maser in clusters superposed atop H II regions in ON 1 and W3(OH) suggest that there is a consistent line-of-sight field direction in those sources even atop the H II region. It is possible that OH masing clumps occur near the “palms” of the fingers or that the fingers of neutral material containing the OH masers are not very long. In either case, the bend in the magnetic field lines could be much less than , consistent with our lack of detection of line-of-sight field reversals in these clusters.
Large-scale ( AU) collinear maser structures, such as the NE/SW line in ON 2 N, probably cannot be explained by shock instabilities around the UCH II region because they are larger in scale than the H II region itself. It is still possible that these structures occur in neutral gas that has been shocked by another source in the star-forming complex. There is often a velocity gradient along these structures, which could be explained by a curved or decelerating shock.
4.7 Relation of OH Masers to Galactic Magnetic Fields
Noting that line-of-sight directions obtained from Zeeman splitting in eight Galactic OH maser sources were consistent with a clockwise Galactic field, Davies (1974) postulated that OH masers in massive star-forming regions traced the Galactic magnetic field. Follow-up studies by Reid & Silverstein (1990) and Reid & Menten (1993) supported this claim but were suggestive of a more complicated Galactic field structure. Subsequent analyses employing this technique on ever-larger sample sizes have indicated that correlations with the Galactic magnetic field may exist (Baudry et al., 1997; Fish et al., 2003), but detailed probing of the Galactic field with this method remains elusive. Observational limitations of this method consist of unknown distances to many of the sources as well as possibly incorrect magnetic field data resulting from inadequate spatial resolution to unambiguously identify Zeeman pairs of maser features, since few sources have been observed at VLBI resolution. Additionally, magnetic field information has thus far been limited to the sign of the line-of-sight field orientation (i.e, whether the magnetic field points in the hemisphere toward or away from the Sun). This may be insufficient to accurately probe a predominantly toroidal Galactic magnetic field at lower Galactic longitudes, in the direction of the majority of massive star-forming regions (as well as most of the spiral structure of the Galaxy).
If the magnetic field orientation in massive star-forming regions is correlated with the Galactic field, the processes of high-mass star formation must not tightly wrap the magnetic field configuration despite the rotation and collapse necessary to produce the central condensation, a proposition for which there is theoretical support (e.g., Li & Shu, 1996; Allen, Li, & Shu, 2003). As discussed in §3.5, an ordered magnetic field can be inferred from the regularity of the line-of-sight direction of the magnetic field over large portions of the source and the field strengths inferred from Zeeman pairs within the same clusters of cm. Furthermore, the magnetic fields deduced from OH Zeeman splitting in massive SFRs separated by distances on the order of a kiloparsec show a preference to be co-aligned (Fish et al., 2002). A numerical investigation of the collapse of rotating, magnetized, isothermal cloud cores suggests that collapse can occur without introducing a significant twist to the magnetic field (Allen, Li, & Shu, 2003). These authors find that the maximum pitch angle of the magnetic field is approximately along a ridge of accreting material (see their Figure 4). Inward from this ridge the magnetic field resists wrapping, while outward from the ridge the wrap from differential rotation is small. Simulations by Matsumoto & Tomisaka (2004) confirm that the magnetic field of a collapsing core maintains alignment with the magnetic field of the parent cloud. They find that a young star’s magnetic field is inclined no more than 30° from that of the parent cloud for a weak initial field strength (G at a density of cm-3), with much better alignment when the initial field strength is greater.
If these models are correct, the magnetic field orientation before collapse might be partially preserved in the material surrounding the core. Since the fields around newly-formed massive stars are ordered (see §3.5), this suggests that magnetic field orientations deduced from OH maser Zeeman splitting may be indicative of the Galactic magnetic field. A VLBI survey of OH masers in massive star-forming regions would eliminate Zeeman pairing ambiguity and possibly allow for three-dimensional modelling of the ambient magnetic field in the few sources in which the Faraday rotation is small enough that the full magnetic field orientation can be inferred from the observed linear polarization fraction and PPA of maser spots. If accurate distances can be obtained as well, as through trigonometric parallaxes of higher frequency maser transitions, OH masers may prove to be a useful tool for probing the Galactic magnetic field.
5 Summary of Interstellar OH Maser Properties
-
•
Ground-state OH masers typically cluster on a scale of cm, providing evidence that their distribution is linked to a process with an inherent scale, as opposed to turbulence (which is generally scale-free). The magnetic field strengths implied by Zeeman splitting suggest that OH masers occur in regions of density to several cm-3. OH masers are found preferentially near the UCH II region in massive SFRs. Their distribution around UCH II regions suggest an expansion age of years for typical expansion velocities. OH masers do not appear to be systemically shifted from the velocity of the associated star by more than a few km s-1, although possible exceptions exist, as in G5.8860.393 and W75 N VLA 2. Taken together, these pieces of evidence support the theory that most OH masers occur in the shocked neutral gas between the ionization and shock fronts of UCH II regions. The distribution of maser fluxes with distance from the central UCH II region suggests that OH masers turn off abruptly rather than weakening gradually after years.
-
•
Some OH masers are seen far from or without any associated H II region. It is unclear whether these masers are pumped by a star with an associated weak, undetected hypercompact H II region or whether they are shock-excited without an ionization front. In some sources (e.g., W75 S (catalog W75S)), OH masers appear to trace a collinear structure with a velocity gradient. These formations probably trace shock fronts rather than protostellar disks.
-
•
Magnetic fields are ordered in massive SFRs, lending observational support to theories that indicate that the ambient magnetic field direction may be preserved during massive star formation. Nearly all sources show either a consistent line-of-sight magnetic field direction or a single reversal of the line-of-sight direction across the source. Within a maser cluster of size cm, line-of-sight magnetic field direction reversals are never seen, and the field strengths deduced from Zeeman splitting are almost always consistent within mG.
-
•
We do see both - and -components, including a “Zeeman triplet” in W75 N (see §3.1). But OH maser spots that are 100% linearly polarized, as theoretically expected of -components, are extremely rare. There is a range of sources with qualitatively different linear polarization properties. At one extreme (as in W75 N) high linear polarization fractions are seen, and the PPAs show some correlation with observed structures and probable magnetic field directions. In most sources the linear polarization fractions are much less than 1 and PPAs cannot be easily interpreted as magnetic field directions. At the other extreme are sources such as W51 e1 and e2, in which little or no linear polarization is detected and the total polarization fraction of some maser spots is much less than unity.
-
•
The wide range of polarization properties observed in OH masers may be explained by a combination of Faraday rotation and overlap of maser components. If OH masers are indeed near or embedded in C II regions, the electron density may be high enough that the masers are near a critical point of Faraday rotation. A typical maser spot likely has large ( rad) Faraday rotation over the entire amplification length, but not over a single gain length of the maser. If Faraday rotation is a factor of lower, the total Faraday rotation along the amplification path may be small enough such that the PPAs are still roughly aligned with the magnetic field lines. On the other hand, if Faraday rotation is a factor of larger, the Faraday rotation per gain length could exceed 1 rad, destroying linear polarization and depolarizing the maser. Even if the Faraday rotation is small enough to allow amplification of a 100% linearly polarized -component, its polarization may be partially circularized by one of the -modes of a weakly-inverted clump of OH between the maser site and the observer. This is likely a very important effect, as only a modest inversion and a small column density of OH are required to add significant circular polarization to a -component.
-
•
Theoretically the linear polarization fractions and directions of maser components can be used to determine the full, three-dimensional orientation of the magnetic field at masing sites. But the interpretation of PPAs may be very difficult in sources for which the amount of Faraday rotation along the propagation path between the source and the observer is unknown. Inferring a magnetic field orientation in the plane of the sky also requires unambiguous identification of - and -components, due to the difference in PPA response to a magnetic field. Zeeman pairs provide the surest method of identifying -components, but their polarization properties may be too contaminated by internal Faraday rotation and maser overlap to permit interpretation of the inclination of the magnetic field to the line of sight.
Appendix A Notes on Individual Sources
A.1 G5.8860.393
There is a reversal of the line-of-sight direction of the magnetic field across the source. All Zeeman pairs in the south of the source indicate a negative magnetic field (i.e., oriented in the hemisphere pointing toward the Sun), while all pairs in the north of the source indicate a positive magnetic field.
Nearly all of the maser spots identified in the northeastern cluster constitute a component of a Zeeman pair. In total, there are eight Zeeman pairs in the cluster – four each in the 1665 and 1667 MHz transitions. The magnetic field strengths are consistent, ranging from 1.2 to 2.0 mG in the cluster. The center (material) velocities of the Zeeman pairs range from 8.6 to 10.0 km s-1. This is in excellent agreement with Caswell (2001), who find a 6035 MHz Zeeman pair in this region centered at 9.96 km s-1 with a splitting of 1.49 mG.
We can define the Zeeman pairing efficiency as twice the number of Zeeman pairs divided by the total number of maser spots (in both polarizations and transitions) in a region. In the limiting case where every maser spot is a -component in a detectable Zeeman pair, the Zeeman pairing efficiency would be 100%. For the northeastern cluster (Figure 3 of Paper I), the Zeeman pairing efficiency is 84%. The pairing efficiency in the western half of the source is only 16%. We note that the velocities of maser spots range from 2.6 to 15.8 km s-1 in the western half of the source This is a much larger range than for the northeastern cluster, which has a larger Zeeman pairing efficiency. Since velocity coherence is necessary for the amplification of both -components of a Zeeman pair, it is reassuring to note that the region with the more coherent velocity field also produces Zeeman pairs more efficiently.
Zijlstra et al. (1990) observe OH emission from km s-1 to 17 km s-1 and interpret this emission as tracing a bipolar outflow. Our observations span only the upper end of this velocity range. We see redshifted emission extending to the southwest of the western group of masers, in general agreement with Zijlstra et al. They do not see emission at 8.6 to 10.0 km s-1 in the eastern half of the source, probably due to the large channel width (2.2 km s-1 velocity equivalent) and beam size of their observations. They also do not see emission at the appropriate velocities corresponding to the isolated and mG Zeeman pairs we detect. At 6035 MHz, Caswell (2001) finds emission in the velocity range corresponding to our observations and absorption from to km s-1, supporting the model of Zijlstra et al.
Feldt et al. (2003) detect a candidate O-type ionizing star at in Figure 1 of Paper I. The star’s location is coincident with the isolated mG Zeeman pair to within positional errors. The brighter RCP component of this Zeeman pair has a flux density of 2.37 Jy. Since the H II region is optically thick at cm (Afflerbach et al., 1996), it is unlikely that direct amplification of stellar radiation is important. Is the spatial coincidence of this maser spot with the projected location of the star due to chance, or is amplification favored due to the stellar radiation? Nine other main-line maser features in G5.8860.393 are brighter than this feature, indicating that the observed flux density is not strongly affected by whether the maser is projected atop the star. However, the observed flux density of strong ( Jy) maser spots may be relatively insensitive to initial conditions if they are at least partially saturated. Due to interstellar scattering, it is possible to get only a lower limit for maser brightness temperatures, but it is probable that the brightest maser spots in this source are saturated (see §4.1).
A.2 G9.6220.195
The G9.620.19 complex contains several UCH II regions, as well as a hot molecular core (Cesaroni et al., 1994). We detect OH masers around sources D, E, and G in the nomenclature system of Garay et al. (1993) and Testi et al. (2000). At source E, we find two Zeeman pairs which both indicate a positive magnetic field. At source G, we find two Zeeman pairs which both indicate a negative magnetic field. Few OH maser spots and no Zeeman pairs are identified at source D, while no maser activity at all is seen near the hot core (source F), located between sources D and G.
We do not see the isolated 1665 MHz RCP maser detected between sources E and G in Argon, Reid, & Menten (2000). This maser spot has likely weakened below our detectability threshold in the 10 years since their observations. Water maser emission is seen at this site and associated with sources D, E, and G (Hofner & Churchwell, 1996).
A.3 G10.6240.385
Overall evidence indicates that G10.6240.385 (catalog G10.624-0.385) is undergoing collapse. Observations of NH3 show that the molecular material is rotating and falling inward, with rapid spiral motions inward of about 0.05 pc (Ho & Haschick, 1986; Keto, Ho, & Haschick, 1987). The plane of rotation cuts through the center of the H II region and is oriented approximately 20° west of north (Keto, Ho, & Haschick, 1988). Coherent inward motions are also seen within the ionized gas in the H II region (Keto, 2002).
We detect relatively few maser spots in G10.6240.385. Emission falls into three regions: a clump to the east, a clump to the west of the previous clump, and an isolated maser spot to the northwest. We find only one Zeeman pair, indicating a magnetic field of mG in the easternmost clump. The west clump appears arclike, with a length of about 150 mas. This is the only clump to show any linear polarization, most of which is oriented roughly perpendicular to the arc. None of the maser spots we detect lies along the plane of rotation.
The ground-state masers we detect span a velocity range of to km s-1. This is in agreement with the velocity span of excited states of OH: to km s-1 in emission (Gardner & Martín-Pintado, 1983), to km s-1 in absorption (Fish, Reid, & Menten, 2005), and to km s-1 in absorption (Walmsley et al., 1986).
A.4 G34.2570.154
The G34.30.2 complex contains several UCH II regions. Most prominent is the “cometary” H II region, labelled C in the nomenclature of Gaume, Fey, & Claussen (1994). The morphology of region C can be explained as a bow shock due to the supersonic relative motion of the exciting source with respect to the surrounding medium (Reid & Ho, 1985; Mac Low et al., 1991). Region C may be composed of more than one continuum component (Sewilo et al., 2004). Two fainter components, labelled A and B by Reid & Ho (1985), are located to the southeast and northeast of region C, respectively. The complex has a kinematic distance of 3.8 kpc (Galactic center distance kpc) (Reifenstein et al., 1970).
A blueshifted outflow extending to the northwest is seen by Hatchell, Fuller, & Millar (2001). Components A and C were detected in the mid-infrared, but component B was not, suggesting that it is deeply embedded and therefore very young (Campbell et al., 2000). Based on this and the spectral index of component B (, from Gaume, Fey, & Claussen, 1994), Hatchell et al. conclude that component B is the source of the outflow.
Unlike other sources, there is not a single line that can be drawn across the entirety of G34.2570.154 which separates regions of positive and negative magnetic field. However, such lines can be drawn for the masers associated with regions B and C separately. Region B contains many Zeeman pairs with positive magnetic field near the continuum source and a single Zeeman pair with negative magnetic field to the northeast of the source. All of the Zeeman pairs ahead of the bow shock in region C imply a negative magnetic field except for a small region near the H II region to the south. There is good qualitative agreement between the magnetic field measured here and similar VLBA observations of the source in 1995 by Zheng, Reid, & Moran (2000). In the northern half of the source, the field directions are identical between the two observations, and field magnitudes agree to better than 0.3 mG where they overlap. In the center and south, we find larger field magnitudes than reported by Zheng et al. Line-of-sight field directions are again in agreement, although Zheng et al. find Zeeman pairs implying magnetic fields of and mG near the origin of Figure 9 of Paper I. At this same location, Gasiprong, Cohen, & Hutawarakorn (2002) find only one Zeeman pair implying a magnetic field of mG. In this region, we infer magnetic fields of , , , and mG from four Zeeman pairs. At 6035 MHz, Caswell & Vaile (1995) and Caswell (2001) find three Zeeman pairs indicating a magnetic field of mG. Their observations do not have the necessary angular resolution to determine which H II region the 6035 MHz are associated with, but their results are largely consistent with magnetic fields obtained from the cometary region C, especially in the north.
Gasiprong, Cohen, & Hutawarakorn (2002) also observed linear polarization with the MERLIN array. It is difficult to compare our results directly with theirs, since the resolution afforded by MERLIN is insufficient to separate distinct maser components with very different linear polarization position angles. Nevertheless, for the brighter spots it is possible to identify a maser spot in our data that corresponds to a similar spot in the Gasiprong study. Polarization position angles generally agree to 10 or .
A.5 G35.5770.029
This source contains two UCH II regions. All of the maser activity appears to be associated with the western H II region. We detect maser spots only on the western limb of the western H II region with the exception of one isolated spot to the east. Due to registration uncertainties, it is not clear whether this spot is located directly atop the H II region or on the eastern limb. We detect three Zeeman pairs in the western clump of emission, with all three implying a magnetic field in the range of to mG.
A.6 G40.6220.137
There is a large () cluster of OH maser emission centered approximately away from the only detected H II region. We detect two Zeeman pairs in the same region, consistent with a field strength of approximately mG. Caswell & Vaile (1995) find one Zeeman pair in 6035 MHz OH maser emission implying a magnetic field of mG, suggesting that there may be a reversal of the line-of-sight direction of the magnetic field in this source. Methanol and water masers are also seen within less than 1″ of the reference position (Forster & Caswell, 1989; Beuther et al., 2002).
A.7 G43.7960.127
The X-band continuum maps show two sources – a bright source to the northwest, and a weak source to the southeast. All maser emission lies atop the northwest source. A total of seven Zeeman pairs were identified. Five of these indicate a positive magnetic field, and two indicate a negative magnetic field. Unlike in other sources in which a reversal is seen, it is not possible to draw a single straight line such that the magnetic field on each side of the line has a uniform line-of-sight direction. A Zeeman measurement of 6035 MHz (excited-state) OH emission implies a magnetic field of mG (Caswell & Vaile, 1995). Three measurements of the Zeeman effect in H2O masers, which trace a higher range of densities, imply a magnetic field of to mG (Sarma et al., 2002).
We have adopted an ammonia velocity of 45.2 km s-1 for G43.7960.127. The NH3 spectrum itself (see Figure 41 of Paper I) is complicated, and it is difficult to identify which line is the main line and which are hyperfine lines. We identify the line at 45.2 km s-1 as the main line because its velocity most closely matches that of the CS velocity of 44.3 km s-1 (Plume, Jaffe, & Evans, 1992). Since the critical density of CS is cm-3, we feel confident that it is tracing the same high-density material as the NH3 emission.
A.8 W51
We find a total of 46 Zeeman pairs near sources e1 and e2, making W51 the most prolific massive SFR in terms of the number of Zeeman pairs in our survey. As previously reported (Argon, Reid, & Menten, 2002), source e2 contains two Zeeman pairs implying the strongest magnetic fields ever seen in interstellar OH masers: 19.8 mG and 21 mG.
Source e1 shows a reversal of the line-of-sight field direction, which points toward the Sun in the northern half of the source and away from the Sun in the southern half. Source e2 is the clearest example yet that shows the extent to which magnetic fields are ordered in massive SFRs. All 22 Zeeman pairs indicate a positive magnetic field. Although there is a huge variation in the strength of the magnetic field across the source, multiple Zeeman pairs in each cluster have consistent field strengths to within about 1 mG.
W51 is remarkable among our source sample as having almost no detectable linear polarization. Three maser spots near the origin in source e1 have linear polarization fractions of 1% to 2%. No linear polarization was detected for any other spot in source e1 or any spot at all in source e2. The plausibility of circularization due to high Faraday rotation along maser amplification paths is discussed in §4.2.
A.9 ON 1
The maser spots appeared to be grouped into three regions. The masers in the northern group have velocities near 4 km s-1. The masers in the central group are located at about km s-1. The southern maser spots fall primarily along an extended collinear feature. The velocities in this line range from 13 to 15 km s-1. OH masers are not seen at intermediate velocities. Methanol masers show a similar velocity structure (Szymczak, Hrynek, & Kus, 2000).
Zeeman splitting in ON 1 is everywhere consistent with a magnetic field pointing in the hemisphere toward the Sun. We do not find any unambiguous Zeeman pairs in the northern group. At 6031 and 6035 MHz, Desmurs & Baudry (1998) find four Zeeman pairs implying magnetic fields from to mG. These maser spots appear to fall slightly north and west of the northern group of maser spots detected in the ground-state transitions here and in Argon, Reid, & Menten (2000), but their center velocities fall between 13.7 and 15.3 km s-1 as compared with a velocity range of 3.2 to 6.2 km s-1 in the northern ground-state group. It is unclear whether this 10 km s-1 difference reflects a large velocity gradient in the northern part of the source or whether the 6031 and 6035 MHz emission comes from a different area, reflecting registration uncertainties between the various sets of observations. Two 13441 MHz Zeeman pairs at 14.1 and 0.3 km s-1 indicate magnetic fields of and mG, respectively (Fish, Reid, & Menten, 2005).
Since registration uncertainties of a few tenths of an arcsecond may exist between the continuum image and our maser spot maps, one possible interpretation is that the northern and southern maser groups are located on the limb of the UCH II region, while the center group is projected onto the H II region. While the precise locations of these groups relative to the H II region along the line of sight is unknown, the center group must be located in front of the H II region, since the H II region is optically thick at 18 cm (Zheng et al., 1985). The authors also noted an arcminute-scale gradient of km s-1 pc-1 in NH3 emission with a velocity of km s-1 near the H II region (comparable to that of the southern group of OH masers) and an H recombination velocity of km s-1, blueshifted with respect to the NH3 emission. They concluded that the motions in ON 1 were consistent with infall and rotation.
The velocities of the three groups of maser spots we observe may be consistent with infall and rotation on a smaller angular scale as well. If the north and south maser groups are at limbs of the rotation, the implied rotation speed would be 5 km s-1 centered at 9 km s-1 and roughly aligned with the direction of rotation noted by Zheng et al. The center maser group might then be infalling at 5 km s-1 as well. At this radius, 5 km s-1 corresponds to the freefall velocity for a star, so if net rotation is also sustained, rapidly spiralling infall must be occurring. Nevertheless, this could explain why the RCP maser emission in the northern group is seen farther from the center of the H II region than the LCP emission. Because the magnetic field splits the RCP emission to a lower LSR velocity than the LCP emission, the coherent path length is larger farther away from the center of the H II region.
A.10 K350
This H II region has a diameter of over 0.1 pc, which is large for an ultracompact H II region. Masers are found only to the north and east of the H II region. The line-of-sight magnetic field direction points toward the Sun at all maser groups. However, due to the lack of maser emission to the south and west of the H II region, we cannot conclusively rule out a magnetic field reversal across K350 (catalog NAME K3-50A). Using the Effelsberg 100 m telescope, Baudry et al. (1997) find two 6035 MHz Zeeman pairs indicating field strengths of and mG centered at and km s-1, respectively. These are redshifted compared to the Zeeman pairs we identify, whose center velocities range from to km s-1. Two components at to km s-1 and to km s-1 are seen in absorption in the lines (Fish, Reid, & Menten, 2005).
A.11 ON 2 N
Eleven Zeeman pairs have been identified in ON 2 N, all indicating a positive magnetic field. All of the OH maser emission is located to the south and west of the UCH II region, in the same area as the H2O maser emission (Hofner & Churchwell, 1996).
There are three groups of maser spots arranged roughly in a line with a position angle 35° east of north beginning at the H II region. This line of spots exhibits a velocity gradient with the most redshifted emission toward the southwest. A cluster of maser spots with a large velocity dispersion is offset from this line and elongated perpendicular to it. Almost all spots with any detectable linear polarization, as well as all spots with a high linear polarization fraction, are offset from the line of masers.
A.12 W75 S
We have identified 13 Zeeman pairs around the UCH II region in W75 S. There is a reversal of the line-of-sight magnetic field direction across this SFR. Seven Zeeman pairs to the east indicate a magnetic field pointing toward the Sun, while six to the west indicate a magnetic field in the opposite direction. Additionally, field strengths within maser clusters are remarkably consistent. The six Zeeman pairs in the western cluster imply field strengths of to mG, and the six Zeeman pairs to the southeast of the H II region imply field strengths of to mG.
A collinear arrangement of maser spots exists near the origin in Figure 25 of Paper I. An enlargement of this region is shown in Figure 20, along with a best-fit line. There is a velocity gradient along this line with the velocity increasing to the north. If these masers are interpreted as tracing a circumstellar disk in Keplerian rotation, the radius of the disk is at least 400 AU, and the central mass is at least 6 M☉. See §4.5 for further discussion of the possible interpretations of this structure.


A.13 W75 N
The region of OH masing in W75 N coincides with three continuum sources, identified from north to south as VLA 1, VLA 2, and VLA 3 by Torrelles et al. (1997). Based on an elongation of VLA 1 (at position angle ) and the spectral index of the source, the authors conclude that there is an ionized, biconical, partially optically thick jet emanating from the source. In addition to this flow, there is a larger, 3-pc flow oriented at position angle that does not appear to be driven by the outflow in VLA 1 (Shepherd, Testi, & Stark, 2003).
W75 N contains OH maser spots distributed primarily along two axes. Along the north-south axis the magnetic field is oriented away from the Sun, while along the east-west axis the field is oriented toward the Sun. At the intersection of these two axes there are two Zeeman pairs, each indicating a different sign of the magnetic field. It appears that most masers are associated with VLA 1. However, the dynamics of the cluster at the limb of VLA 2 (Figure 28 of Paper I) are unlike the rest of the masers, suggesting that these masers are indeed associated with VLA 2.
Other maser species exist in W75 N as well. H2O masers are seen close to the H II regions, with spots distinctly on the limbs of VLA 2 and VLA 3 as well as along the position angle of the jet in VLA 1 (Torrelles et al., 1997). CH3OH masers are seen primarily as an extension to the north of the north-south axis of OH masers, and they are distributed in a line with position angle (Minier, Conway, & Booth, 2001). Thus, the CH3OH masers appear to be associated with VLA 1.
The region around VLA 2 contains a large number of OH maser spots at a wide range of velocities. The difference in velocity between the most blueshifted and most redshifted spot in this region is 34 km s-1 (Elldér, 1973; Hutawarakorn, Cohen, & Brebner, 2002). Our bandwidth only covered about 21 km s-1 of this range. We detect maser emission in both the highest and lowest usable velocity channel at which we observed. A large velocity dispersion in H2O masers is also seen in this region (Torrelles et al., 2003). Based on these large velocity dispersions, the location of VLA 2, and the steeply rising spectrum of continuum emission, Hutawarakorn, Cohen, & Brebner (2002) conclude that VLA 2 is the source of the large-scale molecular outflow. Slysh, Val’tts, & Migenes (2001) interpret the maser spots in the north-south axis as being a disk centered at VLA 1.
Since the observations detailed in Paper I, a 1665 MHz maser in W75 N has become the strongest ever detected, reaching a flux of approximately 1 kJy (Alakoz et al., 2005). They find a 750 Jy RCP feature at 1.8 km s-1, as well as two other new features near 0 and km s-1. All three features are predominantly linearly polarized and are therefore likely -components or -components where the magnetic field is oriented close to the plane of the sky. These are offset by about km s-1 compared to the bright features in Paper I. It is possible that these features are new or that the masers near VLA 2 are accelerating. This latter possibility cannot be ruled out because of the nature of the masers near VLA 2. They are observed to span a velocity range 34 km s-1 wide and appear to be associated with an outflow (Elldér, 1973; Hutawarakorn, Cohen, & Brebner, 2002). If the outflow is decelerating, it is possible that masers entrained in the flow may appear at slightly different velocities between epochs.
A.14 Cep A
Cep A is a complex molecular cloud condensation. Hughes & Wouterloot (1984) detected no fewer than 14 H II regions in the complex, and subsequent observations have uncovered even more radio continuum sources (Hughes, 1988; Curiel et al., 2002). HW 2, the brightest continuum source in Figure 30 of Paper I, appears to contain at least four compact sources (Hughes, Cohen, & Garrington, 1995) and is believed to be the source of two thermal jets (Rodríguez et al., 1994; Hughes, 2001). The 6 cm radio jet is oriented at a position angle of 44 and is observed to have a projected velocity of km s-1 (Rodríguez et al., 2001). Water masers are seen associated with this jet (Torrelles et al., 1996), and their proper motions suggest the presence of at least three distinct sites of star formation within a projected 200 AU radius (Torrelles et al., 2001). To the south in Figure 30 of Paper I are three continuum sources: HW 3c, HW 3div, and HW 3dii in the nomenclature of Hughes, Cohen, & Garrington (1995) and Torrelles et al. (1998). Source HW 3c shows evidence of multiple components (Hughes, Cohen, & Garrington, 1995). Water masers are seen around HW 3dii and the nearby source HW 3di, which is not detectable in our X-band image (Torrelles et al., 1998). We detect OH masers around HW 2, HW 3c, and HW 3div, as well as a cluster of masers between HW 3div and HW 3dii and a lone maser not near any continuum source.
Bartkiewicz et al. (2005) identify seven Zeeman pairs at 1665 MHz and two at 1667 MHz with MERLIN. Four of these (Z2, both Z7’s, and Z8) agree with our findings in terms of central velocity and magnetic field strength to within the errors expected from velocity resolution. Pairs Z5 and Z6 also agree with the magnetic field strength we find in the respective maser clusters, although several maser spots are blended together at these locations in the MERLIN beam. We do not find counterparts for pairs Z1 and Z3, and we do not have the velocity coverage necessary to observe Z4.
A.15 NGC 7538
NGC 7538 (catalog ) is a complex star-forming region. The continuum source in Figure 32 of Paper I, known as IRS 1, contains a core of two compact components and a larger, spherical region to the south (Turner & Matthews, 1984; Campbell, 1984). Scoville et al. (1986) argued for the existence of an ionized stellar wind outflow based on the spectral index of millimeter continuum emission and for a possible disk oriented east-west based on 13CO emission. Gaume et al. (1995) find that the distribution of continuum emission is clumpy and suggest that photoionization from the central star is responsible for this emission. There is a bipolar, high-velocity CO flow around IRS 1 (Fischer et al., 1985), possibly collimated by a denser ring of material seen in CS (Kawabe et al., 1992). This outflow, as well as other outflows and stellar winds in the IRS 1-3 region, may be driving the expansion of a molecular half-shell (Xu, Zheng, & Jiang, 2003).
NGC 7538 is also remarkable in the variety of maser species detected. Among these are rare maser species such as H2CO (Forster et al., 1980), 14NH3 (Madden et al., 1986), and 15NH3 (Mauersberger, Wilson, & Henkel, 1986). H2O masers (Genzel & Downes, 1976; Kameya et al., 1990) and CH3OH masers from a variety of transitions (e.g., Wilson et al., 1984, 1985; Batrla et al., 1987) are seen in NGC 7538 as well. OH maser emission has been seen in the 1665, 1667, and 1720 MHz lines (e.g., Downes, 1970; Dickel et al., 1982; Hutawarakorn & Cohen, 2003), the 6035 MHz line (Guilloteau et al., 1984), and the 4765 MHz line (Palmer, Gardner, & Whiteoak, 1984). Hutawarakorn & Cohen find one Zeeman pair in each of the 1667 and 1720 MHz transitions implying magnetic fields of and mG, respectively. We find no Zeeman pairs at 1667 MHz, but we do detect a Zeeman pair of mG at 1665 MHz, suggesting that there is a reversal of the line-of-sight direction of the magnetic field across the source.
A.16 S269
We have found three Zeeman pairs in S269, consistent with a magnetic field of to mG. Otherwise, S269 is one of the simplest sources in our study. It exhibits few maser spots. There is not much linear polarization of maser emission in this source. The VLA survey was unable to detect any continuum emission, nor was ammonia emission found. And the range of velocities of maser emission is a mere km s-1.
The magnetic field appears to be oriented toward the Sun everywhere across the region of maser emission. All RCP emission, excluding weak features associated with the linearly-polarized component of two strong left-elliptically polarized masers, occurs at lower velocity than the LCP emission. Figure 21 shows the spectrum of the 1665 MHz emission. When the spectra are corrected for Zeeman splitting (“demagnetized”) for a mG magnetic field, the total velocity range spanned by the RCP and LCP features decreases from 3.9 km s-1 to 1.5 km s-1.
S269 also exhibits a high degree of variability. Clegg (1993) notes a 1665 MHz maser of 16 Jy LCP flux at 17.9 km s-1 in 1991.5, diminishing to 1 Jy by 1992.1. In 1991.6, Argon, Reid, & Menten (2000) find that this maser has a flux of 7.5 Jy LCP. The closest feature we find to matching this is a 1665 MHz maser of 0.11 Jy LCP flux at 17.8 km s-1. We detect this feature in the 17.76 and 17.93 km s-1 velocity channels, but the lack of detection in a third channel prevents us from being able to accurately determine the velocity and linewidth of this feature.

A.17 Mon R2
The Mon R2 molecular cloud is one of the nearest high-mass star-forming regions, but it contains almost no stars of spectral type earlier than B1 (Hughes & Baines, 1985). An unusual property of Mon R2 is that maser emission from the 4765 MHz () transition of OH is stronger than from the ground-state () set of transitions, suggesting that the physical conditions are denser and hotter than normally seen for ground-state OH masers, as noted by Smits, Cohen, & Hutawarakorn (1998). They detect two masers at 10.65 km s-1 with linear polarization position angles of 13 and 14°. This is in excellent agreement with the brightest maser feature we detect, coincident with the brightest 4765 MHz maser to within registration uncertainties, which has linear polarization with a position angle of 13°. The velocity of this 1665 MHz maser feature is 10.29 km s-1 when corrected for the Zeeman splitting of the mG magnetic field at the site. The 4765 MHz masers in Mon R2 are highly variable, doubling in strength in less than 19 days and reaching a peak of nearly 80 Jy before “disappearing” (Smits, 2003). Smits finds that 1665 and 1667 MHz emission is much less variable, varying relatively smoothly with changes in flux density not exceeding a factor of two over a timescale of more than four years.
A.18 G351.7750.538
G351.7750.538 contains what was the strongest known interstellar OH maser spot (400 Jy in LCP) until the recent flare in W75 N (Alakoz et al., 2005). Caswell & Haynes (1980) first noted that the brightness of this maser spot is highly variable, and it has been monitored frequently since then (see MacLeod & Gaylard, 1996). Ground-state masers have previously been seen at velocities as low as km s-1 (Argon, Reid, & Menten, 2000) and as high as km s-1 (MacLeod & Gaylard, 1996). Our VLBA observations covered only the top half of this range.
There is a reversal of the line-of-sight magnetic field direction across the source, as has been previously noted at 1665 and 1667 MHz by Argon, Reid, & Menten (2002) and Fish et al. (2002). This reversal is seen at 1720 MHz as well, where Caswell (2004) finds magnetic fields of and mG. Caswell & Vaile (1995) find a mG field at 6035 MHz.
Because G351.7750.538 is a low Declination source, -coverage is poor, especially along north-south baselines. The synthesized beam and spot sizes as listed in Table 20 of Paper I are thus very large. This may explain the separations of Zeeman components for G351.7750.538 (see Table 21 of Paper I), which are larger than for other sources.
Appendix B Maser Overlap Polarization Calculation
In this appendix we consider the polarization properties expected of a -component that stimulates weak amplification from a -mode of a clump of OH between the first maser and the observer, as described in §4.4. It is helpful to analyze the radiation in terms of the Stokes parameters, which are defined in terms of the electric fields in the radiation as follows:
| (B1) |
They can also be written in terms of the electric fields in the two senses of circular polarization:
| (B2) |
where , etc.
Consider a simple case of weak maser amplification in the absence of Faraday rotation. We will start with radiation that is 100% linearly polarized in the -direction, as could be produced by a -component. The Stokes parameters of the radiation are
| (B3) |
so the polarization fractions ( linear, circular, and total) are
| (B4) |
Now suppose that this radiation is fed into a second, weak maser spot shifted in velocity such that emission is stimulated in the RCP -mode. The amplification factor is such that the flux density in the RCP mode is multiplied by a factor of 2. Then
| (B5) |
where the factors of are due to the fact that if the flux density increases by a factor of 2, the electric field amplitude increases by a factor of . Substituting these values into equation (B2) results in the following:
| (B6) |
Converting equation (B6) to polarization fractions, we obtain
| (B7) |
The net effect is that the maser is still 100% polarized, but the linear polarization fraction has dropped to less than unity and the circular polarization fraction is reasonably large. For amplification of a single circular mode by a factor of , the linear polarization fraction is
| (B8) |
The circular and linear polarization fractions become equal at , or approximately 1.8 -fold amplification lengths for an unsaturated maser.
References
- Afflerbach et al. (1996) Afflerbach, A., Churchwell, E., Acord, J. M., Hofner, P., Kurtz, S., & De Pree, C. G. 1996, ApJS, 106, 423
- Alakoz et al. (2005) Alakoz, A. V., Slysh, V. I., Popov, M. V., & Val’tts, I. E. 2005, Ap. Lett., 31, 375
- Allen, Li, & Shu (2003) Allen, A., Li, Z.-Y., & Shu, F. H. 2003, ApJ, 599, 363
- Argon, Reid, & Menten (2000) Argon, A. L., Reid, M. J., & Menten, K. M. 2000, ApJS, 129, 159
- Argon, Reid, & Menten (2002) Argon, A. L., Reid, M. J., & Menten, K. M. 2002, in IAU Symposium 206, Cosmic MASERs: From Protostars to Blackholes, ed. V. Migenes and M. J. Reid (San Francisco: ASP), 367
- Baart & Cohen (1985) Baart, E. E., & Cohen, R. J. 1985, MNRAS, 213, 641
- Baldwin, Harris, & Ryle (1973) Baldiyn, J. E., Harris, L. S., & Ryle, M. 1973, Nature, 241, 38
- Bartkiewicz et al. (2005) Bartkiewicz, A., Szymczak, M., Cohen, R. J., & Richards, A. M. S. 2005, MNRAS, 361, 623
- Batrla et al. (1987) Batrla, W., Matthews, H. E., Menten, K. M., & Walmsley, C. M. 1987, Nature, 326, 49
- Baudry et al. (1997) Baudry, A., Desmurs, J. F., Wilson, T. L., & Cohen, R. J. 1997, A&A, 322, 255
- Berulis & Ershov (1983) Berulis, I. I., & Ershov, A. A. 1983, Soviet Ast. Lett., 9, 341
- Beuther et al. (2002) Beuther, H., Walsh, A., Schilke, P., Sridharan, T. K., Menten, K. M., & Wyrowski, F. 2002, A&A, 390, 289
- Black & Hartquist (1979) Black, J. H., & Hartquist, T. W. 1979, ApJ, 232, L179
- Bloemhof, Reid, & Moran (1992) Bloemhof, E. E., Reid, M. J., & Moran, J. M. 1992, ApJ, 397, 500
- Boyd & Werner (1972) Boyd, R. W., & Werner, M. W. 1972, ApJ, 174, L137
- Campbell (1984) Campbell, B. 1984, ApJ, 282, L27
- Campbell et al. (2000) Campbell, M. F., Garland, C. A., Deutsch, L. K., Hora, J. L, Fazio, G. G., Dayal, A., & Hoffman, W. F. 2000, ApJ, 536, 816
- Caswell (2001) Caswell, J. L. 2001, MNRAS, 326, 805
- Caswell (2004) Caswell, J. L. 2004, MNRAS, 349, 99
- Caswell & Haynes (1980) Caswell, J. L., & Haynes, R. F. 1980, IAU Circ. 3509
- Caswell & Vaile (1995) Caswell, J. L., & Vaile, R. A. 1995, MNRAS, 273, 328
- Cesaroni et al. (1994) Cesaroni, R., Churchwell, E., Hofner, P., Walmsley, C. M., & Kurtz, S. 1994, A&A, 288, 903
- Clegg (1993) Clegg, A. W. 1993, Lecture Notes in Physics, Berlin Springer Verlag, 412, 279
- Cook (1966) Cook, A. H. 1966, Nature, 211, 503
- Cragg, Sobolev, & Godfrey (2002) Cragg, D. M., Sobolev, A. M., & Godfrey, P. D. 2002, MNRAS, 331, 521
- Crutcher (1999) Crutcher, R. M. 1999, ApJ, 520, 706
- Curiel et al. (2002) Curiel, S., et al. 2002, ApJ, 564, L35
- Davies (1974) Davies, R. D. 1974, in IAU Symposium 60, Galactic Radio Astronomy, ed. F. J. Kerr and S. C. Simonson III (Dordrecht:Reidel), p. 275
- De Buizer (2003) De Buizer, J. M. 2003, MNRAS, 341, 277
- Deguchi & Watson (1986) Deguchi, S., & Watson, W. D. 1986, ApJ, 300, L15
- Desmurs & Baudry (1998) Desmurs, J. F., & Baudry, A. 1998, A&A, 340, 521
- Dickel et al. (1982) Dickel, H. R., Rots, A. H., Goss, W. M., & Forster, J. R. 1982, MNRAS, 198, 265
- Dieter, Weaver, & Williams (1966) Dieter, N. H., Weaver, H., & Williams, D. R. W. 1966, S&T, 31, 132
- Downes (1970) Downes, D. 1970, Astrophys. Lett., 5, 53
- Draine (1980) Draine, B. T. 1980, ApJ, 241, 1021
- Dyson et al. (2002) Dyson, J. E., Williams, R. J. R., Hartquist, T. W. & Pavlakis, K. G. 2002, Rev. Mexicana Astron. Astrofis.(SC), 12, 8
- Elitzur (1996) Elitzur, M. 1996, ApJ, 457, 415
- Elitzur & de Jong (1978) Elitzur, M., & de Jong, T. 1978, A&A, 67, 323
- Elldér (1973) Elldér, J. 1973, Research Report No. 116, Research Lab. of Electronics and Onsala Space Obs.
- Feldt et al. (2003) Feldt, M., et al. 2003, ApJ, 599, L91
- Field & Gray (1994) Field, D., & Gray, M. D. 1994, A&A, 292, 271
- Fischer et al. (1985) Fischer, J., Sanders, D. B., Simon, M., & Solomon, P. M. 1985, ApJ, 293, 508
- Fish et al. (2002) Fish, V. L., Reid, M. J., Argon, A. L., & Menten, K. M. 2002, in IAU Symposium 206, Cosmic MASERs: From Protostars to Blackholes, ed. V. Migenes and M. J. Reid (San Francisco: ASP), 371
- Fish et al. (2003) Fish, V. L., Reid, M. J., Argon, A. L., & Menten, K. M. 2003, ApJ, 596, 328
- Fish, Reid, & Menten (2005) Fish, V. L., Reid, M. J., & Menten, K. M. 2005, ApJ, 623, 269
- Fish et al. (2005) Fish, V. L., Reid, M. J., Argon, A. L., & Zheng, X. W. 2005, ApJS, 160, 220 (Paper I)
- Forster & Caswell (1989) Forster, J. R., & Caswell, J. L. 1989, A&A, 213, 339
- Forster et al. (1980) Forster, J. R., Goss, W. M., Wilson, T. L., Downes, D., & Dickel, H. R. 1980, A&A, 119, 84, L1
- Garay, Reid, & Moran (1985) Garay, G., Reid, M. J., & Moran, J. M. 1985, ApJ, 289, 681
- Garay et al. (1993) Garay, G., Rodríguez, L. F., Moran, J. M., & Churchwell, E. 1993, ApJ, 418, 368
- García-Barreto et al. (1988) García-Barreto, J. A., Burke, B. F., Reid, M. J., Moran, J. M., Haschick, A. D., & Schilizzi, R. T. 1988, ApJ, 326, 954
- García-Segura & Franco (1996) García-Segura, G., & Franco, J. 1996, ApJ, 469, 171
- Gardner & Martín-Pintado (1983) Gardner, F. F., & Martín-Pintado, J. 1983, A&A, 121, 265
- Gasiprong, Cohen, & Hutawarakorn (2002) Gasiprong, N., Cohen, R. J., & Hutawarakorn, B. 2002, MNRAS, 336, 47
- Gaume, Fey, & Claussen (1994) Gaume, R. A., Fey, A. L., & Claussen, M. J. 1994, ApJ, 432, 648
- Gaume et al. (1995) Gaume, R. A., Goss, W. M., Dickel, H. R., Wilson, T. L., & Johnston, K. J. 1995, ApJ, 438, 776
- Genzel & Downes (1976) Genzel, R., & Downes, D. 1976, Nature, 262, 564
- Giuliani (1979) Giuliani, J. L. 1979, ApJ, 233, 280
- Goldreich (1975) Goldreich, P. 1975, in Les Houches Session XXVI: Physique Atomique et Moléculaire et Matière Interstellaire, ed. R. Balian, P. Encrenaz, and J. Lequeux (North-Holland Publishing: Amsterdam), 409
- Goldreich, Keeley, & Kwan (1973a) Goldreich, P., Keeley, D. A., & Kwan, J. Y. 1973a, ApJ, 179, 111
- Goldreich, Keeley, & Kwan (1973b) Goldreich, P., Keeley, D. A., & Kwan, J. Y. 1973b, ApJ, 182, 55
- Gray & Field (1995) Gray, M. D., & Field, D. 1995, A&A, 298, 243
- Gray, Hutawarakorn, & Cohen (2003) Gray, M. D., Hutawarakorn, B., & Cohen, R. J. 2003, MNRAS, 343, 1067
- Guilloteau et al. (1984) Guilloteau, S., Baudry, A., Walmsley, C. M., Wilson, T. L., & Winnberg, A. 1984, A&A, 131, 45
- Habing et al. (1974) Habing, H. J., Goss, W. M., Matthews, H. E., & Winnberg, A. 1974, A&A, 35, 1
- Habing & Israel (1979) Habing, H. J., & Israel, F. P. 1979, ARA&A, 17, 345
- Haschick et al. (1981) Haschick, A. D., Reid, M. J., Burke, B. F., Moran, J. M., & Miller, G. 1981, ApJ, 244, 76
- Hatchell, Fuller, & Millar (2001) Hatchell, J., Fuller, G. A., & Millar, T. J. 2001, A&A, 372, 281
- Ho & Haschick (1986) Ho, P. T. P., & Haschick, A. D. 1986, ApJ, 304, 501
- Hofner & Churchwell (1996) Hofner, P., & Churchwell, E. 1996, A&AS, 120, 283
- Hughes (1988) Hughes, V. A. 1988, ApJ, 333, 788
- Hughes (2001) Hughes, V. A. 2001, ApJ, 563, 919
- Hughes & Baines (1985) Hughes, V. A., & Baines, J. G. N. 1985, ApJ, 289, 238
- Hughes, Cohen, & Garrington (1995) Hughes, V. A., Cohen, R. J., & Garrington, S. 1995, MNRAS, 272, 469
- Hughes & Wouterloot (1984) Hughes, V. A., & Wouterloot, J. G. A. 1984, ApJ, 276, 204
- Hutawarakorn & Cohen (2003) Hutawarakorn, B., & Cohen, R. J. 2003, MNRAS, 345, 175
- Hutawarakorn, Cohen, & Brebner (2002) Hutawarakorn, B., Cohen, R. J., & Brebner, G. C. 2002, MNRAS, 330, 349
- Kahn (1954) Kahn, F. D. 1954, Bull. Astron. Inst. Netherlands, 12, 187
- Kameya et al. (1990) Kameya, O., Morita, K.-I., Kawabe, R., & Ishiguro, M. 1990, ApJ, 355, 562
- Kawabe et al. (1992) Kawabe, R., Suzuki, M., Hirano, N., Akabane, K., Barsony, M., Najita, J. R., Kameya, O., & Ishiguro, M. 1992, PASJ, 44, 435
- Kawamura & Masson (1998) Kawamura, J. H., & Masson, C. R. 1998, ApJ, 509, 270
- Keto (2002) Keto, E. 2002, ApJ, 568, 754
- Keto, Ho, & Haschick (1987) Keto, E. R., Ho, P. T. P., & Haschick, A. D. 1987, ApJ, 318, 712
- Keto, Ho, & Haschick (1988) Keto, E. R., Ho, P. T. P., & Haschick, A. D. 1988, ApJ, 324, 920
- Li & Shu (1996) Li, Z.-Y., & Shu, F. H. 1996, ApJ, 472, 211
- MacLeod & Gaylard (1996) MacLeod, G. C., & Gaylard, M. J. 1996, MNRAS, 280, 868
- Mac Low et al. (1991) Mac Low, M., van Buren, D., Wood, D. O. S., & Churchwell, E. 1991, ApJ, 369, 395
- Madden et al. (1986) Madden, S. C., Irvine, W. M., Matthews, H. E., Brown, R. D., & Godfrey, P. D. 1986, ApJ, 300, L79
- Manchester (1972) Manchester, R. N. 1972, ApJ, 172, 43
- Manchester et al. (2005) Manchester, R. N., Hobbs, G. B., Teoh, A., & Hobbs, M. 2005, AJ, 129, 1993
- Matsumoto & Tomisaka (2004) Matsumoto, T., & Tomisaka, K. 2004, ApJ, 616, 266
- Mauersberger, Wilson, & Henkel (1986) Mauersberger, R., Wilson, T. L., & Henkel, C. 1986, A&A, 160, L13
- Melrose & Judge (2004) Melrose, D. B., & Judge, A. C. 2004, Phys. Rev. E, 70, 056408
- Mezger & Höglund (1967) Mezger, P. G., & Höglund, B. 1967, ApJ, 147, 490
- Minier et al. (2001) Minier, V., Booth, R. S., Ellingsen, S. P., Conway, J. E., & Pestalozzi, M. R. 2001, in Proceedings of the 5th European VLBI Network Symposium, eds. J. E. Conway, A. G. Polatidis, R. S. Booth, & Y. Pihlström, Chalmers University of Technology, Gothenburg, Sweden, 178
- Minier, Conway, & Booth (2001) Minier, V., Conway, J. E., & Booth, R. S. 2001, A&A, 369, 278
- Moran et al. (1978) Moran, J. M., Reid, M. J., Lada, C. J., Yen, J. L., Johnston, K. J., & Spencer, J. H. 1978, ApJ, 224, L67
- Mouschovias (1976) Mouschovias, T. C. 1976, ApJ, 207, 141
- Norris et al. (1998) Norris, R. P., et al. 1998, ApJ, 508, 275
- Norris et al. (1993) Norris, R. P., Whiteoak, J. B., Caswell, J. L., Wieringa, M. H., & Gough, R. G. 1993, ApJ, 412, 222
- Palmer, Gardner, & Whiteoak (1984) Palmer, P., Gardner, F. F., & Whiteoak, J. B. 1984, MNRAS, 211, 41P
- Pavlakis & Kylafis (1996) Pavlakis, K. G., & Kylafis, N. D. 1996, ApJ, 467, 309
- Plume, Jaffe, & Evans (1992) Plume, R., Jaffe, D. T., & Evans, N. J., II 1992, ApJS, 78, 505
- Pottasch (1958) Pottasch, S. R. 1958 Rev. Mod. Phys., 30, 1053
- Rand & Kulkarni (1989) Rand, R. J., & Kulkarni, S. R. 1989, ApJ, 343, 760
- Reid (2002) Reid, M. J. 2002, in IAU Symposium 206, Cosmic MASERs: From Protostars to Blackholes, ed. V. Migenes and M. J. Reid (San Francisco: ASP), 506
- Reid et al. (1980) Reid, M. J., Haschick, A. D., Burke, B. F., Moran, J. M., Johnston, K. J., & Swenson, G. W., Jr. 1980, ApJ, 239, 89
- Reid & Ho (1985) Reid, M. J., & Ho, P. T. P. 1985, ApJ, 288, L17
- Reid & Moran (1988) Reid, M. J., & Moran, J. M. 1988, in Galactic and Extragalactic Radio Astronomy, ed. G. Verschuur & K. I. Kellermann (Berlin:Springer), 255
- Reid & Menten (1993) Reid, M. J., & Menten, K. M. 1993, LNP Vol. 412: Astrophysical Masers, 412, 137
- Reid, Myers, & Bieging (1987) Reid, M. J., Myers, P. C., & Bieging, J. H. 1987, ApJ, 312, 830
- Reid & Silverstein (1990) Reid, M. J., & Silverstein, E. M. 1990, ApJ, 361, 483
- Reifenstein et al. (1970) Reifenstein, E. C., Wilson, T. L., Burke, B. F., Mezger, P. G., & Altenhoff, W. J. 1970, A&A, 4, 357
- Rodríguez et al. (1994) Rodríguez, L. F., Garay, G., Curiel, S., Ramírez, S., Torrelles, J. M., Gómez, Y., & Velázquez, A. 1994, ApJ, 430, L65
- Rodríguez et al. (2001) Rodríguez, L. F., Torrelles, J. M., Anglada, G., & Martí, J. 2001, Rev. Mexicana Astron. Astrofis., 37, 95
- Sarma et al. (2002) Sarma, A. P., Troland, T. H., Crutcher, R. M., & Roberts, D. A. 2002, ApJ, 580, 937
- Sams, Moran, & Reid (1996) Sams, B. J. III, Moran, J. M., & Reid, M. J. 1996, ApJ, 459, 632
- Scoville et al. (1986) Scoville, N. Z., Sargent, A. I., Sanders, D. B., Claussen, M. J., Masson, C. R., Lo, K. Y., & Phillips, T. G. 1986, ApJ, 303, 416
- Sewilo et al. (2004) Sewilo, M., Churchwell, E., Kurtz, S., Goss, W. M., & Hofner, P. 2004, ApJ, 605, 285
- Shepherd, Testi, & Stark (2003) Shepherd, D. S., Testi, L., & Stark, D. P. 2003, ApJ, 584, 882
- Shu (1992) Shu, F. H. 1992, The Physics of Astrophysics v. 2: Gas Dynamics (University Science: Sausalito, CA)
- Slysh et al. (2001) Slysh, V. I., et al. 2001, MNRAS, 320, 217
- Slysh et al. (2002) Slysh, V. I., Migenes, V., Val’tts, I. E., Lyubchenko, S. Yu., Horiuchi, S., Altunin, V. I., Fomalont, E. B., & Inoue, M. 2002, ApJ, 564, 317
- Slysh, Val’tts, & Migenes (2001) Slysh, V. I., Val’tts, I. E., & Migenes, V. 2001, Astronomy Reports, 45, 942
- Slysh, Voronkov, & Val’tts (2002) Slysh, V. I., Voronkov, M. A., & Val’tts, I. E. 2002, in IAU Symposium 206, Cosmic MASERs: From Protostars to Blackholes, ed. V. Migenes and M. J. Reid (San Francisco: ASP), 105
- Smits (2003) Smits, D. P. 2003, MNRAS, 339, 1
- Smits, Cohen, & Hutawarakorn (1998) Smits, D. P., Cohen, R. J., & Hutawarakorn, B. 1998, MNRAS, 296, L11
- Sternberg & Dalgarno (1995) Sternberg, A., & Dalgarno, A. 1995, ApJS, 99, 565
- Szymczak, Hrynek, & Kus (2000) Szymczak, M., Hrynek, G., & Kus, A. J. 2000, A&AS, 143, 269
- Testi et al. (2000) Testi, L., Hofner, P., Kurtz, S., & Rupen, M. 2000, A&A, 359, L5
- Thompson, Moran, & Swenson (2001) Thompson, A. R., Moran, J. M., & Swenson, G. W., Jr. 2001, Interferometry and Synthesis in Radio Astronomy (2d ed.; New York: Wiley-Interscience)
- Torrelles et al. (2001) Torrelles, J. M. et al. 2001, ApJ, 560, 853
- Torrelles et al. (2003) Torrelles, J. M. et al. 2003, ApJ, 598, L115
- Torrelles et al. (1998) Torrelles, J. M., Gómez, J. F., Garay, G., Rodríguez, L. F., Curiel, S., Cohen, R. J., & Ho, P. T. P. 1998, ApJ, 509, 262
- Torrelles et al. (1996) Torrelles, J. M., Gómez, J. F., Rodríguez, L. F., Curiel, S., Ho, P. T. P., & Garay, G. 1996, ApJ, 457, L107
- Torrelles et al. (1997) Torrelles, J. M., Gómez, J. F., Rodríguez, L. F., Ho, P. T. P., Curiel, S., & Vázquez, R. 1997, ApJ, 489, 744
- Turner & Matthews (1984) Turner, B. E., & Matthews, H. E. 1984, ApJ, 277, 164
- Vandervoort (1962) Vandervoort, P. O. 1962, ApJ, 135, 212
- Vishniac (1983) Vishniac, E. T. 1983, ApJ, 274, 152
- Walmsley et al. (1986) Walmsley, C. M., Baudry, A., Guilloteau, S., & Winnberg, A. 1986, A&A, 167, 151
- Wilson, Gaume, & Johnston (1993) Wilson, T. L., Gaume, R. A., & Johnston, K. J. 1993, ApJ, 402, 230
- Wilson et al. (1985) Wilson, T. L., Walmsley, C. M., Menten, K. M., & Hermsen, W. 1985, A&A, 147, L19
- Wilson et al. (1984) Wilson, T. L., Walmsley, C. M., Snyder, L. E., & Jewell, P. R. 1984, A&A, 134, L7
- Wright, Gray, & Diamond (2004) Wright, M. M., Gray, M. D., & Diamond, P. J. 2004, MNRAS, 350, 1272
- Xu, Zheng, & Jiang (2003) Xu, Y., Zheng, X. W., & Jiang, D. R. 2003, Chinese J. Astron. Astrophys., 3, 133
- Zheng (1997) Zheng, X.-W. 1997, Chinese Astron. Astrophys., 21, 182
- Zheng, Reid, & Moran (2000) Zheng, X., Reid, M. J., & Moran, J. M. 2000, A&A, 357, L37
- Zheng et al. (1985) Zheng, X. W., Ho, P. T. P., Reid, M. J., & Schneps, M. H. 1985, ApJ, 293, 522
- Zijlstra et al. (1990) Zijlstra, A. A., Pottasch, S. R., Engels, D., Roelfsema, P. R., Te Lintel Hekkert, P., & Umana, G. 1990, MNRAS, 246, 217