Mass Profiles and Shapes of Cosmological Structures
Kinematical and Dynamical Modeling of Elliptical Galaxies
Abstract
Elements of kinematical and dynamical modeling of elliptical galaxies are presented. In projection, NFW models resemble Sérsic models, but with a very narrow range of shapes (). The total density profile of ellipticals cannot be NFW-like because the predicted local and aperture velocity dispersion within an effective radius () are much lower than observed. Stars must then dominate ellipticals out to a few . Fitting an NFW model to the total density profile of Sérsic+NFW (stars+dark matter [DM]) ellipticals results in very high concentration parameters, as found by X-ray observers. Kinematical modeling of ellipticals assuming an isotropic NFW DM model underestimates at the virial radius by a factor of 1.6 to 2.4, because dissipationless CDM halos have slightly different density profiles and slightly radial velocity anisotropy. In -body+gas simulations of ellipticals as merger remnants of spirals embedded in DM halos, the slope of the DM density profile is steeper when the initial spiral galaxies are gas-rich. The Hansen & Moore (2006) relation between anisotropy and the slope of the density profile breaks down for gas and DM, but the stars follow an analogous relation with slightly less radial anisotropies for a given density slope. Using kurtosis () to infer anisotropy in ellipticals is dangerous, as is also sensitive to small levels of rotation. The stationary Jeans equation provides accurate masses out to . The discrepancy between the modeling of Romanowsky et al. (2003), indicating a dearth of DM in ellipticals, and the simulations analyzed by Dekel et al. (2005), which match the spectroscopic observations of ellipticals, is partly due to radial anisotropy and to observing oblate ellipticals face-on. However, one of the 15 solutions to the orbit modeling of Romanowsky et al. is found to have an amount and concentration of DM consistent with CDM predictions.
1 Introduction
The quantity of dark matter lying in the outskirts of luminous elliptical galaxies is a hotly debated topic (see Romanowsky, Napolitano, Stoehr, in these proceedings). There is a wide consensus that, given their flat rotation curves, spiral galaxies must be embedded within dark matter halos, unless one resorts to modifying physics (e.g. MOND, see McGaugh in these proceedings). Moreover, dissipationless cosmological -body simulations lead to structures, whose halos represent most (Hayashi et el. 2004) if not all (Stoehr 2006) spiral galaxies.
If elliptical galaxies originate from major mergers of spiral galaxies (Toomre 1977; Mamon 1992; Baugh et al. 1996; Springel et al. 2001), then they too should possess dark matter halos. However, inferring the presence of dark matter halos in ellipticals is difficult, because the velocity dispersions of the usual kinematical tracer, stars, can only be measured out to (effective radii, containing half the projected light). Moreover, the mass distribution depends on the radial variation of the velocity anisotropy, and one cannot solve for both, unless one assumes no rotation and makes use of the 4th order moment (kurtosis) of the velocity distribution (van der Marel & Franx 1993; Gerhard 1993; Łokas & Mamon 2003).
Using planetary nebulae (PNe) as tracers of the dark matter at large radii, Romanowsky et al. (2003) found low velocity dispersions for their outermost PNe, which after some simple Jeans modeling and more sophisticated orbit modeling led them to conclude to a dearth of dark matter in ordinary elliptical galaxies. This result is not expected in the standard model of formation of structure in the Universe and of galaxies in particular.
This has led us (Dekel et al. 2005) to analyze the final outputs of -body simulations of spirals merging into ellipticals (Cox et al. 2004, Stoehr, in these proceedings). Dekel et al. show that the line-of-sight velocity dispersions of their simulated merger remnants are as low as the PNe dispersions measured by Romanowsky et al. thus removing an important thorn in the standard model of galaxy formation in a CDM Universe. One is led to wonder how could the kinematical analysis of Romanowsky et al. lead to a lack of dark matter, while the dynamical analysis of Dekel et al. matches the same set of observations with simulations including normal amounts of dark matter.
To explain this discrepancy, it is useful to focus first on some important aspects of kinematical modeling.
2 Kinematical modeling
2.1 Is the total density profile NFW-like?
Merritt et al. (2005) have reported that the projected density profiles of the halos found in dissipationless cosmological -body simulations are well fit by Sersic (1968) models, with the shape parameter . This result is not surprising, because these halos are known to be fairly well fit by the Navarro, Frenk, & White (1996, hereafter NFW) model, and Łokas & Mamon (2001) had already shown that projected NFW models resemble Sérsic models with .
One should not conclude that elliptical galaxies, which are known to have Sérsic surface brightness profiles (Caon et al. 1993), are NFW models, because (Łokas & Mamon 2001): 1) the range of shape parameters is much narrower for the simulated halos () than for observed ellipticals ( or 10); 2) the normalization of a divergent NFW model with a convergent Sérsic model leads to absurd total at ; 3) given the increase of with luminosity (Caon et al. 1993) and the decrease of halo concentration with mass (Navarro et al. 1997; Jing & Suto 2000; Bullock et al. 2001), the trend of increasing best-fit for increasing concentration (Łokas & Mamon 2001) implies the unlikely trend that elliptical galaxy luminosity decreases with increasing halo mass.
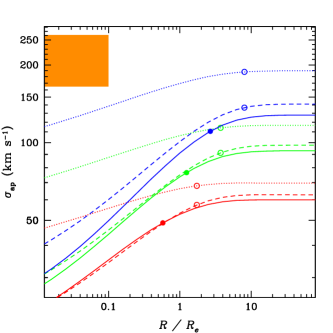
Now, it is not clear whether the NFW-like structures found in dissipationless cosmological simulations represent the dark matter component, i.e. are set by the dissipationless nature of dark matter, or if they represent the total matter, i.e. are set by the global gravitational field. However, if one assumes that the NFW-like models represent the total mass density of elliptical galaxies, one runs into trouble in two ways (Mamon & Łokas 2005a): 1) as decreases below , the local falls to values well below the of the stellar populations representing ellipticals; 2) the aperture () velocity dispersions are very much below the observed values (left plot of Fig. 1) for a given luminosity (the Faber & Jackson 1976 relation). This occurs with the NFW model, but also with the more recent 3D-Sérsic model that Navarro et al. (2004, hereafter Nav04) found to fit better the simulated halos, as well as the steeper models with inner slope of proposed by Fukushige & Makino (1997); Moore et al. (1999) and Jing & Suto (2000). Given the limited spatial resolution of cosmological simulations (symbols in Fig. 1), the observed velocity dispersions could be recovered if the total density profile sharply steepens (to a slope steeper than ) just at , but this seems a little far fetched.
The low predicted local s and aperture velocity dispersions imply that NFW-like models cannot represent the total matter. The simplest explanation is that these models represent the dark matter component only and that a more concentrated stellar component must dominate NFW-like dark matter within .
2.2 Weighing the dark matter out to the virial radius
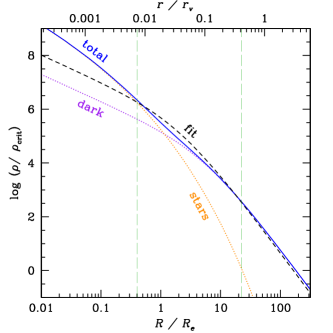
The key physical parameter for the dark matter is its mass within the virial radius, , or equivalently its . Alas, given that observations are very hard to obtain beyond (), even with external mass tracers such as PNe and globular clusters, one requires a strong extrapolation to weigh the dark matter component out to . Mamon & Łokas (2005b) find that the observed velocity dispersion at is a very weak function of at . Conversely, at is a strong (8th power) function of the observed at . Figure 2 illustrates how badly one underestimates at by assuming an NFW dark matter model instead of the latest 3D-Sérsic model of Navarro et al. (2004) and neglecting radial velocity anisotropy.

Assuming an isotropic NFW model instead of the slightly radial Navarro et al. model that matches much better the halos in cosmological -body simulations the derived at is 60% too low. But if the orbits are as radial as found by Dekel et al. in the merger simulations (see Stoehr, in these proceedings), then is underestimated by a factor 2.4.
3 Dynamical modeling
We have analyzed the end products of -body+gas (SPH) simulations of merging equal mass spirals, made of a disk, a bulge, a gas disk, and a dark matter halo (see Stoehr et al., in these proceedings). The merger remnants not only show stellar surface density profiles that almost perfectly match the observed surface brightness profiles of ellipticals (an old result), but more interestingly, they display the same line-of-sight stellar velocity dispersion profiles as the stellar and PN velocity dispersion profiles observed in ellipticals (Dekel et al. 2005, see Stoehr et al., in these proceedings). These simulations highlight how the dark matter and stellar kinematics are decoupled. The stellar component is found to dominate the dark matter component within whereas one expects from the dark matter profiles of cosmological -body simulations and the observed surface brightness profiles, that the dark matter only dominates the stars at (Mamon & Łokas 2005b). Thus the dark matter has readjusted itself in the inner regions where the stars dominate the gravitational potential.
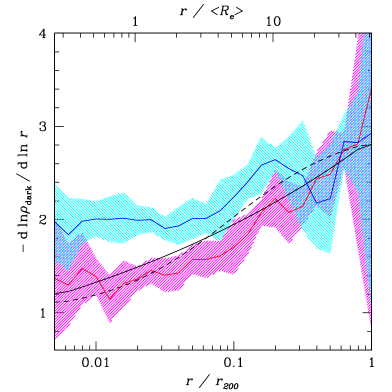
Figure 3 shows that for runs with a low initial gas content the dark matter slopes are in good agreement with those seen in halos of dissipationless CDM simulations. However, the runs with a high gas content show higher slopes, as qualitatively expected since the dark matter should respond to the more predominant inner baryons (see Gnedin, these proceedings).
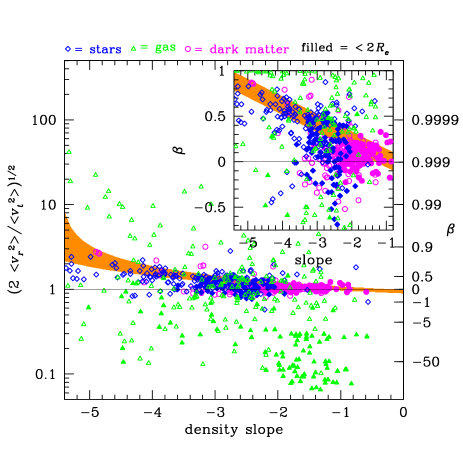
Hansen & Moore (2006) noticed that in dissipationless simulations, (both cosmological and non-cosmological), the radial profiles of velocity anisotropy and density slope are strongly correlated, which should, in principle, allow the lifting of the mass/anisotropy degeneracy (see Sec. 1). Figure 4 shows that in the merger simulations of spiral galaxies made of stars, dark matter and gas, analyzed by Dekel et al., each component obeys its own correlation (or lack thereof) between anisotropy and density slope. The gas relation shows a rotating inner disk, and is very dispersed, presumably because of its dissipative nature. The dark matter relation is isotropic even in regions of steep density profiles, in contrast with the prediction of Hansen & Moore. Interestingly, the stellar relation is close to that of Hansen & Moore, but with over double its dispersion and with roughly 0.15 lower. Presumably the stellar kinematics are affected by the high dispersion of the dissipative gas kinematics from which a few stars are formed.
The simulations also help to understand what drives the 4th order, gaussian-weighted, velocity moment, . Figure 5 displays the velocity distribution and values of the PNe observed in two elliptical galaxies as well as the particle velocity distributions in the same simulation run seen in two orthogonal projections.
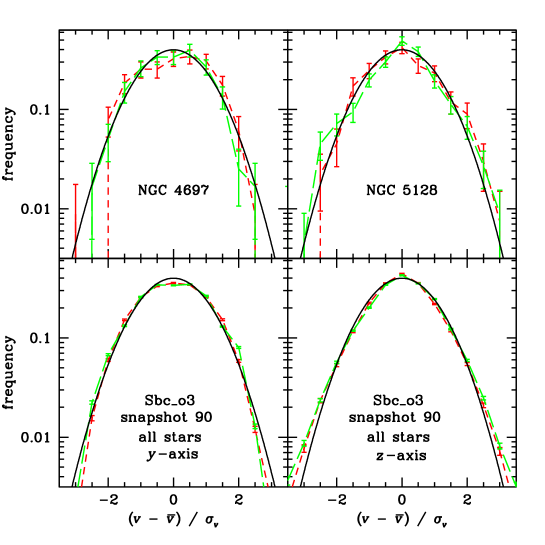
Interestingly, the same snapshot viewed along two orthogonal directions produces either flat-topped or cuspy velocity distributions. Although the 3D configuration is radially anisotropic beyond , the parameter is either negative (left plot) or positive (right plot). The negative is caused by a small amount of rotation in the system viewed perpendicular to the angular momentum axis.
4 Understanding the low outer velocity dispersions
4.1 Lack of equilibrium?
Although the general Jeans equation in spherical symmetry can be written
when kinematical modelers of observations write the Jeans equation, they always omit the terms in and the term with a partial time-derivative. With these omissions, the derived mass in a shell is
| (1) |
Figure 6 plots the ratio of .
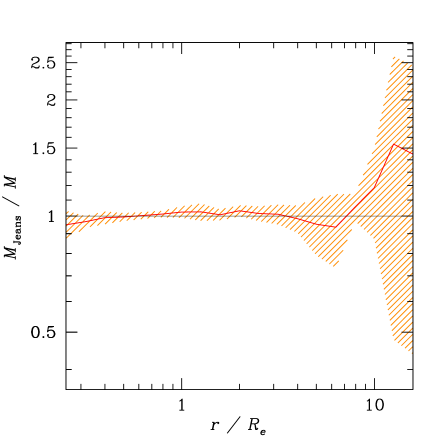
One sees that the Jeans mass is equal to the true mass within a few percent out to roughly . This means that the system is close enough to being stationary that one can safely omit the time-derivative in the Jeans equation. Beyond , the crossing time is long and the system has not had time to relax to a stationary state.
4.2 How much dark matter from orbital modeling?
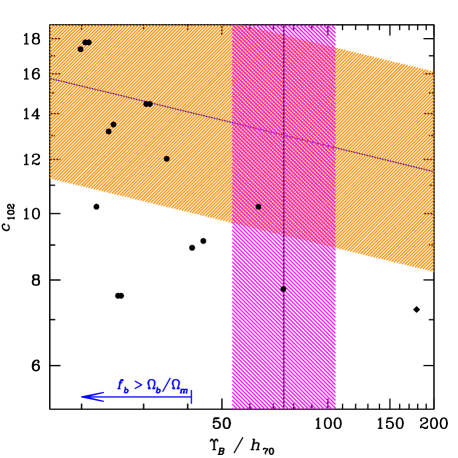
While Romanowsky et al. (2003) announced that their orbit modeling of NGC 3379 yielded no solutions with appreciable amounts of dark matter, a closer inspection of their 15 orbit solutions (Fig. 7), shows that 2 solutions have the expected relatively high at the virial radius, one of which has the expected dark matter concentration, while an additional solution later found by Romanowsky (priv. comm.) has an even higher . Therefore, the kinematic data (stars+PN) analyzed by Romanowsky et al. is in fact consistent with the CDM predictions!
References
- Baugh et al. (1996) Baugh, C. M., Cole, S., & Frenk, C. S. 1996, MNRAS, 283, 1361
- Bullock et al. (2001) Bullock, J. S., Kolatt, T. S., Sigad, Y., et al. 2001, MNRAS, 321, 559
- Caon et al. (1993) Caon, N., Capaccioli, M., & D’Onofrio, M. 1993, MNRAS, 265, 1013
- Cox et al. (2004) Cox, T. J., Primack, J., Jonsson, P., & Somerville, R. S. 2004, ApJ, 607, L87
- de Vaucouleurs & Capaccioli (1979) de Vaucouleurs, G. & Capaccioli, M. 1979, ApJS, 40, 699
- Dekel et al. (2005) Dekel, A., Stoehr, F., Mamon, G. A., et al. 2005, Nature, 437, 707, arXiv:astro-ph/0501622
- Eke et al. (2005) Eke, V. R., Baugh, C. M., Cole, S., Frenk, C. S., & Navarro, J. F. 2005, MNRAS, submitted, arXiv:astro-ph/0510643
- Faber & Jackson (1976) Faber, S. M. & Jackson, R. E. 1976, ApJ, 204, 668
- Fukushige & Makino (1997) Fukushige, T. & Makino, J. 1997, ApJ, 477, L9
- Gerhard (1993) Gerhard, O. E. 1993, MNRAS, 265, 213
- Hansen & Moore (2006) Hansen, S. & Moore, B. 2006, MNRAS, in press, arXiv:astro-ph/0411473
- Jing & Suto (2000) Jing, Y. P. & Suto, Y. 2000, ApJ, 529, L69
- Łokas & Mamon (2001) Łokas, E. L. & Mamon, G. A. 2001, MNRAS, 321, 155
- Łokas & Mamon (2003) Łokas, E. L. & Mamon, G. A. 2003, MNRAS, 343, 401
- Mamon (1992) Mamon, G. A. 1992, ApJ, 401, L3
- Mamon & Łokas (2005a) Mamon, G. A. & Łokas, E. L. 2005a, MNRAS, 362, 95
- Mamon & Łokas (2005b) Mamon, G. A. & Łokas, E. L. 2005b, MNRAS, 363, 705
- Merritt et al. (2005) Merritt, D., Navarro, J. F., Ludlow, A., & Jenkins, A. 2005, ApJ, 624, L85
- Moore et al. (1999) Moore, B., Quinn, T., Governato, F., Stadel, J., & Lake, G. 1999, MNRAS, 310, 1147
- Napolitano et al. (2005) Napolitano, N. R., Capaccioli, M., Romanowsky, A. J., et al. 2005, MNRAS, 357, 691
- Navarro et al. (1996) Navarro, J. F., Frenk, C. S., & White, S. D. M. 1996, ApJ, 462, 563
- Navarro et al. (1997) Navarro, J. F., Frenk, C. S., & White, S. D. M. 1997, ApJ, 490, 493
- Navarro et al. (2004) Navarro, J. F., Hayashi, E., Power, C., et al. 2004, MNRAS, 349, 1039
- Romanowsky et al. (2003) Romanowsky, A. J., Douglas, N. G., Arnaboldi, M., et al. 2003, Science, 301, 1696
- Sato et al. (2000) Sato, S., Akimoto, F., Furuzawa, A., et al. 2000, ApJ, 537, L73
- Sersic (1968) Sersic, J. L. 1968, Atlas de galaxias australes (Cordoba, Argentina: Observatorio Astronomico, 1968)
- Springel et al. (2001) Springel, V., White, S. D. M., Tormen, G., & Kauffmann, G. 2001, MNRAS, 328, 726
- Stoehr (2006) Stoehr, F. 2006, MNRAS, 365, 147
- Toomre (1977) Toomre, A. 1977, in The Evolution of Galaxies and Stellar Populations, ed. B. M. Tinsley & R. B. Larson (New Haven: Yale University Press), 401–416
- van der Marel & Franx (1993) van der Marel, R. P. & Franx, M. 1993, ApJ, 407, 525