Permitted Oxygen Abundances and the Temperature Scale of Metal-Poor Turn-Off Stars
Abstract
We use high quality VLT/UVES published data of the permitted O I triplet and Fe II lines to determine oxygen and iron abundances in unevolved (dwarfs, turn-off, subgiants) metal-poor halo stars. The calculations have been performed both in LTE and NLTE, employing effective temperatures obtained with the new infrared flux method (IRFM) temperature scale by Ramírez & Meléndez, and surface gravities from Hipparcos parallaxes and theoretical isochrones. A new list of accurate transition probabilities for Fe II lines, tied to the absolute scale defined by laboratory measurements, has been used. Interstellar absorption has been carefully taken into account by employing reddening maps, stellar energy distributions and Strömgren photometry.
We find a plateau in the oxygen-to-iron ratio over more than two orders of magnitude in iron abundance ( [Fe/H] ), with a mean [O/Fe] = 0.5 dex ( = 0.1 dex), independent of metallicity, temperature and surface gravity. The flat [O/Fe] ratio is mainly due to the use of adequate NLTE corrections and the new IRFM temperature scale, which, for metal-poor F/early G dwarfs is hotter than most Teff scales used in previous studies of the O I triplet.
According to the new IRFM Teff scale, the temperatures of turn-off halo stars strongly depend on metallicity, a result that is in excellent qualitative and quantitative agreement with stellar evolution calculations, which predict that the Teff of the turn-off at [Fe/H] = is about 600-700 K higher than that at [Fe/H] = . Recent determinations of H temperatures in turn-off stars are in excellent relative agreeement with the new IRFM Teff scale in the metallicity range [Fe/H] , with a zero point difference of only 61 K.
Subject headings:
Atomic data - stars: Population II - stars: fundamental parameters - stars: atmospheres - stars: abundances - Sun: abundances - ISM: cosmic rays - Galaxy: halo1. Introduction
The importance of the oxygen abundance in metal-poor stars has been strongly emphasized in the literature, as well as the problems related to its determination. There is currently no consensus as to whether the [O/Fe] ratio in halo stars is approximately constant ([O/Fe] 0.4 - 0.5) or steeply increases with decreasing [Fe/H] ([O/Fe] -0.35 [Fe/H]). The discrepancy is due to problems in the modeling of the different spectral features used to estimate the oxygen abundance, which are very hard to detect in the same star.
Due to its high excitation potential, the permitted O I triplet at 0.77m is mainly observed in FG dwarfs and subgiants, being very faint (yet detectable) in metal-poor early K stars. The low excitation potential forbidden lines [O I] at 0.63 m are detected in giants and cool subgiants, and barely detectable in dwarfs. Molecular OH lines are observed in the ultraviolet (electronic transitions at 0.3 m) and in the infrared (vibrational-rotational lines at 1.5 and 3 m). Both observations are difficult: the UV OH lines are close to the atmospheric cutoff and most CCDs have low sensitivity in the UV, while the weak IR OH lines require extremely high S/N. The UV OH lines are relatively strong and observed in FGK metal-poor stars, while the very weak IR OH lines are only observed in cool stars with Teff 5000 K.
The observed spectra by themselves do not allow a direct measurement of the oxygen abundance, so a careful modeling must be performed. Since the spectral features are sensitive to both effective temperature and surface gravity, reliable atmospheric parameters must be used. The analysis is complicated by the presence of both NLTE (mainly affecting the O I triplet) and granulation (crucial for the molecular OH lines) effects.
Analyses of the forbidden [O I] (e.g. Barbuy 1988; Sneden et al. 1991) and infrared OH lines (Meléndez, Barbuy & Spite 2001) seem to show a flat [O/Fe], or a small increase of about 0.1-0.2 dex per a factor of 10 (1 dex) in metallicity, from [O/Fe] 0.3 at [Fe/H] = 1.5 to [O/Fe] 0.4-0.5 at [Fe/H] = 2.5 (Sneden & Primas 2001; Meléndez & Barbuy 2002). Yet, the 1D analysis of the forbidden line by Nissen et al. (2002) shows a continuous increase of [O/Fe] for lower metallicities, reaching [O/Fe] +0.7 at [Fe/H] = , but after correcting for 3D effects they found a plateau at [O/Fe] +0.3 in the range 2.0 [Fe/H] 0.7, and an increase in [O/Fe] for lower [Fe/H]. The recent 1D analysis of [O I] in subgiants by García Pérez et al. (2005) shows a mean [O/Fe] +0.5, with a very small increase of 0.09 dex in [O/Fe] for a decrease of 1 dex in [Fe/H].
On the other hand, studies of the permitted O I triplet (e.g. Abia & Rebolo 1989; Cavallo, Pilachowski & Rebolo 1997; Israelian et al. 1998, 2001; Mishenina et al. 2000) and the ultraviolet OH lines (Israelian et al. 1998, 2001; Boesgaard et al. 1999) show a steep monotonic increase of [O/Fe] for lower metallicities, reaching [O/Fe] = +1.1 at [Fe/H] = . However, other studies of the triplet show a lower (or zero) slope. For example, the analysis of the triplet in turn-off stars by Akerman et al. (2004, hereafter Ake04) shows only a mild increase of [O/Fe] with metallicity, with [O/Fe] +0.4 at [Fe/H] = 1 and [O/Fe] +0.7 at [Fe/H] = 3.
Asplund & García Pérez (2001) have shown that 1D model atmospheres overestimate the abundances obtained from UV OH lines by as much as 0.9 dex at [Fe/H] = (see also 8.2 and Asplund 2005), and when the UV OH lines are analyzed with 3D model atmospheres, the [O/Fe] ratio in metal-poor dwarfs is in good agreement with the results obtained in giants from the forbidden lines. Note also that the 1D analysis of the UV OH lines by Bessell et al. (1991) resulted in low [O/Fe] ratios, as is also the case of the work on UV OH lines in subgiant stars by García Pérez et al. (2005), which shows 1D oxygen-to-iron ratios of [O/Fe] +0.5 dex. Hence, analyses of three oxygen abundance features (UV OH lines, IR OH lines, [O I] lines) roughly agree in a somewhat flat (and low) [O/Fe] ratio in the metallicity range [Fe/H] 1. However, the high oxygen abundances obtained from the O I triplet have been difficult to reconcile with the low oxygen abundance derived from the forbidden lines (Spite & Spite 1991). Nissen et al. (2002) found that 1D analysis results in agreement between the [O I] line and the triplet, but when the lines are analyzed employing 3D model atmospheres the oxygen abundances obtained from the triplet are about 0.2 dex larger than those from the [O I] line (Nissen et al. 2002).
The disagreement between the O I triplet and the forbidden [O I] lines also occurs in metal-poor giants and subgiants (Cavallo et al. 1997; Fulbright & Johnson 2003; García Pérez et al. 2005). Israelian et al. (2004) undertook the first NLTE analysis in very metal-poor CN-rich giants, showing that there are serious problems with standard 1D model atmospheres of those stars, even when NLTE effects are taken into account, producing a serious conflict between the oxygen abundances obtained from the forbidden line and the triplet (Israelian et al. 2004). The use of CN-enhanced model atmospheres have an important impact on the thermal structure of model atmospheres of metal-poor CN-enhanced ([C/Fe] = +2, [N/Fe] = +2) giants (Masseron et al. 2005), which affect the abundances from a few tenths of a dex up to 1.5 dex in extreme cases, with respect to standard (solar-scaled abundances) 1D models (Masseron et al. 2005). Hence, for metal-poor cool giants with extreme compositions, model atmospheres computed with the corresponding CNO overabundances may partly relieve the problems found by Israelian et al. (2004).
The use of 3D + NLTE seems to improve the situation for the oxygen abundances derived from the O I triplet and the [O I] line. Employing 1.5D NLTE calculations in a 3D model atmosphere of the metal-poor star HD 140283, Shchukina, Trujillo Bueno & Asplund (2005) have found that the oxygen abundances obtained from the O I and [O I] lines agree within 0.1 dex, which is an important achievement considering the observational uncertainties for the [O I] line.
Previous studies of the O I triplet employing a hot temperature scale resulted in a flat and low [O/Fe] (King 1993; Carretta, Gratton & Sneden 2000). Note that another reason why Carretta et al. (2000) obtained low [O/Fe] ratios is the use of large NLTE corrections of the O I triplet by Gratton et al. (1999), as pointed out by Takeda (2003).
King (2000) studied the influence of stellar parameters and NLTE iron abundances (Thévenin & Idiart 1999) on the [O/Fe] ratio obtained from UV OH, [O I] and O I lines. The [O/Fe] values obtained by King (2000) using the O I triplet and the UV OH lines are considerably reduced with respect to the high [O/Fe] ratios of the original studies (Tomkin et al. 1992; Boesgaard et al. 1999), but they are still about 0.1-0.2 dex larger than those obtained from the [O I] lines (King 2000). Partly the low [O/Fe] ratios obtained by King (2000) can be explained by the large NLTE Fe I corrections by Thévenin & Idiart (1999), which increase the iron abundance by +0.2-0.3 dex, hence lowering [O/Fe] by 0.2-0.3 dex.
The preliminary NLTE analysis of the O I triplet by Primas et al. (2001) also resulted in a flat [O/Fe] ratio for halo dwarfs down to [Fe/H] = 2.4, independent of the Teff scale employed. Primas et al. found [O/Fe] +0.4 using the Teff scale by Alonso et al. (1996), and [O/Fe] +0.5 with both the Teff scale by Carney (1983) and temperatures from Thévenin & Idiart (1999).
The observed [O/Fe] ratio in halo stars provides tight constraints on models of Galaxy formation (e.g. Tinsley 1979; Wheeler, Sneden & Truran 1989; McWilliam 1997; Chiappini, Romano & Matteucci 2003). If the formation of the halo was fast, then the [O/Fe] ratio of halo stars should be roughly constant, because Type Ia supernovae, which originate from long lived low mass stars, would not have had enough time to lower the [O/Fe] ratio of the ISM from which the halo stars we observe today were formed. Furthermore, the scatter of the [O/Fe] ratio tells us the efficiency of the ISM in homogenizing (mixing) the ejecta of Type II supernovae (Scalo & Elmegreen 2004).
The oxygen abundance is extremely important in studies of the production of LiBeB by Galactic cosmic ray (GCR) spallation (e.g. Prantzos, Cassé & Vangioni-Flam 1993; Fields & Olive 1999; Ramaty et al. 2000; Vangioni-Flam, Cassé & Audouze 2000), especially for stars with [Fe/H] , where current models struggle to explain the non-zero isotopic 6Li/7Li ratios recently found in metal-poor dwarfs down to [Fe/H] = (Asplund et al. 2005). The GCR production of 6Li depends on the adopted [O/Fe] ratio, and only models with extremely high oxygen abundances can account for the 6Li detection at [Fe/H] , but introduce the problem of large overproduction of 6Li at higher metallicities (Rollinde et al. 2005). Given the problems faced by GCR models to explain the 6Li observed in halo stars, several authors have suggested that the origin of 6Li may be pre-Galactic (Jedamzik 2000, 2004; Asplund et al. 2005; Rollinde et al. 2005). A low [O/Fe] ratio in metal-poor stars brings support for pre-Galactic 6Li, since in this case GCR can not produce enough 6Li (see also Prantzos 2005).
Here, we analyze recent high quality VLT/UVES data of the O I triplet and Fe II lines from Ake04 and Nissen et al. (2004, hereafter N04), respectively. We show that the use of NLTE corrections and the new infrared flux method (IRFM) temperature scale by Ramírez & Meléndez (2005a,b; hereafter RM05a,b), which for metal-poor turn-off stars is hotter than previous temperature scales, results in a low and flat [O/Fe] ratio in metal-poor stars.
We also compare the IRFM temperature of turn-off stars (employing the new IRFM Teff scale) with those expected from stellar evolution, showing that the strong metallicity dependence of the turn-off temperatures are very well reproduced by stellar evolution models.
2. Sample
Our sample stars consists of 31 F and G stars, which were selected by Ake04 and N04 to be close to the main-sequence turn-off and with halo kinematics. The equivalent widths of the O I triplet and Fe II lines were taken from Ake04 and N04, respectively. The superb VLT/UVES data were obtained at a resolving power = 60 000 with 4 pixels per spectral resolution element and a typical S/N (per pixel) = 200-300 (Ake04, N04).
We have verified (within the uncertainties) that the sample stars have halo kinematics. We computed UVW velocities from their proper motions, radial velocities and distances (mainly from Hipparcos parallaxes, but also from Strömgren photometry and isochrones), with data obtained from the SIMBAD database. The main uncertainty is due to the uncertainty in distance, which in some cases leads to an error of a few tens of km s-1 in the UVW velocities.
3. Atomic Data and Solar Abundances
3.1. The O I triplet
The oscillator strengths of the O I triplet have been adopted from the NIST database (Wiese, Fuhr & Deters 1996). We employed an interaction broadening constant [O I] = 0.84 , obtained from the collision broadening cross sections given by Barklem, Piskunov & O’Mara (2000). Our O I atomic model for the NLTE calculations is based on data by Carlsson & Judge (1993). The NLTE spectrum synthesis code NATAJA was employed in the present study. For details see Shchukina et al. (2003, 2005) and Shchukina & Trujillo Bueno (2001).
Equivalent widths () of the O I triplet have been measured employing the National Solar Observatory (NSO) FTS solar flux spectrum by Hinkle et al. (2000), which is essentially the same spectrum previously published by Kurucz et al. (1984, hereafter K84), but corrected for telluric absorption at 5000 Å. We have checked that the NSO FTS data are in the same scale as those of the VLT/UVES data, using a high resolution (R 105) UVES reflected solar spectrum.111 http://www.eso.org/observing/dfo/quality/UVES/ As shown in Table 1, both measurements are in excellent agreement (see 3.2 for a comparison between Fe II lines), and they also agree very well with the predicted of the O I triplet given by Asplund et al. (2004, hereafter Asp04).
Employing a Kurucz overshooting model atmosphere (Castelli, Gratton & Kurucz 1997) and from both the K84 (Hinkle et al. 2000) and VLT/UVES solar spectrum we found A(O) = 8.65 ( = 0.03). This is in very good agreement to other recent NLTE determinations of the oxygen abundance using the O I triplet. For example, Meléndez (2004) found A(O) = 8.68 employing a spatially and temporally averaged 3D solar model, and A(O) = 8.67 with a Kurucz solar model. Full 3D + NLTE calculations by Asp04 and Allende Prieto et al. (2004) resulted in A(O) = 8.64 and 8.70, respectively, while A(O) = 8.70 was obtained by Shchukina et al. (2005) with 1.5D NLTE calculations in a 3D solar model (Asplund et al. 2000). The recommended solar oxygen abundance by Asp04 is A(O) = 8.66 0.05, which is based on 3D analyses of the forbidden, permitted and infrared OH lines of the = 0, 1 sequences. If we also consider the solar oxygen abundance obtained from the first-overtone OH lines, then the weighted mean solar O abundance is 8.64 (Meléndez 2004). The value adopted in this work is A(O)⊙ = 8.65.
3.2. Fe II lines
As previously discussed in the literature (e.g. Lambert et al. 1996; Asplund et al. 2000; Gehren, Korn & Shi 2001), there is a lack of accurate experimental -values for Fe II lines. With the advent of 8-10 m telescopes and very efficient spectrographs, high S/N high spectral resolution data can be readily obtained, and therefore one of the main limitations for accurate stellar abundance work is the uncertainty in the transition probabilities of Fe II lines.
In the present work the -values of Fe II lines are from a revised version of the list of Meléndez & Barbuy (2002), where relative -values within a given multiplet were taken from theoretical determinations and the absolute scale of the transition probabilities of each multiplet was determined from laboratory lifetimes and branching ratios. The approach of Meléndez & Barbuy (2002) has the advantage of improving the accuracy of the -values while preserving the laboratory scale of the oscillator strengths. We stress here that a single correction factor can not be applied to the whole set of theoretical -values, since the theoretical calculations should only be reliable within a single multiplet. This is why each multiplet needs to be corrected individually, in order to put the whole set of multiplets into the absolute laboratory scale.
The revised Fe II line list takes into account new laboratory measurements by Schnabel et al. (2004) and new theoretical calculations by R. L. Kurucz222http://kurucz.harvard.edu/. Further details and the complete list of Fe II lines for the optical region will be presented in Meléndez & Barbuy (2006). The subset of -values used for the solar and stellar analysis are given in Table 2. The interaction broadening constants () of the Fe II lines were obtained from the cross sections recently computed by Barklem & Aspelund-Johansson (2005).
As an example of the quality of the new -values, in Fig. 1 are shown the solar iron abundances obtained from Fe II lines by Hannaford, Lowe & Grevesse (1992, hereafter H92), and the rescaled abundances (A(Fe)new = A(Fe)H92 + log gfH92 - log gfnew) due to the new -values given in the present work. As can be seen, significant progress has been achieved, reducing the scatter from = 0.07 dex (-values from H92) to = 0.03 dex (new -values). The mean solar iron abundance from H92 is 7.47, and with the improved -values is 7.46. Similar comparisons with other works in the literature also show that our new -values lead to a decrease in the line-to-line scatter of the solar iron abundance (Meléndez & Barbuy 2006).
It is also interesting to compare our new -values of Fe II lines with the solar -values determined by Gurtovenko & Kostik (1989, hereafter GK89), which should be reliable in a relative scale, hence allowing to check our relative (theoretical) oscillator strengths. A comparison between 20 lines in common shows an excellent relative agreement, with a = 0.038 dex, but with a systematic difference of 0.18 dex between both sets, that is mainly due to the high solar Fe abundance adopted by GK89.
In order to determine the solar iron abundance using our new -values of Fe II lines, we selected Fe II lines with the cleanest profiles in the NSO FTS solar flux spectrum (Hinkle et al. 2000; K84). As previously noted by H92, the lines at 5525.1 and 5627.5 Å are significantly perturbed at the wings. H92 included these lines by fitting Gaussian lineshapes, however, we discarded them because the deblended profiles were significantly asymmetric. Our measured from the NSO solar flux spectrum, which are reported in Table 2, are in excellent agreement with our measurements from the VLT/UVES reflected solar spectrum (3.1), with a mean difference (K84 - UVES) of only 0.1 1.2 mÅ (= 0.1 2.8%).
Our Fe I + Fe II atomic model for the NLTE calculations includes over 250 levels and nearly 500 radiative transitions. The model is similar to that used by Shchukina & Trujillo Bueno (2001) and Shchukina et al. (2003, 2005).
Employing the Kurucz model atmosphere we obtained a solar iron abundance A(Fe II)NLTE = A(Fe II)LTE = 7.45 ( = 0.04). This value is in good agreement with 1.5D+NLTE calculations in a 3D solar model (Asplund et al. 2000) by Shchukina & Trujillo Bueno (2001), who found A(Fe I) = 7.50, and also in good agreement with previous 1D and 3D results from Fe II lines by H92, Schnabel, Kock & Holweger (1999), and Asplund et al. (2000), who obtained A(Fe II) = 7.47 (1D), 7.42 (1D) and 7.45 (3D), respectively. We adopted A(Fe II)⊙ = 7.45.
We end this section by showing the effect of different model atmospheres on the solar iron abundance and its , employing 3 different sets of -values for 13 Fe II lines in common between the present work, H92 and GK89. The calculations were performed using the same set of input equivalent widths (Table 2) and vt = 0.9 km s-1. We employed the Kurucz overshooting model, a MARCS model (Asplund et al. 1997), a spatially and temporally averaged 3D solar model atmosphere (3D, Asp04), and the Holweger & Müller (1974, hereafter HM74) solar model. The results are shown in Table 3. As can be seen, the Fe abundance obtained from Fe II lines has only a small dependence on the adopted model atmosphere. A line-to-line abundance scatter of 0.05 dex is obtained for our -scale and the solar -scale of GK89, while the worst scatter (0.11 dex) is obtained with the H92 -values. Certainly, can not be used as the only criterion for the quality of a -scale, since the scatter depends on both the adopted model atmosphere (see Table 3) and vt (see Gehren et al. (2001) and Kostik, Shchukina & Rutten (1996) for details on the effects of vt), but a good -scale should give a small in order to give consistent results when only few lines are available for analysis.
4. Reddening
Before colors are used to determine Teff, they have to be corrected for interstellar absorption. A good determination of the reddening is specially important for metal-poor turn-off stars due to the steep slopes of their temperature vs. color relations. values were estimated employing: i) several reddening maps (); ii) relative stellar flux distributions (); and iii) Strömgren photometry (), as given by N04. Each method is described below.
4.1. Reddening maps
Several studies show that nearby stars closer than 75 pc have negligible reddening, since most stars within this distance are located inside the “Local Bubble” of radius 70-75 pc (e.g. Lallement et al. 2003; Breitschwerdt et al. 2000; Sfeir et al. 1999; Leroy 1999; Vergely et al. 1998). 333Note, however, that the Local Bubble is by no means spherical, but roughly within 75 pc of the Sun the extinction is negligible, although in some cases even stars as far as 100 pc can be almost unreddened
We consider several extinction surveys (e.g. Fitzgerald 1968; Neckel & Klare 1980; Arenou et al. 1992, hereafter A92) included in a Fortran code by Hakkila et al. (1997, hereafter H97), adopting the weighted-average with the inverse square of the errors as weights. The A92 extinction model included in the H97 code seems to systematically overestimate the reddening for stars with a distance 0.5 kpc, as shown by Chen et al. (1998, hereafter C98), who found that the average extinction derived from Strömgren photometry is about 40% lower than the average extinction derived from the A92 maps. Instead of discarding values for stars closer than 500 pc, we doubled its error (equivalent to lower its weight by a factor of 4) and corrected by a factor of 0.6 for stars in this distance range, as suggested by the results of C98.
We also employ the empirical reddening laws by Bond (1980, hereafter B80) and C98, which are both cosecant laws dependent on distance and Galactic latitude, although for low latitude (b 10∘) objects closer than 1 kpc C98 law also includes a dependence with Galactic longitude.
Reddening corrections were also obtained from the map by Schlegel et al. (1998, hereafter S98), which is based on COBE/DIRBE and IRAS observations. Note that this map seems to systematically overestimate the reddening by about 20% (e.g. Arce & Goodman 1999; Chen et al. 1999; Dutra et al. 2003a,b), and some studies argue for a systematic zero point error in S98 map. For example, Hudson (1999) found that the obtained from S98 is about 0.016 mag higher than the reddening of 86 RR Lyrae given by Burstein & Heiles (1978). We have made the same comparison for the sample of RR Lyrae given in Hudson (1999), and have found that indeed for 0.2, should be corrected by 0.02 mag. Burstein (2003) confirmed the existence of a zero point difference of 0.02 mag between the maps of S98 and those from Burstein & Heiles (1978).
We adopted the following correction for the S98 maps:
= 0.9 - 0.01.
The different prescriptions for the determination of were combined as follows:
-
•
= 0.0 for stars within 75 pc.
-
•
For stars with 75 pc 100 pc, = ( + ( + )/2 + 2 0.0)/4. The factor 2 0.0 considers a 50 % chance of zero reddening.
-
•
If a star has 100 pc and b 45 ∘, = ( + )/(), where is the square root of the number of maps used in H97 and = (+1.5)(sinb)1.5, with in kpc. This empirical parametrization gives a high weight to the S98 map for high-latitude and/or distant objects, and a weight essentially zero for low-latitude stars.
-
•
Stars with 100 pc and b 45 ∘, = ( + + ( + )/2)/(). The weights and are equal to the previous case, except that = 0 if 2 (in some cases this restriction was relaxed, especially for very distant objects with ).
-
•
If after applying the above criteria , then we adopted = .
The distances employed here were estimated from Hipparcos parallaxes, Strömgren photometry (N04) and isochrones (see ).
4.2. Extinction from Stellar Energy Distributions
The observed relative spectral energy distribution (SED) of a star is defined primarily by its Teff and by interstellar extinction. The right value can be used to correct the observed SED, recovering thus the unredenned SED. Hence, given several observed colors (X-Y)i and highly accurate color vs. Teff relations, the minimum scatter between different color temperatures (Teff(X-Y)i) should be obtained for the right choice of , denoted by .
We employed our IRFM Teff scale (RM05b), which includes seventeen colors from the blue to the near infrared, allowing for a good estimate of . Considering that our Teff calibrations have high internal accuracy, the main uncertainty in the determination of arises from photometric errors. We typically employed eleven colors for each sample star (), alleviating in this way the impact of photometric errors.
4.3. Extinction from Strömgren Photometry
N04 determined interstellar reddening for the sample stars employing Strömgren - photometry and the calibration by Schuster & Nissen (1989), including a zero-point correction of +0.005 mag (Nissen 1994).
The given by N04 was transformed to applying: = 1.35 (Crawford 1975). When the value given by N04 was negative we adopted = 0.0.
4.4. Comparisons and Adopted Reddening
In Fig. 2 are compared the different values determined above. There are not clear correlations between the different methods. Fortunately, most of the points (0.005 0.030) are randomly distributed along the 1:1 line, which means that a correlation may exists, but it is hidden by the errors in the reddening determinations. A larger sample, including very reddened stars (at least up to = 0.1 mag) is necessary in order to evaluate the different methods employed to estimate the reddening.
The mean differences between the methods are: - = 0.002 mag ( = 0.011 mag); - = 0.004 mag ( = 0.012 mag); - = 0.000 mag ( = 0.015 mag). Considering that there are not significant zero point differences between the different methods, we adopted the mean value:
In Table 4 are shown the adopted values and the scatter between the three methods (typically = 0.008 mag).
5. Effective Temperatures
We used the new IRFM temperature scale of RM05b, which is based on a homogeneous analysis of more than 103 stars, for which IRFM temperatures were obtained employing updated atmospheric parameters (RM05a). The main improvements compared with previous works are a better coverage of the atmospheric parameters space (Teff, log , [Fe/H]), the use of up-to-date metallicities, and the fit of trends in the residuals, thus eliminating any spurious trend in the Teff:color:[Fe/H] relations (RM05b). The use of updated metallicities and the good coverage of the atmospheric parameters space were crucial to derive reliable Teff calibrations, greatly helping to distinguish noise from real trends with metallicity. Seventeen colors were calibrated in the UBV, uvby, Vilnius, Geneva, RI (Cousins), DDO, Tycho (Hipparcos), and 2MASS photometric systems (RM05b).
The colors of the sample stars were mainly obtained from the General Catalogue of Photometric Data (Mermilliod et al. 1997), the Hipparcos/Tycho Catalogue (ESA 1997), and the final release of the 2MASS Survey (Cutri et al. 2003). Almost all stars in the sample have , , Geneva and 2MASS colors, and, when available, we also used Vilnius, Cousins, DDO and Tycho colors. At least four colors were used for the temperature determination, although for most stars eleven colors were available. The mean, weighted average (using the error of each color calibration as weight) and trimean 444the trimean is a robust estimate of central tendency. We adopted Tukey’s trimean = (Q1 + 2 median + Q3)/4, where Q1 and Q3 are the first and third quartile temperatures were computed, as well as the standard deviation, weighted error and quartile deviation. In general all estimates agree very well, except when an outlier was present. We adopted the trimean and the pseudo standard (quartile) deviation, which is the robust equivalent of in a normal distribution. 555the pseudo standard deviation was obtained from the quartile deviation QD (=(Q3-Q1)/2), employing = 3/2 QD The adopted temperatures and are shown in Table 4.
6. Gravities
Good ( 4.5) Hipparcos parallaxes were employed to obtain trigonometric surface gravities (log (Hip)) with errors (only due to ) lower than 0.2 dex in log . The stellar mass was obtained from enhanced -element Y2 isochrones (Kim et al. 2002; Demarque et al. 2004), by finding the closest isochrone to the Teff(IRFM)/Luminosity(Hipparcos)/[Fe/H](Fe II) of the sample star. In this way we simultaneously determined isochronal ages and masses. Typical ages and masses are about 11 Gyr and 0.82 M⊙, respectively. The use of other isochrones (e.g. Padova or Victoria) result in similar masses ( 0.8 M⊙ for a 12 Gyr turn-off at [Fe/H] = 2.3), but we have adopted the Y2 isochrones because they extend to [Fe/H] = 3.3, while most Padova and Victoria isochrones are available only for [Fe/H] 2.3.
We also estimated surface gravities from Y2 isochrones (log (Y2)). For turn-off stars only one solution is found at a given Teff, but for other stars the solution is twofold. When good parallaxes were available the solution closer to log (Hip) was chosen, otherwise we used as additional constraints i) photometric as determined from Strömgren photometry by N04, ii) Hipparcos parallaxes (when 2), and iii) previous log data given in the literature. In some cases even when all these constraints were used it was still unclear (within the errors) whether the star was below or above the turn-off. In those cases we adopted as a compromise log (Y2) = log (turn-off), and due to this uncertainty in evolutionary status the error in log (Y2) for those stars is about 0.25 dex (this is the maximum possible log shift from the turn-off to both the MS and the subgiant branch).
For about half of the sample we have available good Hipparcos parallaxes, hence we can check our isochronal gravities. As shown in Fig. 3, both agree very well, with a mean difference log (Y2) - log (Hip) = 0.015 ( = 0.090). Based on this comparison, we adopted an error of 0.15 dex for log (Y2), except when there was a large uncertainty in evolutionary status, in which case an error of 0.3 dex was assigned.
The adopted surface gravity is the weighted average of log (Y2) and log (Hip), and the adopted error is = max(0.1 dex, , ). These surface gravities and 1- errors are given in Table 4.
7. Abundances
We employed Kurucz overshooting model atmospheres666http://kurucz.harvard.edu/ with 72 layers (Castelli et al. 1997), adopting a metallicity [M/H] (Table 4) about 0.2 dex higher than the iron abundance [Fe/H] obtained in the literature (including the results obtained in this work), in order to compensate for the enhancement of -elements in halo stars (e.g. Sneden et al. 1994; Fulbright & Kraft 1999). The use of solar-scaled Kurucz models instead of alpha-enhanced models have negligible impact on the [O/Fe] ratio derived in the present work (see 7.1 and Table 5, where we show the sensitivity of [O/Fe] to [M/H]).
The calculations were performed in LTE and NLTE employing the code NATAJA, which is described in Shchukina & Trujillo Bueno (2001) and Shchukina et al. (2005). The adopted atomic data for oxygen and iron were described in 3. LTE computations were also done with the latest version of MOOG (Sneden 1973). Both LTE computations agree very well, typically within 0.015 and 0.025 dex for Fe II and O I, respectively. The small differences are probably due to different continuum opacities adopted in the codes.
For stars with [Fe/H] 2 we determined microturbulence velocities vt by requiring no dependence of [Fe/H] against reduced equivalent width; we found a typical = 1.5 km s-1. For stars with [Fe/H] -2 the Fe II lines and O I triplet are very weak and essentially independent of microturbulence (Table 5). For these very metal-poor stars we adopted = 1.5 km s-1 (N04).
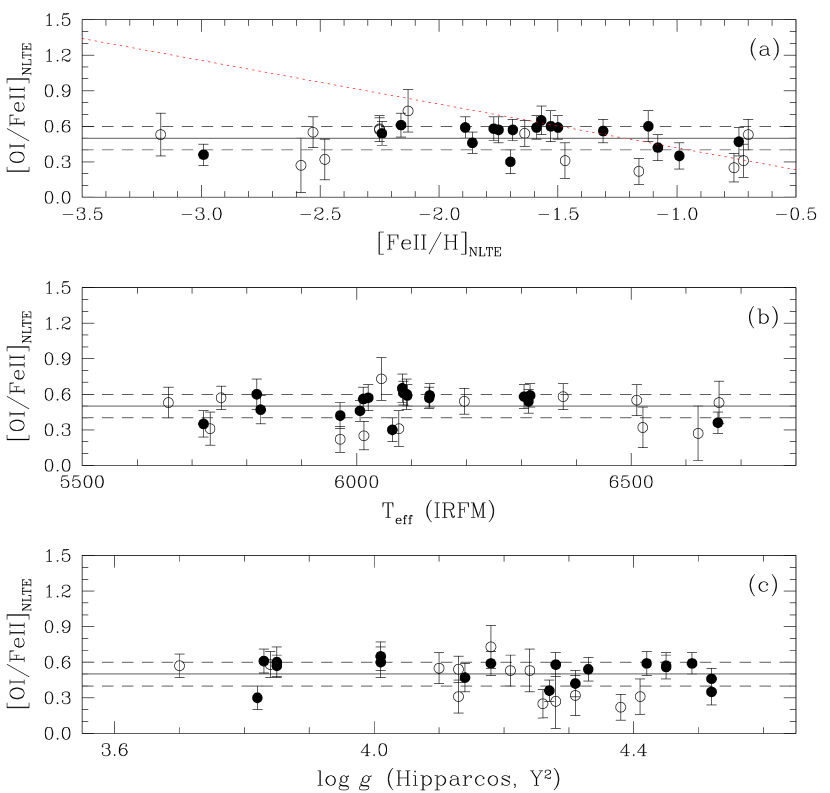
In Table 4 are given the oxygen and iron abundances derived in the present work, as well as the line-to-line scatter (i.e., errors mainly due to errors in and -values). The [O I/Fe II]NLTE ratios obtained in this work are plotted in Fig. 4a,b,c, as a function of [Fe/H], Teff and log , respectively.
In this work we obtained a mean [O/Fe] = 0.49 dex (average) and a weighted mean [O/Fe] = 0.50 dex (see 7.2).
7.1. Overshooting vs. no overshooting
We have assessed the effect of using the latest no convective overshooting (NOVER) Kurucz models (Castelli & Kurucz 2003) instead of the overshooting models (Castelli et al. 1997) adopted in the present work.
The new NOVER Kurucz models adopt new ODFs, and models with both solar-scaled and -enhanced abundances are available in the range -2.5 [Fe/H] +0.5.
The solar-scaled NOVER models with a metallicity [M/H] = [Fe/H] + 0.2 dex resulted in essentially the same (within 0.01 dex) oxygen and iron abundances than those obtained with the -enhanced NOVER models, which supports our choice of [M/H] for the model atmospheres.
The use of the new NOVER models (both solar-scaled and -enhanced) gives lower abundances compared to overshooting models. The solar oxygen and iron abundances obtained from Fe II and O I lines are both reduced by 0.06 dex with the new NOVER models, while for the sample stars the Fe and O abundances are about 0.06-0.07 and 0.08-0.10 dex lower, respectively. Therefore, the use of the latest NOVER Kurucz models does not affect the results presented here, since the [Fe/H], [O/H] and [O/Fe] ratios derived with the NOVER models are roughly preserved. Indeed, there is a small reduction of about 0.02 dex in [O/Fe] when the new Kurucz models without convective overshooting are employed, reinforcing thus the low [O/Fe] ratios found in the present work.
7.2. Intrinsic Scatter and Errors
We found a moderate star-to-star scatter in [O/Fe] of = 0.136 dex. The two main sources of observed star-to-star scatter are reddening and statistical errors (line-to-line scatter). The error in reddening introduces error in the temperature (and to some extent also in log ), thus affecting the oxygen (and iron) abundance. An uncertainty of 0.01 mag in corresponds to an uncertainty of 52 K in Teff.
In Fig. 4 it is shown that the stars with an uncertainty 0.01 mag (plotted as open circles) are the ones that deviate the most from the mean [O/Fe]. In fact, while 54% of the sample stars with 0.01 mag (open circles, Fig. 4) deviate by more than 0.1 dex from [O/Fe] = +0.5 dex, only 28 % of the sample stars with lower reddening uncertainties (filled circles, Fig. 4) show the same discrepant behavior. Considering only the stars with 0.01 mag, the observed scatter in [O/Fe] is reduced to = 0.10 dex.
Other sources of errors are due to uncertainties in the parameters of the model atmosphere (Teff, log , vt, [M/H]). In Table 5 are shown the impact of errors for changes of Teff = 50 K, log = 0.15 dex, vt = 0.3 km s-1, and [M/H] = 0.2 dex.
For each star in the sample we estimated the error in [O/Fe] considering: i) the uncertainty in reddening given in column 2 of Table 4, adopting an error of 0.04 dex per 0.01 mag, due to its impact on Teff; ii) the uncertainties in Teff and log given in columns 3 and 4 of Table 4; iii) an error of 0.3 km s-1 in microturbulence; iv) and uncertainty of 0.2 dex in [M/H] of the model atmosphere; and v) statistical uncertainties (line-to-line scatter) in the abundances of iron and oxygen given in columns 9 and 12 of Table 4, respectively. The error in [O/Fe] is shown in the last column of Table 4. The weighted mean (adopting the inverse square of the errors as weights) of the oxygen-to-iron ratio is [O/Fe] = +0.50 dex.
The mean error in [O/Fe] is 0.121 dex (trimean = 0.112 dex), which is 0.015 dex lower than the observed star-to-star scatter in [O/Fe] ( = 0.136 dex). This means that the errors were slightly underestimated, or that there is some small intrinsic scatter in the sample.
In addition to the errors reported in Table 4, there may be systematic errors in our analysis due to errors in the IRFM Teff scale, NLTE effects, and granulation effects (e.g. Asplund 2005).
8. Discussion
Since the equivalent widths used in this work were taken from Ake04 and N04, we first compare our results to theirs (8.1), then we discuss previous studies, especially those works claiming a step increase in [O/Fe] for lower metallicities based on the O I triplet (8.2) and UV OH lines (8.3). We also compare our results with previous works that obtained a flat [O/Fe] based on hot Teff scales (8.4). Then, we discuss whether high effective temperatures for metal-poor turn-off stars are physically reasonable, as well as the Teff of hyper metal-poor turn-off stars (8.5).
8.1. Comparison with Ake04/N04
The main differences between our work and that of Ake04/N04 are: different Teff scale (and reddening), new set of -values for Fe II, NLTE calculations for both Fe II and O I, and the use of different model atmospheres. Note that the NLTE corrections ANLTE - ALTE) for O I used by Ake04 were interpolated from previous calculations by Nissen et al. (2002), while in our case we explicitly computed the LTE and NLTE abundances for each star.
In Fig. 5 are shown the differences between the present work and that of Ake04/N04, as a function of [Fe/H] (left panels) and Teff (right panels). In Figs. 5b,c and 5f,g an outlier can be seen at [Fe/H] 0.7 and Teff 5650 K, respectively. This is probably due to a typo in the oxygen abundance of BD +08 3065 (G 016-013) given by Ake04, since its O abundance can not be lower than that of HD 146296, which has both lower and higher Teff than BD +08 3065.
The differences [Fe/H] and A are shown in Figs. 5a,e with filled and open circles, respectively. Despite our higher Teff (as shown in Figs. 5d,h), our A abundances are in excellent agreement with Ake04/N04. This can be explained by the low sensitivity of the iron abundance to changes in Teff (Table 5). The difference in [Fe/H] is independent of [Fe/H] and Teff, but with an offset of 0.11 dex, which is due to the use of different model atmospheres, solar abundances777The solar Fe abundance was not determined by Ake04/N04, but it should be in the same system of Nissen et al. (2002), where A(Fe)⊙ = 7.53 was found., -values and NLTE corrections (Ake04/N04 do not correct for NLTE effects, while our (Fe II) 0.046 dex).
Our [O/Fe]NLTE ratios are lower than those in Ake04, as can be seen in Figs. 5b,f. The difference [O/Fe]NLTE depends on metallicity, reaching about 0.3 dex at [Fe/H] = 3. This is partly explained by our higher Teff for lower metallicities (Figs. 5d,h), but also for the small NLTE corrections used by Ake04 for the most metal-poor stars. In Figs. 5c,g the differences in LTE oxygen abundance (A) and in NLTE corrections () are represented by open circles and stars, respectively. There is a good agreement in the A, although for the most metal-poor stars we expected to see a larger discrepancy in A due to the lower Teff adopted by Ake04. The NLTE corrections are similar for [Fe/H] 2.5, with an small offset of 0.053 dex. For lower metallicities our NLTE corrections are considerably larger, being about 0.25 larger (more negative) at [Fe/H] 3.
The interpolated for the five stars with the lowest metallicities have been wrongly estimated by Ake04 (M. Asplund, 2005, private communication). In fact, the original NLTE correction by Nissen et al. (2002) for LP 815-43, the star with the lowest metallicity ([Fe/H] = 2.7) in their sample, is (O I) = 0.25 dex, which is in excellent agreement with our (O I) = 0.24 dex.
8.2. Linear Relationship vs. Flat [O/Fe]
As can be seen in Figs. 4a,b,c, the [O/Fe] ratio is flat ([O/Fe] +0.5) and independent of metallicity, temperature and surface gravity, respectively. On the other hand, some previous investigations of the O I triplet have found a steep linear relationship between [O/Fe] and [Fe/H] (Abia & Rebolo 1989; Cavallo et al. 1997; Israelian et al. 1998, 2001; Mishenina et al. 2000), all with a similar slope of about 0.35, and reaching [O/Fe] 1.1 at [Fe/H] = . Interestingly, the work by Tomkin et al. (1992) found a flat [O/Fe], but with a high mean [O/Fe] = 0.8. Note also that the analysis of the O I triplet by Nissen et al. (2002) shows only a mild dependence of [O/Fe] with metallicity, with [O/Fe] 0.4 at [Fe/H] = , and increasing to [O/Fe] 0.6 at [Fe/H] = . The [O/Fe] ratios obtained by Ake04 are similar to those obtained by Nissen et al. (2002), showing a mild dependence with metallicity and reaching [O/Fe] 0.7 at [Fe/H] = . However, as we have seen in 8.1, the mild slope found by Ake04 can be reduced by employing our Teff scale and also proper NLTE corrections for [Fe/H] 2.5.
For comparison purposes between our results and previous studies which have found a steep linear trend between [O/Fe] and [Fe/H], a typical linear relationship found by those works is shown with a dotted line in Fig. 4a. Clearly, our results do not support previous claims for a large increase of [O/Fe] for decreasing metallicities.
Besides the neglect (or underestimation) of NLTE effects for O I, the main reason for the large slope found in other works based on the O I triplet seems to be the lower Teff adopted. For example, we show in Fig. 6 the difference Teff between the IRFM temperatures obtained with the Teff scale by RM05b and those adopted by Israelian et al. (1998, 2001). The difference Teff increases with decreasing [Fe/H], reaching about Teff = +350 K at [Fe/H] = , thus leading Israelian et al. (1998, 2001) to derive much higher (and metallicity-dependent) [O/Fe] ratios.
A better understanding of the differences between our temperatures and those adopted by Israelian et al. (1998, 2001) can be achieved by examining the differences between the temperature scales adopted by them and us (RM05b). Israelian et al. (1998) adopted the b-y and V-K Teff calibration by Alonso et al. (1996), while Israelian et al. (2001) adopted V-K calibrations by Alonso et al. (1996) and Carney (1983). In Fig. 7 we show the differences between the b-y and V-K calibrations by RM05b and those by Alonso et al. (1996) and Carney (1983).
In their first paper, which mainly analyzes stars cooler than 6000 K, Israelian et al. (1998) adopted the mean of the b-y and V-K calibrations by Alonso et al. (1996). As can be seen in Fig. 7, for Teff 6000 K, the b-y and V-K Alonso et al. (1996) temperatures are higher and lower than RM05b, respectively. Thus the mean color temperatures are similar to RM05b, explaining the good agreement for Teff 6000 K (Fig. 6).
In their second paper, which deals mainly with very metal-poor ([Fe/H]) stars hotter than 6000 K, Israelian et al. (2001) adopted the mean from the V-K calibrations by Alonso et al. (1996) and Carney (1983). Fig. 7 shows that for Teff 6000 K the V-K calibration by Alonso et al. is lower than that of RM05b by about 180 K, while the V-K calibration by Carney et al. (1983) is lower than RM05b by about 340 K in the relevant Teff and [Fe/H] range used by Israelian et al. (2001). So, on average, the calibrations used by Israelian et al. (2001) are about 250 K lower than those by RM05b. Besides, Israelian et al. (2001) neglected reddening corrections, which are important for distant early G/F dwarfs. For stars hotter than 6000 K, we obtained a mean = 0.016 mag, which is equivalent to Teff 85 K. So, considering altogether the neglect of reddening (85 K) and the use of the Alonso et al. (1996) and Carney (1983) calibrations (250 K), Israelian et al. (2001) temperatures are lower than RM05b by about 335 K, which explain the large difference shown in Fig. 6 for Teff 6000 K.
A similar reasoning could be applied to explain the differences between the temperatures obtained from the calibrations by RM05b and those determined by other authors. We also show in Fig. 7 the difference between our Teff scale and that of King (1993), which was used by Boesgaard et al. (1999), who also used the Teff scale by Carney (1983). It is important to mention that not all works which have found large [O/Fe] ratios are based entirely on photometric temperatures. For example, part of the sample analyzed by Mishenina et al. (2000) have temperatures determined from the fitting of H line profiles, and the other part was taken from the work by Cavallo et al. (1997), which is a mix of temperatures obtained from the excitation equilibrium of Fe I lines, photometric temperatures from the King (1993) Teff scale, temperatures from hydrogen profiles by Axer, Fuhrmann, & Gehren (1994), or average Teff from several values reported in the literature.
In principle, the temperature from H should be reliable, but in practice the H temperatures are subject to problems in the continuum determination (wings falling in different orders), as well as to the treatment of convection (Castelli et al. 1997). For example, Castelli et al. (1997) found a H temperature of 6500 and 6700 K in Procyon, depending on the adopted prescription for convection. They obtained higher temperatures from other Balmer lines. Interestingly, Aufdenberg, Ludwig & Kervella (2005) have recently found that Kurucz convective overshooting model atmospheres may better represent the mean temperature structure of F stars similar to Procyon, since high precision interferometric optical-red-infrared data of this star are consistent with a temperature structure with significant convective overshooting.
Although the absolute H temperatures may be in error, the relative temperatures should be reliable. In Fig. 8 we show that the relative temperatures of metal-poor ( [Fe/H] ) turn-off stars determined by Asplund et al. (2005) using an accurate modeling of the H line are in excellent agreement with those given by the IRFM Teff scale of RM05b, except for the three more metal-poor stars ([Fe/H] ), which have systematically lower H temperatures. Excluding those stars, the zero point difference (IRFM - H) is only 6162 K, similar to the difference Teff = 3495 K found by Asplund et al. (2005) between their H temperatures and those from the IRFM Teff scale of Alonso et al. (1996).
8.3. The new IRFM Teff scale and revised [O/Fe] from the UV OH lines
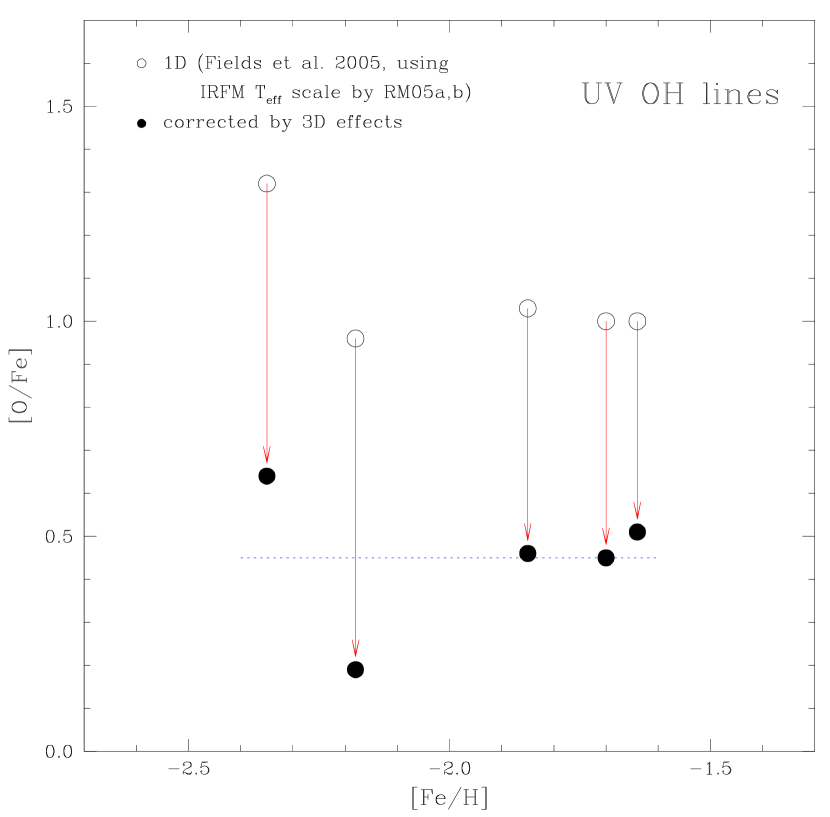
Fields et al. (2005) have recently used effective temperatures from Meléndez & Ramírez (2004), which are based on the new IRFM Teff scale by RM05a,b, in order to determine the oxygen abundance from the UV OH lines in thirteen metal-poor dwarfs. Fields et al. (2005) find very high [O/Fe] ratios, with a very steep slope: [O/Fe] = 0.66 [Fe/H] 0.25, which is about twice as large as that claimed in previous works based on the UV OH lines (Israelian et al. 1998; Boesgaard et al. 1999). The slope is reduced when the single point with [Fe/H] and an extreme [O/Fe] +2.4 is excluded, resulting in [O/Fe] = [Fe/H] + 0.49, which has a similar slope to that found by Israelian et al. (1998) and Boesgaard et al. (1999), but a higher constant term. Half of the higher constant term is explained by the different solar abundances adopted by Fields et al. (2005; K. A. Olive & B. D. Fields, private communication), leading to an increase of +0.23 dex in [O/Fe]. The other half is probably due to the use of a hotter Teff scale.
As shown by Asplund & García Pérez (2001), oxygen abundances from the UV OH lines may be severely overestimated by 1D analyses888Note that the large 3D abundance corrections apply mainly to hot turn-off stars, therefore this is not necessarily in conflict with the recent low [O/Fe] ratios found in the 1D analysis of UV OH lines in subgiants by García Pérez et al. (2005), and the 3D abundance corrections depend on metallicity and temperature. For example, for a star with Teff 6000 K, the 3D correction [O/Fe] increases from about dex at [Fe/H] = , to at [Fe/H] . On the other hand, at [Fe/H] = 3, increasing the temperature from Teff 5890 to Teff 6200 K increases the [O/Fe] correction from 0.5 to 0.9 dex (Asplund & García Pérez 2001). Therefore, the increase in the 1D oxygen abundance from the UV OH lines due to higher temperatures is probably compensated by the increase in the 3D corrections, resulting in low [O/Fe] ratios.
The above reasoning is checked quantitatively in Fig. 9, where we show the [O/Fe] ratios obtained by Fields et al. (2005) using the temperatures by Meléndez & Ramírez (2004), along with the corresponding [O/Fe] corrections interpolated from 3D calculations by Asplund & García Pérez (2001). Since 3D corrections are only available for stars with Teff 6205 K, we refrained from applying the corrections to the whole sample analyzed by Fields et al. (2005), but only to stars with Teff 6250 K (in fact, most stars shown in Fig. 9 have Teff 6150 K). The mean corrected [O/Fe] ratio is [O/Fe] = 0.45. Although it is true that our Teff scale increases the [O/Fe] ratio obtained from the UV OH lines in a 1D analysis, it is also true that the 3D corrections increase with higher Teff and lower [Fe/H], thus compensating the first effect and resulting in a roughly flat (and low) [O/Fe] ratio for halo stars (Fig. 9).
It is important to mention that we have assumed above that the stellar parameters remain roughly unchanged with 3D model atmospheres. Shchukina et al. (2005) have recently performed 1.5D+NLTE computations employing a 3D model atmosphere of the metal-poor subgiant HD 140283, and based on spectroscopic constrains they suggested that the stellar parameters for this star may need modification when 3D model atmospheres are employed. On the other hand, Asplund & García Pérez (2001) show that when the effective temperatures of metal-poor stars of solar Teff are determined with the IRFM, only small changes in Teff (below 20 K) are expected in 3D. The changes are even smaller (below 5 K) for metal-poor turn-off stars. In their analysis of the UV OH lines, Fields et al. (2005) adopted effective temperatures by Meléndez & Ramírez (2004), which are in the IRFM Teff scale of RM05b, and therefore those Teff should be little affected in 3D model atmospheres. The main concern is probably the iron abundance, which for the only star (HD 140283) with a 1.5D+NLTE calculations in a 3D model atmosphere (Shchukina et al. 2005), is 0.25 dex higher than in the present 1D analysis. The higher metallicity would result in a lower 3D correction, which is compensated by the increase of 0.25 dex in [Fe/H], resulting in slightly lower [O/Fe] ratios than those presented in Fig. 9. Note also that the UV OH lines may be affected by NLTE effects, perhaps increasing the oxygen abundances from UV OH lines (Asplund & García Pérez 2001). Full 3D + NLTE calculations of the UV OH lines are strongly encouraged.
It would be important to check whether Fe I and Fe II lines satisfy the excitation and ionization equilibrium in 3D+NLTE (and also 1D+NLTE), which may bring support (or not) to the new Teff scale by RM05b. Nevertheless, the NLTE calculations should be first checked employing stars with well-determined stellar parameters. This is a formidable theoretical and observational task, especially for turn-off very metal-poor stars, where high excitation potential (3-5 eV) Fe I lines are extremely weak, yet important to minimize the degeneracy of stellar parameters based on spectroscopic equilibrium of iron lines. Besides, further work on establishing a reliable -scale of Fe I lines is required.
The determination of a reliable A is very important, since the oxygen-to-iron ratio depends on the adopted Fe abundance. In fact, as discussed in 1, the relatively low [O/Fe] ratios found in the reanalysis of UV OH lines by King (2000) was partly due to large (Fe I) adopted from Thévenin & Idiart (1999).
8.4. Other flat [O/Fe] ratios and hot Teff scales
Our finding of a flat (and low) [O/Fe] ratio using the permitted O I lines has been previously reported in the literature, although in a more restricted metallicity range.
This result has been achieved with different Teff scales, although it was first shown with the hot Teff scale by King (1993). Tomkin et al. (1992) obtained a flat [O/Fe], but with a high mean [O/Fe] +0.8. The reanalysis of Tomkin et al. data by King (2000), employing new stellar parameters and A, resulted in a significant reduction of [O/Fe], partly due to high A abundances. Unfortunately, King (2000) only presented his O I reanalysis in plots, so a detailed comparison is not possible. The [O/Fe] ratios obtained by both Tomkin et al. (1992) and King (2000) should be increased by about 0.2 dex due to the new low solar O and Fe abundances, increasing thus the discrepancy of Tomkin et al. with the present work. Note that the NLTE corrections adopted by Tomkin et al. (1992) are almost negligible, because they empirically included the effects of neutral H collisions, adjusting them so that the NLTE solar oxygen abundance from the O I triplet reproduced the high solar AO obtained from the [O I] and infrared OH lines (AO = 8.92). In this way, Tomkin et al. significantly reduced the departures from LTE. However, recent studies (see 3.1 for references) show that the solar O abundance is much lower than previously thought. Our solar A from the O I triplet is in excellent agreement with the O abundance from other spectral features (see 3.1), hence the inclusion of neutral H collisions may not be necessary.
Primas et al. (2001) presented preliminary NLTE oxygen abundances from the O I triplet in a sample of dwarfs with [Fe/H] 2.4. Their analysis employed three different sets of Teff: the (b-y) calibrations of Alonso et al. (1996) and Carney (1983), and temperatures from Thévenin & Idiart (1999). Primas et al. [O/Fe] ratios are roughly flat, with [O/Fe] +0.4 for the Alonso et al. (1996) Teff scale, and [O/Fe] +0.5 for the other two Teff scales. The preliminary results of Primas et al. are in good agreement with our work. This is not surprising, since the (b-y) calibration of Alonso et al. (1996) employed by Primas et al. (2001) gives even hotter temperatures than those from the RM05b Teff scale, at least for [Fe/H] 2 and Teff 6000 K (Fig. 7). On the other hand, the (b-y) calibration of Carney (1983) at [Fe/H] = 2 is not much cooler (only 20 - 100 K lower) than the (b-y) calibration of RM05b. It is unknown what Teff scale was employed by Thévenin & Idiart (1999), since they refereed to a CDS catalogue by Thévenin, where no details are given.
King (1993) found that the very large [O/Fe] ratios derived by Abia & Rebolo (1989) were partly due to large errors in equivalent widths (overestimated by about 24%). Furthermore, as a solution to the discrepancy between the oxygen abundances obtained from the triplet and the forbidden lines, King (1993) suggested an increase of about 150-200 K in the Teff scale of dwarfs, finding in this way a flat [O/Fe] 0.5 dex (his Fig. 9). On the other hand, Carretta et al. (2000), employing the hot Teff scale of Gratton et al. (1996) and significant NLTE corrections by Gratton et al. (1999), found that the analysis of the permitted oxygen lines results in an almost flat [O/Fe] 0.5 dex (their Fig. 3), similar to that obtained from the forbidden oxygen lines.
It is not possible to perform detailed comparisons with the work of King (1993), since there is only one star (BD +02 375) in common with our work. There is a good agreement in both the Teff (ours is only 58 K higher) and [O/Fe] of that star, but the agreement in [O/Fe] is fortuitous, because a different [Fe/H] and very small (O I) were employed by King (1993). Larger NLTE corrections would decrease King (1993) [O/Fe] ratios. On the other hand, [O/Fe] should be increased due to the new low solar AO. Overall, both effects roughly cancel, preserving thus the [O/Fe] +0.5 found by King (1993).
The other well-known example of a flat [O/Fe] is that of Carretta et al. (2000), who have seven stars in common with our sample. In Fig. 10 are shown the differences in [Fe/H], [O/Fe]NLTE, A, (O I) and Teff. As can be seen there is a good agreement in [Fe/H] (Figs. 10a,e) and Teff (Figs. 10d,h). Our [O/Fe] ratios are about 0.12 dex higher than theirs (Figs 10b,f). This is explained by the much higher solar O abundance (AO = 8.93) and the smaller (O I) adopted by Carretta et al. (2000). After correcting this (0.28 dex in the solar AO and 0.12 dex in ), Carretta et al. (2000) [O/Fe] ratios are only 0.04 dex smaller than ours. In fact, an excellent agreement is found in A (open circles, Figs. 10c,g), since it is independent of the solar AO and .
In summary, despite zero point differences due to the adopted solar abundances and , the use of a hot Teff scale and adequate NLTE calculations (which reproduce the new solar O abundance) result in a flat and low [O/Fe] ratio in halo stars. Nevertheless, previous claims for a hotter temperature scale have not been well received by the astronomical community. The last hot Teff scale recently introduced in the literature is due to Fulbright & Johnson (2003), who derived a new ad hoc Teff scale for subgiants and giants based on forcing agreement between the oxygen abundances obtained from permitted and forbidden lines. As noted by Fulbright & Johnson (2003), this hotter Teff scale for giants does not agree with theoretical isochrones999note that we argue later that the hotter IRFM Teff scale of RM05a,b does agree with stellar evolution models, but the Teff scale of RM05a,b is only hotter for metal-poor turn-off stars, while the ad hoc Teff scale by Fulbright & Johnson (2003) is hotter for giant stars, Teff from Balmer lines, and the IRFM Teff scale of Alonso et al. (1996, 1999). Interestingly, the ad hoc Teff scale leads to a mild increase of [O/Fe] for lower metallicities, with [O/Fe] 0.65 at [Fe/H] = to [O/Fe] 0.8 at [Fe/H] = .
The new Teff scale by RM05a,b is not based on ad hoc assumptions on stellar chemical abundances. It is based on the IRFM, which is probably the least model-dependent indirect method for determining Teff. The problem with previous hot Teff scales is that they basically adopted a zero point shift, that is, the increase in effective temperatures was applied to all stars independent of spectral type, which is not correct. Our recent studies (RM05a,b) have shown that for most of the range spanned by stellar atmosphere parameters of FGK stars the IRFM Teff scale of Alonso et al. (1996, 1999) remains roughly valid, except for some regions where insufficient data was previously available, which is the case of metal-poor F and early G dwarfs.
Besides its impact on the oxygen abundances derived from the O I triplet, the new IRFM Teff scale (RM05a,b) may also affect the abundances derived from other high excitation lines (e.g. C I, S I), as well as low excitation lines (e.g. Li I). Indeed, Meléndez & Ramírez (2004) have shown that the use of the new IRFM Teff scale may be one of the factors concurring to alleviate the discrepancy between the “low” Li abundance obtained in metal-poor FG dwarfs and the “high” primordial Li abundance obtained from WMAP data and Big Bang primordial nucleosynthesis.
8.5. New IRFM Teff scale for halo turn-off stars vs. Stellar Evolution
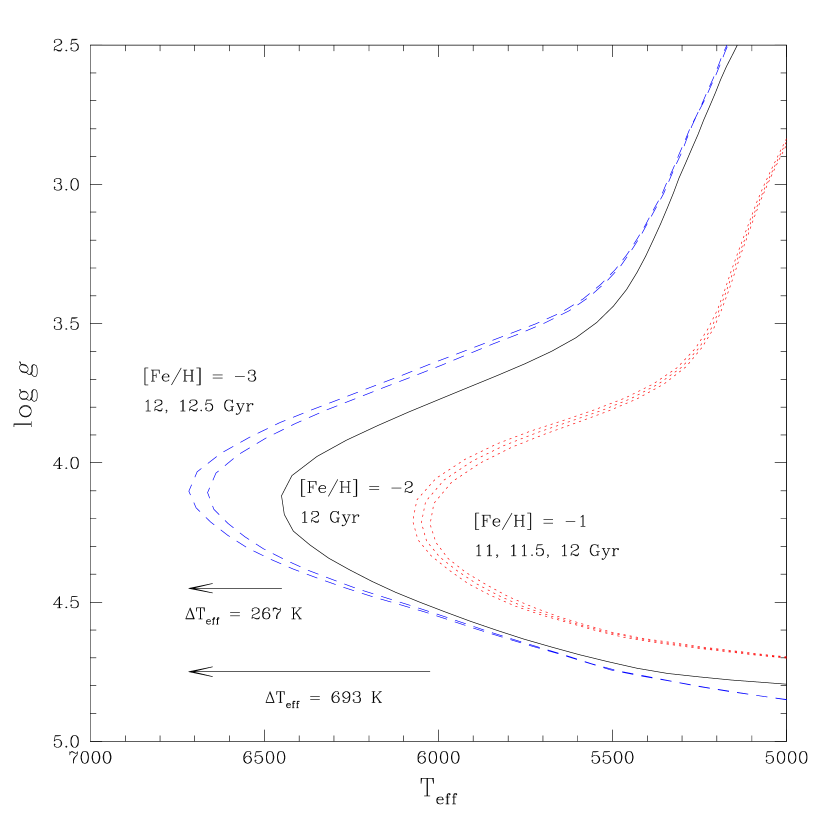
The high effective temperatures that we obtained for metal-poor turn-off stars are supported by stellar evolution calculations, which predict that the Teff of the turn-off strongly depends on metallicity. In Fig. 11, we plot Y2 isochrones for metallicities [Fe/H] = 1, 2, 3, showing that the turn-off temperature increases up to 700 K from [Fe/H] = 1 to [Fe/H] = 3, assuming a constant age of 12 Gyrs. Even allowing for reasonable changes in age, the Teff of the turn-off still strongly depends on metallicity. This metallicity dependence of the turn-off temperatures are also predicted by other stellar evolution models. The widely used Padova (e.g. Girardi et al. 2002) and Victoria (Bergbusch & VandenBerg 2001) isochrones predict a strong dependence on metallicity, with even higher effective temperatures at the turn-off than the Y2 isochrones.101010The absolute location of the turn-off depends on the assumptions made on the stellar evolution models, especially on the mixing length. However, our main point is that the turn-off strongly depends on metallicity, and this well established behavior of stellar evolution is independent of the absolute location of the turn off.
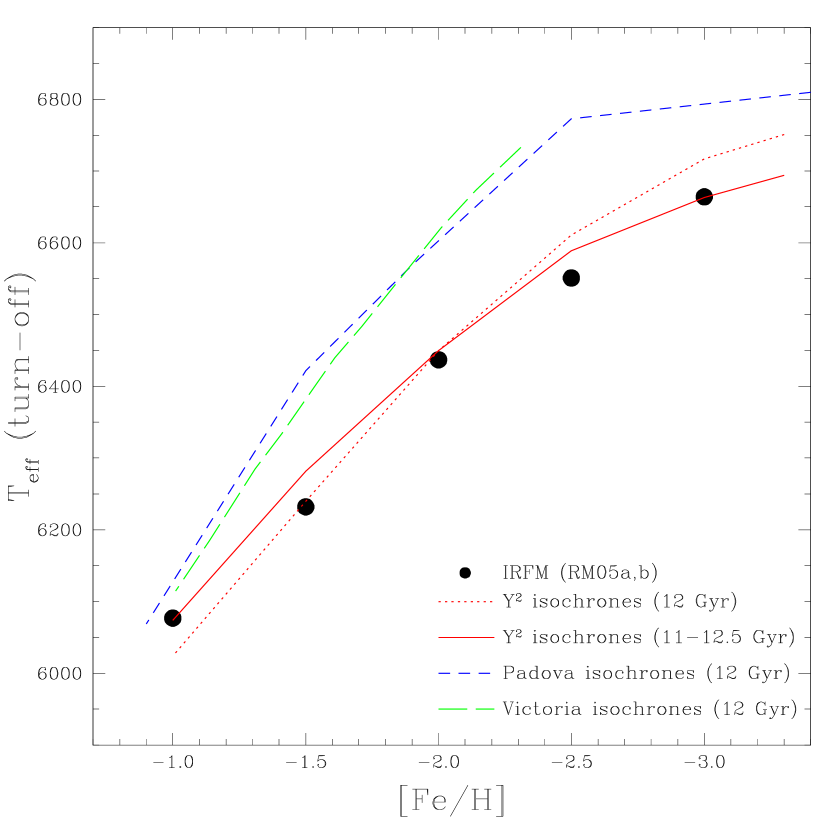
In order to study more quantitatively whether (or not) our IRFM Teff scale for turn-off stars makes sense physically, we have made a comparison of our temperatures with those predicted by stellar evolution. Since for a given metallicity the turn-off stars are the ones with highest Teff, we divided the present sample and the sample of Meléndez & Ramírez (2004) (which are composed mainly of main sequence, turn-off and subgiant stars) in metallicity bins of 0.5 dex, and adopted as turn-off IRFM Teff the average effective temperature of the three stars with the highest Teff in each metallicity bin. The results are shown in Fig. 12, where we can see the impressive qualitative and quantitative agreement of the evolutionary models of metal-poor stars with the Teff scale by RM05a,b.
The metallicity dependence of the turn-off was predicted by early stellar evolution models (Simoda & Iben 1968, 1970; Iben & Rood 1970; Demarque, Mengel & Aizenman 1971), which showed that a decrease by a factor of 10 in metallicity (from Z = 10-3 to 10-4) corresponds to an increase of about 0.025 dex in log Teff (Iben & Rood 1970), that at Teff = 6000 K corresponds to an increase in Teff of 355 K for a decrease in 1 dex in metallicity. This is due to two effects (Simoda & Iben 1968, 1970): i) the influence of metallicity on opacity, which contributes to an increase of the Teff for more metal-poor models; and ii) the influence of metallicity on the - and CNO luminosities for low mass stars. As evolution from the main sequence proceeds and core temperature increases, the CN-cycle grows its importance over the - chain. The CN-cycle does not become important until a considerable fraction of the central hydrogen has been converted into helium, which for lower metallicities occurs later, allowing the star to reach a bluer (hotter) turn-off (Iben & Rood 1970; Simoda & Iben 1970).
Recently, Frebel et al. (2005) announced the discovery of HE 1327-2326, a hyper metal-poor star with [Fe/H] = 5.4, the most iron-poor star yet known. The authors argue that this star is close to the turn-off, being probably either a main-sequence or a subgiant star.
Models of hyper metal-poor stars show that the location of the turn-off looses its sensitivity to the initial metal content for lower than (Wagner 1974; Cassisi & Castellani 1993). That means that the Teff of the turn-off reaches a maximum value at [Fe/H] . Fig. 12 suggests that the turn-off Teff of population III stars should be not much higher than 6700-6750 K.
Frebel et al. (2005) determined a Teff = 6180 80 K for HE 1327-2326, which is considerably lower than the maximum temperature allowed for a hyper metal-poor turn-off star. Employing the Johnson-Cousin and 2MASS colors given in Aoki et al. (2005), and using E(B-V) = 0.077, which is the same E(B-V) value adopted by them, we obtained Teff = 6340 K using the Teff scale by RM05b with [Fe/H] = 3.3. A lower metallicity must not be employed due to the low number of extremely metal-poor calibration stars. Aoki et al. (2005) found that the reddening of HE 1327-2326 may be as high as E(B-V) = 0.104, as estimated from the interstellar Na I D2 line. Adopting E(B-V) = 0.104, Teff = 6500 K is obtained from the Teff scale of RM05b. Aoki et al. (2005) have found that the spectroscopic temperature (based on Balmer lines and the HP2 index) of HE 1327-2326 is about 200-300 K lower than G 64-12. Using our Teff for G 64-12, implies that the spectroscopic Teff of HE 1327-2326 is about 6360-6460 K.
It is of the uttermost importance to determine a good parallax for HE 1327-2326, in order to assess the evolutionary stage of this hyper metal-poor star, and to further constraint its Teff. For example, a trigonometric gravity of log = 4.1 0.1 dex would constraint HE 1327-2326 to the turn-off (within 200 K), and if this star turns out to be hotter than previously thought, then the obtained abundances and their interpretation might require revision. This is especially important for the abundance of elements very sensitive to Teff, like the oxygen abundance determined from UV OH lines.
9. Conclusions
We have determined oxygen and iron abundances in 31 metal-poor ( [Fe/H] ) stars close to the turn-off, employing high resolution high S/N UVES data taken from Ake04 and N04.
We find a flat [O/Fe] = +0.5, independent of metallicity, temperature and surface gravity in the ranges [Fe/H] , 5700 K Teff 6700 K, and log , respectively. Our work confirms previous studies (e.g. Carretta et al. 2000; Primas et al. 2001) which have already found a flat and low [O/Fe] ratio in halo dwarfs from the O I triplet, extending the constancy of the [O/Fe] ratios down to [Fe/H] = 3.2.
The flat [O/Fe] ratio is mainly due to the use of adequate NLTE calculations and the new IRFM Teff scale by RM05a,b, which for metal-poor turn-off stars is hotter than most previous Teff scales available in the literature. We find a low star-to-star scatter of 0.136 dex for the whole sample, or = 0.10 dex for the sample with low reddening uncertainty.
The observed star-to-star scatter ( = 0.136 dex) is almost completely explained by errors in the analysis ( 0.121 dex), leaving little room for intrinsic scatter. Hence, the Galaxy was extremely efficient in mixing the chemical elements ejected by supernovae. Other recent works in the literature have also found very small star-to-star scatter for other -elements (e.g. Cayrel et al. 2004; Cohen et al. 2004; Arnone et al. 2005). Furthermore, the low scatter implies a small contribution to the halo from metal-poor stars that originated in dSph galaxies, since much lower [/Fe] ratios are commonly seen in such galaxies (e.g. Venn et al. 2004; see also discussion and references given in Catelan 2005).
The constancy of the [O/Fe] ratio over more than two orders of magnitude in [Fe/H], from [Fe/H] = 0.7 to [Fe/H] = 3.2, is telling us that the formation of the halo was extremely fast, with a timescale shorter than the bulk of Type Ia SNe. Our data provides tight constraints for Galactic chemical evolution models (e.g. Matteucci & Recchi 2001; Alibés, Labay & Canal 2001; Goswami & Prantzos 2000; Portinari, Chiosi & Bressan 1998; Samland 1998; Chiappini, Matteuci & Gratton 1997).
Our low [O/Fe] = +0.5 constrains the 6Li production by GCR models, which are not able to explain the detection of 6Li in a star with [Fe/H] = 2.7 (Asplund et al. 2005), hence reinforcing the case for a pre-Galactic origin of the recent 6Li detections in very metal-poor stars.
Recent determinations of H temperatures in turn-off stars by Asplund et al. (2005) are in very good relative agreeement with the RM05b Teff scale in the metallicity range [Fe/H] , with a zero point difference of only 6162 K.
As shown in Figs. 11 and 12, the strong metallicity dependence of the temperature of turn-off stars is not unphysical, but a natural consequence of stellar evolution. Ramírez et al. (2006), has recently confirmed the hot Teff scale of RM05b for one star, BD +17 4708, by fitting its observed absolute flux distribution from Hubble Space Telescope observations with Kurucz models. Indeed, the Teff obtained by Ramírez is about 100 K higher than the Teff obtained in this work with the Teff scale of RM05b. This is not in conflict with stellar evolution calculations, since there is still room for an increase of about 100 K in the RM05b Teff scale of metal-poor turn-off stars (Fig. 12).
In the future, it would be important to take into account also granulation effects, performing full 3D+NLTE analyses. This is the way to go for future abundance studies. Also, it is very important to perform future verifications of the Teff scale of RM05b.
References
- (1)
- (2) Abia, C. & Rebolo, R. 1989, ApJ, 347, 186
- (3)
- (4) Akerman, C. J., Carigi, L., Nissen, P. E., Pettini, M., Asplund, M. 2004, A&A, 414, 931 (Ake04)
- (5)
- (6) Alibés, A., Labay, J. & Canal, R. 2001, 370, 1103
- (7)
- (8) Allende Prieto, C., Asplund, M., Fabiani Bendicho, P. 2004, A&A, 423, 1109
- (9)
- (10) Alonso, A., Arribas, S. & Martínez-Roger, C. 1996, A&A, 313, 873
- (11)
- (12) Alonso, A., Arribas, S. & Martínez-Roger, C. 1999, A&AS, 140, 261
- (13)
- (14) Aoki W. et al. 2005, ApJ, in press (astro-ph/0509206)
- (15)
- (16) Arce, H. G. & Goodman, A. A, ApJ, 512, L135
- (17)
- (18) Arenou, F., Grenon, M. & Gomez, A. 1992, A&A, 258, 104 (A92)
- (19)
- (20) Arnone, E., Ryan, S. G., Argast, D., Norris, J. E., Beers, T. C. 2005, A&A, 430, 507
- (21)
- (22) Asplund, M. 2005, ARA&A, 43, 481
- (23)
- (24) Asplund, M., Gustafsson, B., Kiselman, D., Eriksson, K. 1997, A&A, 318, 521
- (25)
- (26) Asplund, M., Nordlund, Å., Trampedach, R., Stein, R.F. 2000, A&A, 359, 743
- (27)
- (28) Asplund, M., & García-Pérez, A.E. 2001, A&A, 372, 601
- (29)
- (30) Asplund, M., Grevesse, N., Sauval, A. J., Allende Prieto, C., Kiselman, D. 2004, A&A 417, 751 (Asp04)
- (31)
- (32) Asplund, M., Lambert, D. Nissen P. E., Primas, F. Smith, V. 2005, ApJ, submitted (astro-ph/0510636)
- (33)
- (34) Aufdenberg, J. P., Ludwig H.-G. & Kervella, P. 2005, ApJ, 633, 424
- (35)
- (36) Axer, M., Fuhrmann, K. & Gehren, T. 1994, A&A, 291, 895
- (37)
- (38) Barbuy, B. 1988, A&A, 191, 121
- (39)
- (40) Barklem, P. S., Piskunov, N. & O’Mara, B.J. 2000, A&AS, 214, 239
- (41)
- (42) Barklem, P. S. & Aspelund-Johansson, J. 2005, A&A, 435, 373
- (43)
- (44) Bergbusch, P. A. & VandenBerg, D. A. 2001, ApJ, 556, 322
- (45)
- (46) Boesgaard, A. M., King, J. R., Deliyannis, C. P., Vogt, S. S. 1999, AJ, 117, 492
- (47)
- (48) Bond, H. E. 1980, ApJS, 44, 517
- (49)
- (50) Breitschwerdt, D., Freyberg, M. J., Egger, R. 2000, A&A, 364, 935
- (51)
- (52) Burstein, D. & Heiles, C. 1978, ApJ, 225, 40
- (53)
- (54) Burstein, D. 2003, AJ, 126, 1849
- (55)
- (56) Carlsson, M. & Judge, P. G. 1993, ApJ, 402, 344
- (57)
- (58) Carney, B. W. 1983, AJ, 88, 623
- (59)
- (60) Carretta, E., Gratton, R. G. & Sneden, C. 2000, A&A, 356, 238
- (61)
- (62) Cassisi, S. & Castellani, V. 1993, ApJS, 88, 509
- (63)
- (64) Castelli, F., Gratton, R. G. & Kurucz, R. L. 1997, A&A, 324, 432
- (65)
- (66) Castelli, F. & Kurucz, R. L. 2003, in IAU Symp. 210, Modelling of Stellar Atmospheres, , ed. N. Piskunov, W.W. Weiss & D.F. Gray (San Frascisco: ASP), A20
- (67)
- (68) Catelan, M. 2005, in Resolved Stellar Populations, ed. D. Valls-Gabaud & M. Chavez, ASP Conf. Ser., in press (astro-ph/0507464)
- (69)
- (70) Cavallo, R. M., Pilachowski, C. A., Rebolo, R. 1997, PASP, 109, 226
- (71)
- (72) Cayrel, R., Depagne, E., Spite, M., Hill, V., Spite, F. et al. 2004, A&A, 416, 1117
- (73)
- (74) Chen B., Vergely, J. L., Valette, B., Carraro G. 1998, A&A, 336, 137 (C98)
- (75)
- (76) Chen, B., Figueras, F., Torra, J. et al. 1999, A&A, 352, 459
- (77)
- (78) Chiappini, C., Matteucci, F. & Gratton, R., 1997, ApJ, 477, 765
- (79)
- (80) Chiappini, C., Romano, D. & Matteucci, F. 2003, 339, 63
- (81)
- (82) Cohen, J., Christlieb, N., McWilliam, A., Shectman, S., Thompson, I. et al. 2004, ApJ, 612, 1107
- (83)
- (84) Crawford, D. L. 1975, PASP, 87, 481
- (85)
- (86) Cutri, R. M., Skrutskie, M. F., Van Dyk, S., et al. 2003, VizieR Online Data Catalog, II/246
- (87)
- (88) Demarque, P., Mengel, J. G. & Aizenman, M. L. 1971, ApJ, 163, 37
- (89)
- (90) Demarque, P., Woo, J.-H., Kim, Y.-C., Yi, S. K. 2004, ApJS, 155, 667
- (91)
- (92) Dutra, C. M., Santiago, B. X., Bica, E., Barbuy, B. 2003a, MNRAS, 338, 253
- (93)
- (94) Dutra, C. M., Ahumada, A. V., Clariá, J. J., Bica, E., Barbuy, B. 2003b, A&A, 408, 287
- (95)
- (96) ESA. 1997, The Hipparcos and Tycho Catalogues, ESA SP-1200
- (97)
- (98) Frebel, A. et al. 2005, Nature, 434, 871
- (99)
- (100) Fields, B. D. & Olive, K. A. 1999, ApJ, 516, 797
- (101)
- (102) Fields, B. D., Olive, K. A. & Vangioni-Flam, E. 2005, ApJ, 623, 1083
- (103)
- (104) Fitzgerald, M. P. 1968, AJ, 73, 983
- (105)
- (106) Fulbright, J. P. & Kraft, R. P. 1999, AJ, 118, 527
- (107)
- (108) Fulbright, J. P. & Johnson, J. A. 2003, ApJ, 595, 1154
- (109)
- (110) Gehren T., Korn, A. J. & Shi J. 2001, A&A, 380, 645
- (111)
- (112) Girardi, L., Bertelli, G., Bressan, A., Chiosi, C., Groenewegen, M. A. T. et al. 2002, A&A, 391, 195
- (113)
- (114) Goswami, A. & Prantzos, N. 2000, A&A, 359, 191
- (115)
- (116) Gratton, R. G., Carretta, E., Castelli, F. 1996, A&A, 314, 191
- (117)
- (118) Gratton, R. G., Carretta, E., Eriksson, K., Gustafsson, B. 1999, A&A, 350, 955
- (119)
- (120) Gurtovenko, E. A. & Kostik, R. I. 1989, Fraunhofer Spectrum and the System of Solar Oscillator Strenghts, Noukova Dumka, Kiev (GK89)
- (121)
- (122) Hakkila, J., Myers, J. M., Stidham, B., & Hartmann, D. H. 1997, AJ, 114, 2043 (H97)
- (123)
- (124) Hannaford, P., Lowe, R.M., Grevesse, N., Noels, A. 1992, A&A, 259, 301 (H92)
- (125)
- (126) Hinkle, K., Wallace, L., Valenti, J., Harmer, D. 2000, Visible and Near Infrared Atlas of the Arcturus Spectrum, 3727-9300 Å, KPNO/NOAO, ASP, San Francisco
- (127)
- (128) Holweger, H. & Müller, E. A., 1974, Sol. Phys. 39, 19 (HM74)
- (129)
- (130) Hudson, M.J., 1999, PASP, 111, 57
- (131)
- (132) Iben, I. Jr. & Rood, R. T. 1970, ApJ, 159, 605
- (133)
- (134) Israelian, G., García López, R. J. & Rebolo, R. 1998, ApJ, 507, 805
- (135)
- (136) Israelian, G., Rebolo, R. , García López, R. J., Bonifacio, P., Molaro, P., Basri, G., Shchukina, N. 2001, ApJ, 551, 833 (erratum: ApJ, 560, 535)
- (137)
- (138) Israelian, G., Shchukina, N., Rebolo, R., Basri, G., González Hernández, J. I., Kajino, T. 2004, A&A, 419, 1095
- (139)
- (140) Jedamzik, K. 2000, PRL, 84, 3248
- (141)
- (142) Jedamzik, K. 2004, Phys. Rev. D, 70, 063524
- (143)
- (144) Kim, Y.-C., Demarque, P., Yi, S.K., Alexander, D.R., 2002, ApJS, 143, 499
- (145)
- (146) King, J. R. 1993, AJ, 106, 1206
- (147)
- (148) King, J. R. 2000, AJ, 120, 1056
- (149)
- (150) Kostik, R. I., Shchukina, N. G., Rutten, R. J. 1996, A&A, 305, 325
- (151)
- (152) Kurucz, R. L., Furenlid, I., Brault, J., Testerman, L. 1984, Solar Flux Atlas from 296 to 1300 nm, NSO Atlas No. 1, Harvard University (K84)
- (153)
- (154) Lambert, D. L. Heath J. E., Lemke M., Drake J. 1996, ApJS, 103, 183
- (155)
- (156) Lallemnet, R., Welsh, B. Y., Vergely, J. L., Crifo, F., Sfeir, D. 2003, A&A, 411, 447
- (157)
- (158) Leroy, J. L., 1999, A&A, 346, 955
- (159)
- (160) Masseron, T., Plez, B., Primas, F. et al. 2005, in IAU Symposium 228, From Lithium to Uranium: Elemental Tracers of Early Cosmic Evolution, ed. V. Hill, P. François & F. Primas, Cambridge University Press, in press
- (161)
- (162) Matteucci, F. & Recchi, S. 2001, ApJ, 558, 351
- (163)
- (164) McWilliam, A. 1997, ARA&A, 35, 503
- (165)
- (166) Meléndez, J. 2004, ApJ, 615, 1042
- (167)
- (168) Meléndez, J. & Barbuy, B. 2002, ApJ, 575, 474
- (169)
- (170) Meléndez, J. & Barbuy, B. 2006, in preparation
- (171)
- (172) Meléndez, J., Barbuy, B. & Spite, F. 2001, ApJ, 556, 858
- (173)
- (174) Meléndez, J., & Ramírez, I. 2004, ApJ, 615, L33
- (175)
- (176) Mermilliod, J.-C., Mermilliod, M. & Hauck, B. 1997, A&AS, 124, 349
- (177)
- (178) Mishenina, T. V., Korotin, S. A., Klochkova, V. G., Panchuk, V. E. 2000, A&A, 353, 978
- (179)
- (180) Neckel, Th. & Klare, G. 1980, A&AS, 42, 251
- (181)
- (182) Nissen, P.E. 1994, Rev. Mex. A&A, 29, 129
- (183)
- (184) Nissen, P.E., Primas, F., Asplund, M., Lambert, D.L. 2002, A&A, 390, 235
- (185)
- (186) Nissen, P.E., Chen, Y. Q., Asplund, M., Pettini, M. 2004, A&A, 415, 993 (N04)
- (187)
- (188) Portinari, L., Chiosi, C. & Bressan, A. 1998, A&A, 334, 505
- (189)
- (190) Prantzos, N., Cassé, M. & Vangioni-Flam, E. 1993, ApJ 403, 630
- (191)
- (192) Prantzos, N. 2005, A&A, in press (astro-ph/0510122)
- (193)
- (194) Primas, F. et al. 2001, NewAR, 45, 541
- (195)
- (196) Ramaty, R., Scully, S. T., Lingenfelter, R. E., Kozlovsky, B. 2000, ApJ, 534, 747
- (197)
- (198) Ramírez, I., Allende Prieto, C., Redfield, S., Lambert, D. L. 2006, in preparation
- (199)
- (200) Ramírez, I., Meléndez, J. 2005a, ApJ, 626, 446 (RM05a)
- (201)
- (202) Ramírez, I., Meléndez, J. 2005b, ApJ, 626, 465 (RM05b)
- (203)
- (204) Rollinde, E., Vangioni-Flam, E., Olive, K. A. 2005, ApJ, 627, 666
- (205)
- (206) Samland, M. 1998, ApJ, 496, 155
- (207)
- (208) Scalo, J. & Elmegreen, B. G. 2004, ARA&A, 42, 275
- (209)
- (210) Schlegel, D. J., Finkbeiner, D. P., & Davis, M. 1998, ApJ, 500, 525 (S98)
- (211)
- (212) Schnabel R., Kock, M., Holweger, H. 1999, A&A, 342, 610
- (213)
- (214) Schnabel R., Schultz-Johanning, M., & Kock, M. 2004, A&A, 414, 1169
- (215)
- (216) Schuster, W. J. & Nissen, P. E. 1989, A&A, 221, 65
- (217)
- (218) Sfeir, D. M.; Lallemnet, R., Crifo, F., Welsh, B. Y. 1999, A&A, 346, 785
- (219)
- (220) Shchukina, N. & Trujillo Bueno, J. 2001, ApJ, 550, 970
- (221)
- (222) Shchukina, N., Vasiljeva, I. E., Trujillo Bueno, J., Asplund, M. 2003, in IAU Symp. 210, Modeling of Stellar Atmospheres, ed. N. Piskunov, W. W. Weiss, & D. F. Gray (San Francisco: ASP), B10
- (223)
- (224) Shchukina, N., Trujillo Bueno, J. & Asplund, M. 2005, ApJ, 618, 939
- (225)
- (226) Simoda, M. & Iben, I. Jr. 1968, ApJ, 152, 509
- (227)
- (228) Simoda, M. & Iben, I. Jr. 1970, ApJS, 22, 81
- (229)
- (230) Sneden, C. 1973, Ph.D. thesis, University of Texas
- (231)
- (232) Sneden, C., Kraft, R. P., Prosser, C. F., Langer, G. E. 1991, AJ, 102, 2001
- (233)
- (234) Sneden, C., Kraft, R. P., Langer, G. E., Prosser, C. F., Shetrone, M. D. 1994, AJ, 107, 1773
- (235)
- (236) Sneden, C. & Primas, F. 2001, NARv, 45, 513
- (237)
- (238) Spite, M. & Spite, F. 1991, A&A 252, 689
- (239)
- (240) Takeda, Y. 2003, A&A, 402, 343
- (241)
- (242) Thévenin, F., Idiart, T. 1999, ApJ, 521, 753
- (243)
- (244) Tinsley, B. 1979, ApJ, 229, 1046
- (245)
- (246) Tomkin, J., Lemke, M., Lambert, D. L., Sneden, C. 1992, AJ, 104, 1568
- (247)
- (248) Vangioni-Flam, E., Cassé, M. & Audouze, J. 2000, Phys. Reports, 333, 365
- (249)
- (250) Venn, K. A., Irwin, M., Shetrone, M. D., Tout, C. A., Hill, V., Tolstoy, E. 2004, AJ, 128, 1177
- (251)
- (252) Vergely, J.-L., Ferrero, R. F., Egret, D., Koeppen, J. 1998, A&A, 340, 543
- (253)
- (254) Wagner, R. L. 1974, ApJ, 191, 173
- (255)
- (256) Wheeler, J. C., Sneden, C. & Truran, J. W., Jr. 1989, ARA&A 27, 279
- (257)
- (258) Wiese, W. L., Fuhr, J. R. & Deters, T. M. 1996, J. Phys. Chem. Ref. Data Monograph No. 7
- (259)
| log gf | ⊙ | ||||
|---|---|---|---|---|---|
| K84 | UVES | Asp04 | |||
| (Å) | (eV) | (dex) | (mÅ) | ||
| 7771.944 | 9.1461 | 0.37 | 71.5 | 72.0 | 71.2 |
| 7774.166 | 9.1461 | 0.22 | 61.9 | 61.8 | 61.8 |
| 7775.388 | 9.1461 | 0.00 | 48.6 | 47.4 | 48.8 |
| log gf | ⊙ | |||
|---|---|---|---|---|
| K84 | UVES | |||
| (Å) | (eV) | (dex) | (mÅ) | |
| 4128.748¶ | 2.5828 | 3.63 | ||
| 4178.862¶ | 2.5828 | 2.51 | ||
| 4233.172¶ | 2.5828 | 1.97 | ||
| 4413.601 | 2.6759 | 3.79 | 38.3 | 39.5 |
| 4416.830¶ | 2.7786 | 2.65 | ||
| 4489.183¶ | 2.8283 | 2.96 | ||
| 4491.405¶ | 2.8557 | 2.71 | 69.0 | 70.6 |
| 4508.288¶ | 2.8557 | 2.44 | 83.5 | 82.9 |
| 4515.339¶ | 2.8443 | 2.60 | ||
| 4520.224¶ | 2.8068 | 2.65 | 75.0 | 76.1 |
| 4522.634¶ | 2.8443 | 2.25 | ||
| 4534.168 | 2.8557 | 3.28 | 51.3 | 51.9 |
| 4541.524¶ | 2.8557 | 2.98 | 61.0 | 60.6 |
| 4555.893¶ | 2.8283 | 2.40 | 86.5 | 84.3 |
| 4576.340¶* | 2.8443 | 2.95 | 63.5 | 62.5 |
| 4582.835¶ | 2.8443 | 3.18 | 52.9 | 52.9 |
| 4583.837¶ | 2.8068 | 1.93 | ||
| 4620.521¶* | 2.8283 | 3.21 | 49.5 | 51.2 |
| 4656.981¶* | 2.8912 | 3.60 | 33.1 | 31.1 |
| 4666.758¶ | 2.8283 | 3.28 | 47.0 | 48.6 |
| 4923.927¶ | 2.8912 | 1.26 | ||
| 5197.577 | 3.2306 | 2.22 | 79.9 | 81.8 |
| 5234.625* | 3.2215 | 2.18 | 81.0 | 83.2 |
| 5264.812* | 3.2304 | 3.13 | 46.1 | 45.4 |
| 5325.553 | 3.2215 | 3.16 | 42.1 | 41.2 |
| 5414.073* | 3.2215 | 3.58 | 26.5 | 25.6 |
| 5425.257 | 3.1996 | 3.22 | 40.7 | 41.6 |
| 6369.462 | 2.8912 | 4.11 | 18.7 | 18.3 |
| 6432.680* | 2.8912 | 3.57 | 41.3 | 40.7 |
| 6516.080* | 2.8912 | 3.31 | 53.3 | 52.5 |
| 7222.394* | 3.8889 | 3.26 | 19.4 | 18.5 |
| 7224.487* | 3.8891 | 3.20 | 18.9 | 18.9 |
| 7449.335* | 3.8889 | 3.27 | 17.1 | 18.2 |
| 7515.832* | 3.9036 | 3.39 | 13.3 | 13.5 |
| 7711.724* | 3.9034 | 2.50 | 45.9 | 46.7 |
Note. — (¶) line used for halo stars
(*) line in common with H92 (see Fig. 1).
| Model | gf-values | gf-values | gf-values¶ |
|---|---|---|---|
| atmosphere | (H92) | (this work) | (GK89) |
| Kurucz | 7.46 (0.11) | 7.45 (0.05) | 7.63 (0.05) |
| MARCS | 7.43 (0.11) | 7.42 (0.06) | 7.60 (0.06) |
| 3D | 7.44 (0.11) | 7.43 (0.05) | 7.61 (0.06) |
| HM74 | 7.46 (0.11) | 7.45 (0.05) | 7.63 (0.04) |
Note. — (*) is given in parenthesis
(**) We used 13 Fe II lines in common between this work (Table 2), H92 and GK89
(¶) solar oscillator strengths
| ID | Teff | log | [M/H] | vt | Fe II | O I | [O/Fe] | |||||
|---|---|---|---|---|---|---|---|---|---|---|---|---|
| ALTE | ANLTE | [Fe/H] | ALTE | ANLTE | [O/H] | |||||||
| (mag) | (K) | (dex) | (dex) | km s-1 | (dex) | (dex) | (dex) | (dex) | (dex) | (dex) | (dex) | |
| BD+023375 | 0.0220.022 | 6045 69 | 4.180.12 | -2.0 | 1.5 | 5.26 | 5.32 | 2.130.08 | 7.43 | 7.25 | 1.400.12 | 0.730.18 |
| BD+024651 | 0.0190.007 | 6132 58 | 3.850.15 | -1.6 | 1.8 | 5.71 | 5.76 | 1.690.07 | 7.74 | 7.53 | 1.120.02 | 0.570.09 |
| BD+083095 | 0.0120.012 | 5657 41 | 4.210.30 | -0.6 | 1.3 | 6.72 | 6.75 | 0.700.10 | 8.75 | 8.48 | 0.170.02 | 0.530.13 |
| BD+174708 | 0.0090.008 | 6091 92 | 4.010.16 | -1.4 | 1.8 | 5.86 | 5.92 | 1.530.08 | 7.95 | 7.72 | 0.930.05 | 0.600.13 |
| BD-043208 | 0.0130.013 | 6376 59 | 3.840.15 | -2.1 | 1.5 | 5.17 | 5.20 | 2.250.07 | 7.17 | 6.98 | 1.670.03 | 0.580.11 |
| BD-133442 | 0.0180.021 | 6510 40 | 4.100.30 | -2.5 | 1.5 | 4.89 | 4.92 | 2.530.06 | 6.89 | 6.67 | 1.980.07 | 0.550.13 |
| CD-3018140 | 0.0230.004 | 6305 44 | 4.280.12 | -1.7 | 1.9 | 5.63 | 5.68 | 1.770.08 | 7.66 | 7.46 | 1.190.04 | 0.580.10 |
| CD-3514849 | 0.0160.003 | 6313 43 | 4.330.15 | -2.0 | 1.5 | 5.17 | 5.21 | 2.240.07 | 7.11 | 6.95 | 1.700.06 | 0.540.10 |
| CD-4214278 | 0.0200.009 | 6006 42 | 4.520.15 | -1.8 | 1.4 | 5.51 | 5.59 | 1.860.07 | 7.41 | 7.25 | 1.400.02 | 0.460.09 |
| G011-044 | 0.0050.005 | 6092 47 | 4.490.15 | -1.9 | 1.5 | 5.49 | 5.56 | 1.890.07 | 7.52 | 7.35 | 1.300.04 | 0.590.09 |
| G024-003 | 0.0390.025 | 6077 35 | 4.410.15 | -1.4 | 1.6 | 5.92 | 5.98 | 1.470.08 | 7.67 | 7.49 | 1.160.06 | 0.310.15 |
| G053-041 | 0.0170.015 | 5970 27 | 4.380.15 | -1.1 | 1.4 | 6.24 | 6.29 | 1.160.08 | 7.89 | 7.71 | 0.940.02 | 0.220.11 |
| G064-012 | 0.0170.019 | 6660 77 | 4.240.15 | -3.0 | 1.5 | 4.26 | 4.28 | 3.170.10 | 6.36 | 6.01 | 2.640.11 | 0.530.18 |
| G064-037 | 0.0100.001 | 6658 61 | 4.270.15 | -2.8 | 1.5 | 4.44 | 4.46 | 2.990.06 | 6.35 | 6.02 | 2.630.04 | 0.360.09 |
| G066-030 | 0.0160.007 | 6316 38 | 4.180.15 | -1.3 | 1.8 | 5.91 | 5.95 | 1.500.08 | 7.99 | 7.74 | 0.910.02 | 0.590.10 |
| HD103723 | 0.0200.013 | 6013 21 | 4.260.12 | -0.6 | 1.4 | 6.66 | 6.69 | 0.760.10 | 8.41 | 8.14 | 0.510.02 | 0.250.12 |
| HD106038 | 0.0070.006 | 6012 26 | 4.450.11 | -1.2 | 1.7 | 6.08 | 6.14 | 1.310.08 | 8.11 | 7.90 | 0.750.03 | 0.560.10 |
| HD108177 | 0.0030.005 | 6133 49 | 4.420.1* | -1.5 | 1.8 | 5.81 | 5.86 | 1.590.08 | 7.85 | 7.65 | 1.000.04 | 0.590.10 |
| HD110621 | 0.0130.004 | 6083 51 | 4.010.12 | -1.4 | 1.7 | 5.84 | 5.88 | 1.570.08 | 7.95 | 7.73 | 0.920.08 | 0.650.12 |
| HD140283 | 0.0070.011 | 5753 61 | 3.700.1* | -2.2 | 1.4 | 5.12 | 5.20 | 2.250.07 | 7.13 | 6.97 | 1.680.03 | 0.570.10 |
| HD146296 | 0.0090.011 | 5733 30 | 4.130.11 | -0.6 | 1.4 | 6.69 | 6.73 | 0.720.12 | 8.49 | 8.24 | 0.410.03 | 0.310.14 |
| HD148816 | 0.0020.002 | 5825 38 | 4.140.1* | -0.6 | 1.5 | 6.68 | 6.71 | 0.740.11 | 8.67 | 8.38 | 0.270.02 | 0.470.12 |
| HD160617 | 0.0220.005 | 6065 37 | 3.820.10 | -1.6 | 1.8 | 5.70 | 5.75 | 1.700.08 | 7.43 | 7.25 | 1.400.05 | 0.300.10 |
| HD179626 | 0.0180.002 | 5818 56 | 3.850.11 | -1.0 | 1.5 | 6.28 | 6.33 | 1.120.10 | 8.40 | 8.13 | 0.520.05 | 0.600.13 |
| HD181743 | 0.0070.007 | 6021 80 | 4.450.11 | -1.6 | 1.5 | 5.64 | 5.70 | 1.750.08 | 7.65 | 7.47 | 1.180.02 | 0.570.11 |
| HD188031 | 0.0160.016 | 6196 63 | 4.130.30 | -1.5 | 1.5 | 5.77 | 5.81 | 1.640.06 | 7.77 | 7.55 | 1.100.04 | 0.540.11 |
| HD193901 | 0.0020.002 | 5721 38 | 4.520.1* | -0.9 | 1.2 | 6.41 | 6.46 | 0.990.09 | 8.21 | 8.01 | 0.640.02 | 0.350.11 |
| HD194598 | 0.0000.000 | 5970 56 | 4.310.1* | -0.9 | 1.5 | 6.32 | 6.37 | 1.080.07 | 8.22 | 7.99 | 0.660.05 | 0.420.11 |
| HD215801 | 0.0010.001 | 6085 34 | 3.830.15 | -2.0 | 1.5 | 5.23 | 5.29 | 2.160.08 | 7.28 | 7.10 | 1.550.04 | 0.610.10 |
| HD340279 | 0.0200.012 | 6521102 | 4.310.15 | -2.3 | 1.5 | 4.94 | 4.97 | 2.480.08 | 6.69 | 6.49 | 2.160.12 | 0.320.17 |
| LP0815-43 | 0.0240.015 | 6622 55 | 4.280.15 | -2.4 | 1.5 | 4.85 | 4.87 | 2.580.06 | 6.58 | 6.34 | 2.310.21 | 0.270.23 |
| Abundance | Teff | log g | vt | [M/H] |
|---|---|---|---|---|
| +50 K | +0.15 dex | +0.3 km s-1 | +0.2 dex | |
| BD-133442 (6510/4.10/-2.53)* | ||||
| [FeII/H] | +0.01 | +0.05 | 0.01 | 0.00 |
| [OI/H] | 0.03 | +0.06 | 0.00 | 0.00 |
| [OI/FeII] | 0.04 | +0.01 | +0.01 | 0.00 |
| BD+023375 (6045/4.18/-2.13)* | ||||
| [FeII/H] | +0.01 | +0.05 | 0.01 | 0.01 |
| [OI/H] | 0.03 | +0.05 | 0.00 | 0.01 |
| [OI/FeII] | 0.04 | +0.00 | +0.01 | 0.02 |
| HD140283 (5753/3.70/-2.25)* | ||||
| [FeII/H] | +0.01 | +0.05 | 0.02 | 0.00 |
| [OI/H] | 0.03 | +0.05 | 0.00 | 0.00 |
| [OI/FeII] | 0.04 | 0.00 | +0.02 | 0.00 |
| HD160617 (6065/3.82/-1.70)* | ||||
| [FeII/H] | +0.00 | +0.04 | 0.03 | 0.00 |
| [OI/H] | 0.03 | +0.04 | 0.01 | 0.01 |
| [OI/FeII] | 0.03 | 0.00 | +0.02 | 0.01 |
| G 53-41 (5970/4.38/-1.16)* | ||||
| [FeII/H] | 0.00 | +0.05 | 0.05 | +0.01 |
| [OI/H] | 0.04 | +0.04 | 0.01 | 0.01 |
| [OI/FeII] | 0.04 | 0.01 | +0.04 | 0.02 |