GMOS Spectroscopy of the S0 galaxy NGC 3115
Abstract
We present Gemini GMOS longslit spectroscopy of the isolated S0 galaxy NGC 3115. We have determined kinematical data and Lick/IDS absorption line-strength indices for the major axis out to around 9 kpc and for the minor axis out to around 5 kpc (around 2Re). Using stellar population models which include the effects of variable [/Fe] ratios we derive metallicities, abundance ratios and ages for the stellar population of NGC 3115. We find that [/Fe] remains fairly constant with increasing radius at around [/Fe] = 0.17 for the major axis but increases rapidly for the minor axis to around [/Fe] = 0.3. We also find that to first order this behaviour can be explained by a simple spheroid + disc model, where the spheroid has [/Fe] = 0.3 and the disc shows close to solar abundance ratios. The disc also appears considerably younger than the spheroid, having an age of around 6 Gyr compared to 12 Gyr for the spheroid. We compare these results to those previously presented for the globular cluster system of NGC 3115.
keywords:
galaxies: general - galaxies: abundances - galaxies: individual: NGC 3115 - galaxies: stellar content - globular clusters: general1 Introduction
Globular clusters (GC’s) are among the simplest stellar systems. The stellar content of individual clusters form primarily at one epoch and location and so are remarkably uniform in terms of metallicity, age and chemical abundances. Because GC’s are believed to form preferentially during the major star forming and mass accumulation epochs, a careful examination of the GC population of a galaxy can shed light on these periods of a galaxies’ development. This however relies on the assumption that GC’s act as good tracers of the properties of the overall stellar population formed at the same epoch. For a more thorough discussion of why this is believed to be the case see Puzia et al. (2005). It is the aim of the present work to test this hypothesis in detail for one well studied galaxy.
NGC 3115 is one of the closest and most studied S0 galaxies. Its GC system has been extensively investigated, using both photometric (Kavelaars, 1998; Kundu & Whitmore, 1998; Puzia et al., 2002), and spectroscopic (Kuntschner et al., 2002; Puzia et al., 2004) techniques. These studies find two GC sub populations of mean metallicities [Fe/H] -0.37 and [Fe/H] -1.36. Kuntschner et al. (2002) find that both GC sub populations have ages which are consistent with a single epoch of formation about 12 Gyr ago. The observations of Kundu & Whitmore (1998) and Kavelaars (1998) are consistent with the metal-rich clusters being associated with a rapidly rotating thick disc system and the slower rotating metal-poor clusters being associated with the halo of NGC 3115. The stellar population of the galaxy itself has also been examined, notably by Fisher et al. (1996) who measured the line strengths and their gradients out to a radius of 40” along the major axis, Trager et al. (1998) also examined the absorption line indices of the galaxy nucleus. Elson (1997) found evidence for a bimodal distribution of metallicities with [Fe/H] -0.7 and [Fe/H] -1.3 in the resolved stellar population of the halo located 8.5’ east of the centre and 5’ from the major axis, although Kundu & Whitmore (1998) suggested that this might be due to an instrumental effect in the metallicity calibration. Taken together these observations lead to the possibility that the metal poor sub-population formed 12 - 13 Gyr ago, with the metal rich population forming several Gyr later after the ISM has been enriched by a factor of 4, perhaps triggered by AGN activity or a merger event. A further examination of the ages and metallicities of the general stellar population and the GC population in this galaxy using updated Simple Stellar Population (SSP) models can test the plausibility of these scenarios.
This paper is structured as follows. Section 2 describes the data set and its reduction. Section 3 discusses the kinematical results of this investigation, Section 4 examines the line indices, and their use for calculation of luminosity weighted abundance ratios, age and metallicity. Section 5 describes a simple two component fit to the [/Fe] ratios of NGC 3115, Section 6 includes a general discussion of the results of the previous sections and Section 7 presents our conclusions.
| Parameter | Value Source | |
|---|---|---|
| Right Ascension (J2000) | 10h05m13.98s | |
| Declination (J2000) | -07∘43’06.”9 | |
| Morphological Type | S0- | |
| Major Diameter | 7.2 arcmin | |
| Minor Diameter | 2.5 arcmin | |
| Heliocentric Radial Velocity | 663 4 kms-1 | |
| Asymptotic Radial Velocity | 263 5 kms-1 | |
| Central Velocity Dispersion | 314 4 kms-1 | |
| Inclination of disc | 86∘ | |
| a NED. http://nedwww.ipac.caltech.edu/. | ||
| b This study. | ||
| c Capaccioli et al. (1993). | ||
2 Observations and Data Reduction
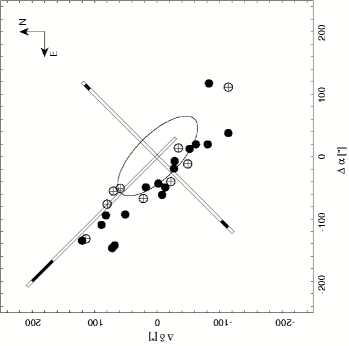
The observations were carried out on the 18/19th of December 2001 with the GMOS instrument (Hook et al., 2004) on the Gemini North telescope (Program ID GN-2001B-Q-44). The B600 grism with 600 lines/mm was used with a longslit 1 arcsec wide by 335 arcsecs long. The data were binned by 4 in the spatial dimension and 2 in the spectral dimension producing a spectral resolution of 4.4 Å FWHM (110 kms-1) sampled at 0.9 Å/pixel. The seeing throughout the observations was generally 0.8 arcsecs and the binned pixel scale was 0.3 arcsecs/pixel. The wavelength range is 3800-6400 Å. Two sets of integrations were completed, one each for the major and minor axis of the galaxy, with a total integration time for each axis of 7200s. The centre of the major axis longslit was offset from the galaxy centre along the major axis by 120 arcsecs as can be seen in Fig. 1, to extend the radial coverage and reduce the galaxy light in the sky background region. For the minor axis the sky region was defined at either end of the longslit. As can be seen from Fig. 1 the sky subtraction regions are located at large radii where the galaxy flux is only 5 - 6 of the sky level, hence over-subtraction of galaxy light should not be a major problem. This is discussed in more detail in Sect. 2.1. Two velocity standards HD97907, HD73665 and a photometric standard Feige 34 were also observed using the same experimental set up.
The standard Gemini routines were used to carry out bias subtraction, flat-fielding, and cosmic ray subtraction. In addition to these procedures it was noted that scattered light seriously compromised the measurement of line indices at large galactocentric radii. The scattered light had the effect of decreasing measured line indices by applying a constant offset to the spectra; this effect leads to the measurement of spurious age gradients at large radii. Fortunately the GMOS set-up utilised in this investigation provided the opportunity to remove this scattered light. This was possible because the 2-D spectrum produced contained 3 unexposed regions created by the bottom of the slit and two slit spacers located at 1/3 and 2/3 of the distance along the spatial dimension of the image. After bias subtraction these regions should contain no flux, however light scattered within the spectrograph meant that this was not the case. To correct for this effect it was possible to interpolate the scattered light level between the 3 unexposed regions and to subtract this from the image. In total scattered light accounted for a few of the total incident light. This however was sufficient to account for 50 of the counts at the largest radii. After correction residual scattered light should be of a negligible level.
The data was then wavelength calibrated with the wavelength calibration being accurate to 0.2 Å. The 2-D spectrum was then extracted into a series of 1-D spectra which were sky subtracted and binned in the spatial dimension until the target S/N (measured in a region near to the H line) of 20 or 60 (see Sect. 3) was reached. After binning to S/N = 60 a total of 108 (major axis) and 44 (minor axis) spectra were produced, it is from these spectra that all of the kinematics and line indices were measured, though in later figures these have been rebinned in groups of 4 (radially) to allow clearer presentation. The binned 1-D spectra were then flux calibrated using the photmetric standard and a reddening correction of E(B - V) = 0.146 (Schlegel et al., 1998) applied using the standard routines.

2.1 Sky Subtraction
Clearly an accurate sky subtraction is a necessity when attempting to measure accurate kinematics and line indices at large galactocentric radii. If the sky spectrum is strongly contaminated by diffuse stellar light it can introduce large errors in measured indices and kinematic quantities such as , h3 and h4. To investigate the magnitude of this effect several methods were used, the simplest of which was to re-reduce our data using the minor axis sky to sky subtract the major axis and vice versa. The line indices were remeasured and compared to those measured previously, for all indices considered here the changes in measured index were 0.1 Å except for the Mg line which showed quite considerable variation. This change in the Mg line can be understood as being entirely due to changes in the strength of the 5200 Å sky emission feature between the major and minor axis exposures.
The second test carried out was to reduce the data assuming 20 errors in the sky spectra, again any changes in the measured indices were 0.1 Å for all cases except for the very last (and largest) radial bin. We are therefore confident that errors introduced by the sky subtraction should be entirely negligible for all but the very largest (and most binned) radial bins.
2.2 Kinematics
The first step in analysing the spectra was to measure the line of sight velocity distribution (LOSVD) for each of the binned spectra. The publicly available implementation of the pPXF method (Cappellari & Emsellem, 2004) was employed to determine the recessional velocity, velocity dispersion, and the Gauss-Hermite moments and for the individual spectra. In this method the NGC 3115 spectra were fit in pixel space over the wavelength range 4900 - 5450 Å using both the stellar velocity templates observed during the run and additional stellar templates from the library of Vazdekis (1999). Errors were estimated by remeasuring 100 Monte-Carlo simulations of the spectra with added photon noise. Additionally, as a check of accuracy, the redshift and velocity dispersion were measured by Fourier cross-correlating the spectra against the velocity standards using the implementation in . As the two methods produce consistent results, the more comprehensive pPXF implementation was used for the remaining analysis.
2.3 Line Indices
The system of line strength indices most commonly used for optical studies is the LICK/IDS system (Worthey & Ottaviani, 1997; Trager et al., 1998). We convolve our spectra with a wavelength dependent Gaussian kernel to reproduce the LICK/IDS resolution of 9 - 11 Å.
The line strength indices were then measured for each spectrum and corrected for the smearing effects of the LOSVD following the procedure of Kuntschner (2004). This procedure corrects the line index measurements for the effects of velocity dispersion and the non-gaussian and terms. Kuntschner (2004) finds that for changes of 0.1 in with constant = 250 kms-1 the LOSVD correction changes by 5 with corresponding errors in the age and metallicity estimations of 15 - 20. Clearly for a galaxy such as NGC 3115, with central velocity dispersion of around 300 kms-1, the effect of these corrections on the spectra from the central few arcsecs could be non negligible. We therefore only measure indices for which Kuntschner (2004) has provided corrections for these effects (17 indices) though in practice we only make use of the H, H, H, Fe5015, Mg Fe5270 and Fe5335 indices in the following analysis. Errors in the line indices were calculated by 500 Monte - Carlo simulations of the input spectra.
Because of the limited number of stars in the Lick library observed during the course of the observations, an accurate determination of the offsets (see e.g., Kuntschner, 2000) between line indices measured here and the Lick system could not be determined empirically. However, we made use of the stellar library observed by Jones (1997) to determine the offsets for indices measured on flux calibrated spectra to the original Lick/IDS system assuming that the Jones library is well flux calibrated. The spectra were first broadened to the Lick/IDS resolution with a wavelength dependent Gaussian assuming a spectral resolution of the Jones library of 1.8 Å (FWHM). Then we compared the index measurements in common with the Lick stellar library (Worthey et al. 1994) for up to 128 stars depending on the availability of the measurements. The offsets and associated errors (see Table 2) were derived with a biweight estimator. The offsets are generally small ( Å) but individual indices can show larger offsets (e.g., H, Fe5015). Here, we have only considered a single offset per index and ignored possible trends with line-strength. Several indices (e.g., H, CN2, G4300) show weak evidence for such trends which are, however, difficult to quantify (see also Vazdekis 1999). Our determination of Lick offsets derived from Jones stars is in excellent agreement with an earlier investigation carried out by Worthey & Ottaviani (1997, Table 9). For the present study we apply the offsets listed in Table 2.
| Index | Offset | Number of stars |
|---|---|---|
| H | Å | 108 |
| H | Å | 110 |
| CN1 | mag | 117 |
| CN2 | mag | 115 |
| Ca4227 | Å | 126 |
| G4300 | Å | 128 |
| H | Å | 126 |
| H | Å | 126 |
| Fe4383 | Å | 126 |
| H | Å | 128 |
| Fe5015 | Å | 126 |
| Mg | Å | 128 |
| Fe5270 | Å | 128 |
| Fe5335 | Å | 128 |
| Fe5406 | Å | 126 |
Notes: Column (1) gives the index name, while column (2) gives the mean offset (Lick - Jones) to the Lick/IDS system evaluated from the Jones (1997) stars in common with Lick. Column (3) shows the number of stars used in the comparison.

3 Galaxy Kinematics
Fig 3 shows the result of the kinematical measurements, the velocity measurements are based on spectra binned to have S/N = 20, the other parameters were derived from spectra binned to have S/N = 60. As a check that changes in S/N do not affect the measured quantities, the data was re-binned to S/N of 30, 40 and 50; the kinematics were then remeasured with no significant trends in measured quantities being observed.
We shall discuss each of the parameters measured here in turn but in general the measured kinematical data is in very good agreement with published data from several authors including; Kormendy & Richstone (1992), Capaccioli et al. (1993), Bender et al. (1994) and Fisher (1997) in almost all respects except for the inferred value and the rotational velocity at large radii.
The inner rotation curve of the major axis measured here is in good agreement between all the data sets we have examined including Illingworth & Schechter (1982), Kormendy & Richstone (1992), Capaccioli et al. (1993), Bender et al. (1994), Fisher (1997) and Emsellem et al. (1999). At larger radii however other authors including Capaccioli et al. (1993) have measured an essentially flat rotation curve with rotational velocity around 260. We however observe some evidence for some drop off beyond 70 arcsecs. As observed by several authors, we find no evidence for minor axis rotation. Statistics are insufficient at present to determine if either of the GC sub-populations can be better associated with structures such as discs or spheroids within NGC 3115. It is however clear that the bulk of the clusters examined rotate in a manner consistent with that of the bulk of the stellar content even at larger radii. In fact of the 26 clusters with kinematics examined here 21 rotate in a prograde manner.
| Radius [”] | Velocity [km/s] | [km/s] | H3 | H4 |
|---|---|---|---|---|
| -130.71 | 229.33 | 106.66 | -0.098 | 0.013 |
| 4.15 | 5.49 | 0.008 | 0.007 | |
| -78.66 | 245.07 | 98.98 | -0.158 | -0.028 |
| 7.9 | 8.98 | 0.017 | 0.014 | |
| -70.52 | 244.13 | 98.48 | -0.140 | -0.062 |
| 8.04 | 10.53 | 0.018 | 0.017 | |
| -64.41 | 242.45 | 106.53 | -0.122 | -0.008 |
| 8.29 | 9.1 | 0.017 | 0.013 | |
| -59.47 | 242.97 | 101.13 | -0.147 | -0.012 |
| 8.68 | 8.88 | 0.019 | 0.013 | |
| -55.11 | 242.83 | 104.85 | -0.175 | -0.018 |
| 7.97 | 9.24 | 0.017 | 0.014 |
Notes: Table continued in electronic format. Tables 4 (minor axis kinematics), 5 and 6 (major and minor axis line strengths, ages, [/Fe] and [Z/H]) are provided in electronic form at http://star-www.dur.ac.uk/ dph3man/data.html. All data provided is binned to S/N = 60.
The velocity dispersion of NGC 3115 is also in good agreement with other measured results from the authors cited previously. However the data we present here extends to significantly larger radii than previous studies. One obvious feature of the data presented in Fig. 3 is that the minor axis velocity dispersion is considerably higher than that of the major axis at equivalent radii. The fact that the minor axis data displays a higher velocity dispersion than the major axis is not entirely unexpected, as data presented by Kormendy & Richstone (1992) hints at this being the case. The 2-D spectroscopy presented in Emsellem et al. (1999) also displays evidence for lines of constant velocity dispersion being elongated in the minor axis direction (at least within the inner 5 arcsecs). A difference in measured velocity dispersion for the major and minor axes can be explained if the galaxy consists of a fast rotating, kinematically cool disc component and a slower rotating, kinematically hot spheroidal component. This possibility is re-examined later in the light of line index measurements.
The values of determined here are entirely consistent with values determined previously.
The values measured here are generally consistent with those measured previously except at larger radii, where we observe a value of 0.0, but Bender et al. (1994) find a value of around 0.1 this discrepancy could be due to several factors including differing experimental set-up and method of measuring h3 and h4.
4 Line Indices
4.1 Abundance Ratios
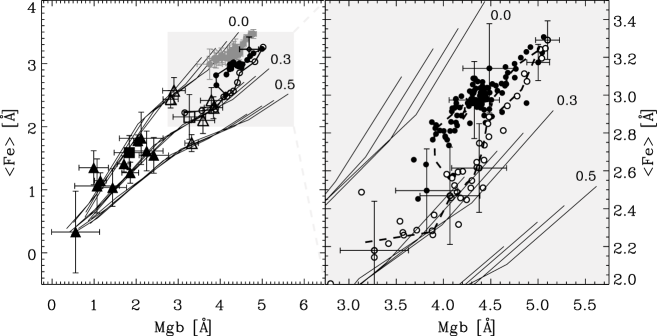
In Fig. 4 we show Mg vs. Fe where Fe = ((Fe5270 + Fe5335) / 2) (González, 1993), for the major and minor axes of NGC 3115. The GC data points are separated into red and blue sub-populations by (V - I) colour. Model predictions from Thomas et al. (2004) are overplotted for [/Fe] of 0.0, 0.3 and 0.5 with ages = 3 (left most line in each group), 5, 8 and 12 (right most line in each group) Gyr and have [Z/H] which range from -2.25 (bottom left) to +0.35 (top right). The effects of age and metallicity are essentially degenerate in this diagram, with sensitivity to abundance ratios maximised. As described in Kuntschner et al. (2002), abundance ratios are most accurately determined for larger ages/metallicities.
The measurements for the centre of NGC 3115 from the major axis data are in reasonable agreement with those from Fisher et al. (1996) and also from Trager et al. (1998). The implied - element over-abundance of [/Fe] 0.17 was determined by chi2 minimization of the data and the models of Mg vs. Fe from Thomas et al. (2004). This chi2 procedure, which is similar to the one introduced by Proctor et al. (2004) fits the set of indices used here (H, Fe5015, Mg Fe5270 and Fe5335) to the models of Thomas et al. (2004), allowing variable ages, [/Fe] and [Z/H]. A possible break in the value of [/Fe] is visible for Mg 4 with an increase in [/Fe] to around 0.25. In comparison, the minor axis data starts off at values consistent with the central portion of the major axis, and then begins to trend off towards [/Fe] = 0.3 much more rapidly.
A break in the major axis data and differences between the two axes can be interpreted as evidence for the existence of at least two distinct populations, with typical values of [/Fe] 0.17 and 0.3. Since a move towards lower Mg and Fe corresponds to a move to increasing radius it raises the possibility of observing radial trends in the strengths of other line indices, which will be examined in more detail in the next section.
Our data extends to sufficiently large radii that the mean metallicity of the stellar population is similar to that of the most GCs. Fig. 4 shows that on both the major and minor axis the mean abundance ratios at the largest radii are also consistent with those of the cluster population although the spread in abundance ratios appears to be smaller. No significant population of GCs are found with properties similar to the stellar population at intermediate radii on the major axis.
4.2 Radial Profiles of Indices
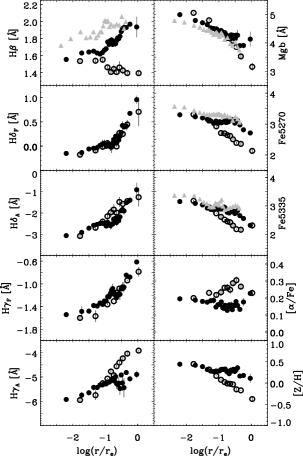
Fig. 5. displays the radial profiles of the measured Lick indices, [/Fe] and [Z/H]. The values of re used here are those listed in Capaccioli et al. (1993) for the spheroidal component of the galaxy.
The differences in [/Fe] between major and minor axes is more clearly demonstrated here, as it is evident that at larger radii the major axis data again becomes consistent with that of the minor axis. This type of behaviour could be understood in terms of changes in the relative contributions of disc and spheroidal components, with both major and minor axes being dominated at small radii by a nuclear component. At intermediate radii the major axis would be affected by the influence of the disc component, whereas the minor axis would simply be tracing the stellar content of the spheroidal component. The change in the behaviour of the major axis at large radii could then be understood as evidence for truncation of the disc component contribution at around 80 arcsecs on the major axis.
The other metallicity tracing indices (Mg Fe5270 and Fe5335) display similar trends, with slight evidence for breaks in the major axis data at around the same radius as the one seen in [/Fe]. This has previously been observed by Fisher et al. (1996) in their edge-on sample of S0 galaxies (unfortunately they did not examine the minor axis of NGC 3115), who found that the Mg2 index is stronger with a lower gradient at larger radii on the major axis than on the minor axis. As can be seen from Fig. 4 the values for Mg Fe5270 and Fe5335 determined here for the major axis are in good agreement with those determined by Fisher et al. (1996). Small differences between the two datasets can be attributed to variations in the experimental set-up, the different methods employed to correct for the broadening effect of the LOSVD, and the uncertainty on our correction to the Lick system.
4.3 Age Determinations
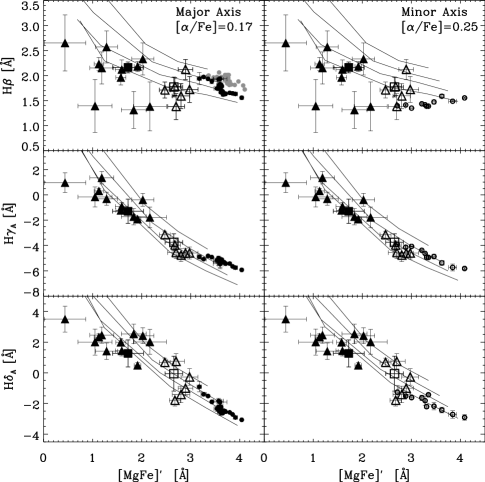
Fig. 6. examines the behaviour of age-sensitive indices along the major and minor axes of NGC 3115. Model grids are interpolated between the [/Fe] = 0.0 and 0.3 models from Thomas et al. (2003, 2004) with [/Fe] determined as described previously. Note that whilst the [/Fe] ratios used to produce the major axis grids are appropriate for the longslit data described here, they are generally not appropriate for the GCs which tend to have mean [/Fe] 0.3. However the minor axis grids provide a good approximation to the mean [/Fe] of the GC’s and hence the best age determinations for the clusters.
The H, H and H indices are plotted against [MgFe]′ where [MgFe]′ = (Thomas et al., 2003). This index was found by Thomas et al. (2003) to be independent of [/Fe] and a good tracer of total metallicity.
There appears to be a difference in age between the two axes with the major axis having a mean age of around 5 - 8 Gyr and the minor axis an age of around 12 Gyr. This would suggest a small amount of star formation may have continued in the disc component for several Gyr after the formation of the spheroid.
The age determinations from the H index appear to change at lower [Z/H] but in the opposite sense for each axis, with the major axis appearing to become younger and the minor axis older. As H is relatively unaffected by changes in [/Fe] this cannot be explained as being due to changes in [/Fe] along either axis, but could be explained for the major axis by more recent star formation in the outer parts of the disc (in spiral arms perhaps). Another possibility would be that some undetected H emission in the inner regions of the disc weakens the observed H index in the inner regions. This final possibility however seems unlikely since we find negligible signs of [OIII] emission. For the minor axis data it would seem plausible that the populations at larger radii could be older and would in fact represent the older generation of stars also being traced by the GC populations. This possibility would seem to gain credence from the fact that at larger radii the minor axis data displays [/Fe], ages and [Z/H] values that are entirely consistent with those determined from the red GC sub-population.
The remaining age estimators H and H also show an age offset between the minor and major axis in the same sense as H, but there is little or no evidence for an age gradient.
Fig.7. shows the radial profiles of ages determined by the chi2 minimisation described previously. As should be expected the trends previously described are obvious with the major axis appearing to have an age of 5 - 8 Gyr and the minor axis having an age of between 12 - 14 Gyr.
A further comment is that despite the use of different age sensitive indices our age determinations for the GC’s are entirely consistent with those of Kuntschner et al. (2002) with both GC populations having a mean age of around 12 Gyr. In fact the agreement is now improved as the mean ages of the sub-groups determined by Kuntschner et al. (2002) varied from 6 Gyr to 12 Gyr, depending on the Balmer line being examined. This spread can now be understood as being due to the [/Fe] sensitivity of the H and H lines used in the Kuntschner analysis, which can now be corrected using the newer SSP models provided by Thomas et al. (2004).
5 A Simple Two Component Model
To test the hypothesis that radial trends in [/Fe] could be explained by intrinsic differences in the disc and spheroid components a simple model was constructed.
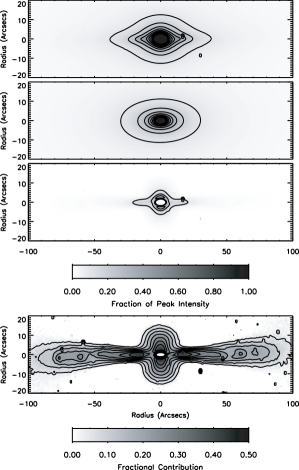
The relative contributions of the disc and spheroid components were determined from archived GMOS images of NGC 3115 obtained in 2004 (Program ID GS-2004A-Q-9, PI R.M.Sharples) in the , and bands. The program GALFIT (Peng et al., 2002) was used to carry out a simple bulge to disc decomposition. Because we only wish to know the relative contribution of the two components and we are only interested in a simple first order model, a full isophotal decomposition was unnecessary and a simple de Vaucouleurs model of the spheroid with re = 93 arcsecs (Capaccioli et al., 1993) was subtracted from the original image to isolate the disc light contribution. As a test of this approach, we also allowed GALFIT to attempt to fit the images with a Sersic function with variable re and , both with and without masking of the disc region and with varying starting parameters. The results in terms of re and varied considerably but the distribution of flux in the residual image remained fairly constant, with the disc tending to provide a peak of around 30 - 40 of the flux on the major axis.
The results of this bulge subtraction can be seen in Fig. 8. As previously noted by Capaccioli et al. (1988) the disc shows considerable flaring in the outer regions, which these authors attributed to the disc ceasing to be self gravitating in this region. There is also evidence for structure within the disc (spiral arms?), which could be taken as evidence for some residual star formation events. Note that the inner region is not well fit by this model. A more realistic model would require several components, but is beyond what is required for the present analysis.
The model can be used to predict [/Fe] at any point, if it is assumed that the residual light traces an enriched disc and nuclear component with [/Fe] 0.0 and that the fitted spheroid traces a lower Fe - enriched population of [/Fe] 0.3. By weighting the [/Fe] value by the relative fractions of the two components it is possible to estimate the observed [/Fe] at any point. Fig. 9 shows the result of this procedure for both axes. This simple model reproduces the general trends observed with [/Fe] quickly rising on the minor axis and a much more Fe-enriched major axis which trends back towards the asymptotic values of the minor axis at large radii. The differences between the model and observed values can be explained by a number of factors including incorrect values for the intrinsic [/Fe] of the two components and the effect of other unaccounted for components. Other factors such as intrinsic gradients in [/Fe] could also play a part. However to first order we believe that differences in [/Fe] between the two axes of NGC 3115 can be explained as being due to the existence of at least two distinct stellar populations within the galaxy, with different spatial distributions and enrichment histories.


6 Discussion
In general all of our kinematical measurements are in good agreement with previous studies, the most interesting finding being that the disc of the galaxy is particularly cold (disc / disc 2) and hence rotationally supported. An interesting extension to this work would be to improve the statistics of the kinematics beyond 100 arcsecs, which would probe the region where substantial flaring of the disc has been observed. The fact that the rotation velocity on the major axis remains high even at large radii where the integrated light is dominated by the underlying spheroid implies that in NGC 3115 the halo is also rotating significantly (v / 1.5) in the same sense as the disc.
We have confirmed that the GC population shows clear evidence for rotation, in the same sense as that of the disc. Statistics on the GC kinematics at present are not sufficient to associate particular cluster populations to any specific structural feature.
Our investigation of the Lick absorption line indices has shown that the stellar disc component is considerably different from the spheroidal component in almost all measured parameters. Most informative in terms of constraints on formation theories is the implication that the disc of the NGC 3115 is several Gyr younger, and significantly enriched in metals, compared to the spheroid of the galaxy. This has been hinted at previously by studies of the optical colours of NGC 3115, for example Silva et al. (1989), who noted that in B - the disc was 0.5 mag bluer than the spheroid. This colour difference however could be attributed either to a younger stellar population in the disc or to the disc having a lower metal abundance compared to the spheroid. We have convincingly demonstrated that a lower metal abundance cannot explain this colour difference since the major axis displays a than that of the minor axis. The difference in colour can therefore clearly be attributed to an age difference of 5 - 7 Gyr for the two components and is also consistent with the observation that [/Fe] ratios are lower on the inner region of the major axis.
The red GC sub-population is most consistent with the larger radii minor axis data in its measured parameters. This suggests that both the spheroid and the red GC population may have formed from the same material at around the same time. An interesting extension would be to probe to larger radii to see if the observed trends in metallicity and [/Fe] shown in Fig. 5 continue, and eventually lead to the minor axis spheroid data tracing stellar populations similar to those that make up the lower metallicity blue GC population. This blue population of GC’s could then possibly be attributed to an initial burst of star formation during the halo formation of the galaxy. One unanswered question is whether or not there exists a GC population associated with the substantial younger disc component of this galaxy. At present the number of GC’s for which spectroscopy exists is too small to exclude this possibility. Though at present none of the GC’s examined have line-strength indices comparable to those measured for the disc component. If no such population exists, this in itself would prove interesting as it would imply that GC’s are not necessarily formed whenever a sizeable amount of star formation occurs.
7 Conclusions
We have presented new kinematical data and absorption line strength measurements for the major and minor axes of the S0 galaxy NGC 3115, and have compared these measurements to similar data for the GC system of NGC 3115. Our main conclusions are:
-
•
NGC 3115 has a significant stellar disc component, which is both kinematically and chemically distinct from the surrounding spheroidal component.
-
•
The spheroidal component of NGC 3115 is consistent with having a uniformly old 10 - 12 Gyr age and [/Fe] of 0.2 - 0.3. At large radii the minor axis (which should trace the spheroidal component exclusively beyond the central few arcsec) is consistent in age, [/Fe] and metallicity with the red GC sub-population, hinting at a common origin for the two.
-
•
The major axis data displays clear evidence for contamination by a younger (5 - 8 Gyr old) more chemically enriched stellar disc. The observation that the disc of NGC 3115 is bluer than the spheroid is primarily an age difference not a metallicity difference effect.
-
•
Previously observed discrepancies in age determination between the H and higher order Balmer lines for the GC sample can largely be explained by changes in the higher order Balmer lines due to varying [/Fe].
-
•
The GC system displays clear evidence for prograde rotation in the same sense as the disc and spheroidal components.
Acknowledgments
The authors would like to thank Mark Swinbank and Jim Geach for their useful input and discussions. We also thank the anonymous referee for several suggestions which improved the presentation of this paper. MAN acknowledges financial support from PPARC.
Based on observations obtained at the Gemini Observatory, which is operated by the Association of Universities for Research in Astronomy, Inc., under a cooperative agreement with the NSF on behalf of the Gemini partnership: the National Science Foundation (United States), the Particle Physics and Astronomy Research Council (United Kingdom), the National Research Council (Canada), CONICYT (Chile), the Australian Research Council (Australia), CNPq (Brazil) and CONICET (Argentina)
References
- Bender et al. (1994) Bender R., Saglia R. P., Gerhard O. E., 1994, MNRAS, 269, 785
- Capaccioli et al. (1993) Capaccioli M., Cappellaro E., Held E. V., Vietri M., 1993, A&A, 274, 69
- Capaccioli et al. (1988) Capaccioli M., Vietri M., Held E. V., 1988, MNRAS, 234, 335
- Cappellari & Emsellem (2004) Cappellari M., Emsellem E., 2004, PASP, 116, 138
- Elson (1997) Elson R. A. W., 1997, MNRAS, 286, 771
- Emsellem et al. (1999) Emsellem E., Dejonghe H., Bacon R., 1999, MNRAS, 303, 495
- Fisher (1997) Fisher D., 1997, AJ, 113, 950
- Fisher et al. (1996) Fisher D., Franx M., Illingworth G., 1996, ApJ, 459, 110
- González (1993) González J. J., 1993, Ph.D. Thesis, University of California, Santa Cruz
- Hook et al. (2004) Hook I. M., Jørgensen I., Allington-Smith J. R., Davies R. L., Metcalfe N., Murowinski R. G., Crampton D., 2004, PASP, 116, 425
- Illingworth & Schechter (1982) Illingworth G., Schechter P. L., 1982, ApJ, 256, 481
- Jones (1997) Jones L. A., 1997, Ph.D thesis, Univ. North Carolina, Chapel Hill
- Kavelaars (1998) Kavelaars J. J., 1998, PASP, 110, 758
- Kormendy & Richstone (1992) Kormendy J., Richstone D., 1992, ApJ, 393, 559
- Kundu & Whitmore (1998) Kundu A., Whitmore B. C., 1998, AJ, 116, 2841
- Kuntschner (2000) Kuntschner H., 2000, MNRAS, 315, 184
- Kuntschner (2004) Kuntschner H., 2004, A&A, 426, 737
- Kuntschner et al. (2002) Kuntschner H., Ziegler B. L., Sharples R. M., Worthey G., Fricke K. J., 2002, A&A, 395, 761
- Michard & Marchal (1994) Michard R., Marchal J., 1994, A&AS, 105, 481
- Peng et al. (2002) Peng C. Y., Ho L. C., Impey C. D., Rix H.-W., 2002, AJ, 124, 266
- Proctor et al. (2004) Proctor R. N., Forbes D. A., Beasley M. A., 2004, MNRAS, 355, 1327
- Puzia et al. (2005) Puzia T. H., Kissler-Patig M., Thomas D., Maraston C., Saglia R. P., Bender R., Goudfrooij P., Hempel M., 2005, A&A, 439, 997
- Puzia et al. (2004) Puzia T. H., Kissler-Patig M., Thomas D., Maraston C., Saglia R. P., Bender R., Richtler T., Goudfrooij P., Hempel M., 2004, A&A, 415, 123
- Puzia et al. (2002) Puzia T. H., Zepf S. E., Kissler-Patig M., Hilker M., Minniti D., Goudfrooij P., 2002, A&A, 391, 453
- Schlegel et al. (1998) Schlegel D. J., Finkbeiner D. P., Davis M., 1998, ApJ, 500, 525
- Silva et al. (1989) Silva D. R., Boroson T. A., Thompson I. B., Jedrzejewski R. I., 1989, AJ, 98, 131
- Thomas et al. (2003) Thomas D., Maraston C., Bender R., 2003, MNRAS, 339, 897
- Thomas et al. (2004) Thomas D., Maraston C., Korn A., 2004, MNRAS, 351, L19
- Trager et al. (1998) Trager S. C., Worthey G., Faber S. M., Burstein D., Gonzalez J. J., 1998, ApJS, 116, 1
- Vazdekis (1999) Vazdekis A., 1999, ApJ, 513, 224
- Worthey & Ottaviani (1997) Worthey G., Ottaviani D. L., 1997, ApJS, 111, 377