An analysis of spectra in the Red Rectangle nebula
Abstract
This paper presents an analysis of a series of spectra in the Red Rectangle nebula. Only the reddest part of the spectra can safely be attributed to light from the nebula, and indicates Rayleigh scattering by the gas, in conformity with the large angles of scattering involved and the proximity of the star. In the blue, light from HD44179, refracted or scattered in the atmosphere, dominates the spectra. This paper questions the reliability of ground-based observations of extended objects in the blue.
1 Introduction
This paper will pursue the investigations initiated in a preceding article (Zagury, 2006) on the effects of atmospheric extinction on starlight.
Long slit spectroscopy of a sample of objects (stars, nebulae, galaxies) was used to determine the nature of the light received by a telescope at close angular distances from a star, before the spectrum reaches the night sky spectrum. Direct light from the star, refracted by the atmosphere, will be detected over the first few arcseconds. Over the next few tens of arcseconds, forward scattering of starlight by aerosols will dominate the spectrum, until it fades out under the night sky spectrum.
Light from the central star, refracted or scattered in the atmosphere, can not be neglected when dealing with spectra of a nebula, since it will compete with the light scattered by the nebula. The continua of the spectra of NGC6309, NGC6891, and NGC2022, for instance, as they are given in the Kwitter-Henry database (http://oit.williams.edu/nebulae/browse.cfm), more likely reflect the spectrum of the central star, than the true nebular spectra (Zagury, 2006).
If this preceding paper emphasized the importance of atmospheric extinction for our understanding of ground-based observations of nebulae, it was not quantitative enough to separate, in the observed spectrum of a nebula, atmospheric effects from true nebular spectrum. This problem will guide the present paper, which will focus on spectra of the Red Rectangle nebula, observed at different positions in the nebula, and at different dates.
2 Observations
The observations of the Red Rectangle used in this article come from three observing runs at Fred L. Whipple Observatory, in December 2001, February 2002, and March 2003. Spectra were acquired with the FAST spectrograph, mounted on the Tillinghast 1.5 meter telescope. Technical informations on FAST will be found in Fabricant et al. (1998).
FAST is a long slit spectrograph, which samples a region 3’ long and 3” wide on the sky and covers (in the configuration used for the observations) the [, ] wavelength range, with a spatial resolution of 0.61”/pixel. The slit is oriented E-W. Different positions of the slit across the nebula are thus characterized by their declination offset from HD44179.
The 2-D spectra presented here were binned by two (December 2001, March 2003) or by four (February 2002), along their spatial dimension, during the data reduction process (Tokarz & Roll 1997), yielding a final angular resolution of 1.2” or 2.4” per pixel. 1-D spectra of stars are extracted from the 2-D arrays by adding the spectra far above the background. The wavelength resolution is /pix. The seeing during the three observing runs was good, 1-2”.
Main informations on the data are grouped in Table 1. Figure 1 shows the projected positions of the slit on the nebula, for each run, and specifies the position on the slit of the pixel with maximum signal.
An observation will be designated by its position (, …), as it is given in Table 1, and the date of observation. The spectrum at pixel ‘’, extracted from the 2-D array of an observation, will be noted ‘’. ‘’ stands for the ozone cross-section, and is expressed in cm2 . Vertical dotted lines on the plots give the limits of the ozone absorption region.
3 December 2001 observations
3.1 HD44179
Spectra extracted from the 2-D arrays of HD44179’s observations, at the beginning and at the end of December 2001 run, are plotted Figure 2.
For each 2-D array a main spectrum is identified ( for the first observation, for the second), which fixes the direction of HD44179. On each side of the main pixel the intensity decreases steeply, to less than count/s, over pixels or ”. The shape of the spectra with level above count/s evolves in a regular way, with a systematic increase of the average slope of the spectra with increasing pixel number (see Zagury, 2005). Some spectra, and in the first observation, , , in the second one, have a slight bump in the red (the red bump is more pronounced in February 2002 observation, Section 4) which is due to the nebula. ” away from the direction of HD44179, the spectra have reached a shape (mentioned as the background on the plots) which is common to the following spectra and to both sides of HD44179.
The noise level is count/s, less but not far from the level of the background. The background spectra of Figure 2 are the average of 8 spectra at a mean distance of 11” from HD44179. The backgrounds, identical in the two observations, are interpreted (Zagury, 2006) as light from HD44179 scattered by aerosols in the atmosphere, with a spectrum proportional to the spectrum of HD44179 and to (Figure 3). Moving away from HD44179, the background progressively diminishes in intensity, with a constant shape, which will ultimately also be modified, because of the attenuation of the scattering and the merging of the night sky spectrum (Figure 3, bottom plot).
Between the beginning and the end of the run the airmass has increased from 1.41 to 1.48. The result is a decrease of the 1-D spectrum of HD44179 by a factor of 1.15, a slightly more pronounced depression in the ozone absorption region, and an increase of the bending in the blue (a decrease of the blue slope, bottom spectra of Figure 4). These differences between the spectra can be corrected analytically (top spectra of Figure 4).
3.2 Nebula
The 2-D arrays of the December 2001 nebular spectra are presented in Figures 5 (right column) and 6. Spectra from positions and , which are similar to ’s (see below), were not represented. The main spectrum for each observation is in plain line. Its position on the slit, and in the nebula, is marked on Figure 1.
The red bump, characteristic of the Red Rectangle, is present in all 2-D arrays, with a spatial extent that matches the width of the nebula at the corresponding declination [derived from the red Digital Sky Survey (DSS2) image].
Due to the long exposure times low level background spectra can be determined with better accuracy than for the 2-D arrays of HD44179. Two background spectra are represented in solid line on each plot, one immediately outside the nebula, one close to the extremities of the slit. Backgrounds of all nebular observations, taken at the extremities of the slit, are identical (in shape and intensity, Figure 7, left). Their shape matches the night sky spectrum of Massey & Foltz (2000), except in the blue where there is an excess of signal for the backgrounds (Figure 7, middle). This excess is attributed to remaining light from HD44179 scattered in the atmosphere, and is well fitted by the 1-D spectrum of HD44179 (first observation of the run) times (and a constant factor, middle plot of Figure 7). Subtraction of the scattered light component will reproduce the Kitt Peak night sky spectrum (right plot of Figure 7). Backgrounds taken close to the nebula are equal to the far-away backgrounds with an additional component of light from HD44179 scattered in the atmosphere (Figure 8).
The first position observed in the nebula, ” north from HD44179, is close enough to HD44179 to consider a possible contamination of the spectra by direct light from HD44179 [as for NGC6309 and NGC6891 in Zagury (2005)]. In the blue, the main spectrum (, right plot of Figure 5) of the 2-D array recalls, by its shape as well as by its intensity, spectra of the 2-D arrays of HD44179 taken at approximately equal distances from the star, and of HD44179 first observation, and of the second observation (Figure 9). It is (in the blue) exactly proportional to of the first observation, and nearly proportional to of the second one (a small correction for gas extinction is necessary to superimpose the spectra in the blue); the spectrum of the nebula is superimposed, in the red, on the spectrum of HD44179.
Ouside the nebula, still at position , the shape of the background spectrum evolves from a predominance of light from HD44179 scattered in the atmosphere (top background spectra of Figure 5, right column plots, with a shape identical to the background found for the observation of HD44179) to a predominance of the night sky spectrum (bottom background spectra), at the edges of the slit.
The other observations of the nebula are farther away from HD44179; the proportion of direct light from HD44179 should be highly diminished, which explains the important fall in intensity of the spectra (Figures 6, 9, and 10).
Main spectra at positions 3, 4 and 5 have rigorously identical shapes; they differ by a constant factor close to 1 (dotted spectra of Figure 10). The blue part of , , , 2-D arrays keeps a constant shape in and out of the nebula (Figure 11), with only a diminution of the magnitude when moving away from it. The spectra are also observed at about the same distance (8”-15”) from HD44179 where the backgrounds for the HD44179 observations were established (Section 3.1). In the blue they are similar to these backgrounds, both in shape and in magnitude (a few 0.1 count/s). The backgrounds from the observations of HD44179 would superimpose well, with a scaling factor close to 1, on the blue part of the spectra of Figure 11. On the figure, the backgrounds are fitted, in the blue, by the spectrum of scattered light (by atmospheric aerosols) from HD44179 (proportional to the product of the spectrum of HD44179 by ).
Spectra from , , , 2-D arrays, in the nebula, are thus made of two components: nebular light in the red, stacked on scattered light (from HD44179) in the atmosphere, which dominates in the blue. The red rise is constant for the closest positions to the main pixel, but its slope will diminish towards the edges of the nebula, because of the increasing proportion, in the spectra, of scattered light in the atmosphere.
The main spectrum () of the 2-D array at position is of higher level. The red rise is as for the main spectra at positions 3, 4, and 5, but the spectra differ in the blue (Figure 10). The blue part of is in-between, and proportional to spectra and , from the first observation of HD44179 (Figure 12), observed at about the same angular distance from HD44179 as (of ) is. The blue parts of the other spectra of 2-D array are either like that of (for pixel numbers close to 52), or, like the blue part found previously at positions , , .
It will be concluded that for all spectra in the nebula, only the red part of the spectra can safely be attributed to light from the nebula. In the blue, the spectra are dominated either by direct, refracted, light from HD44179, or by light from HD44179 forward scattered by atmospheric aerosols.
One can wonder why of is three times larger than of (Figure 10), while position is closer to HD44179 than is. The reason might be the increase of airmass between the two observations (Table 1), which diminishes the amount of direct light from HD44179 and increases the scattered light in observation.
4 February 2002 observations
There are three February 2002 observations, one of HD44179, one ” north of HD44179 (position 1), and one of HD44113.
The two star observations are plotted on Figure 13. The decrease of the signal, when moving away from the main pixel ( and respectively for HD44179 and HD44113, solid line on the plots), is similar in both observations, although it is faster for HD44179 (while HD44179 and HD44113 have comparable magnitudes): it occurs within 1-2 pixels (”) from for HD44179, within 4 pixels (”) for HD44113 (as for the December 2001 observation of HD44179). This may be related (Zagury, 2006) to the exposure time, which, for HD44179, has been reduced from 15 seconds in December 2001 to 5 seconds in February 2002. The exposure time for HD44113 is 15 seconds, as it was for the December 2001 observations of HD44179.
The spectrum of the nebula clearly appears in the red, superposed on the spectrum of HD44179, for spectra and , and . The nebular contribution to the spectra is far more significant in this observation than it was for December 2001 ones, which, a priori, can be due either to a slightly different position of the slit axis (” wide) in declination, or, more likely, to a difference in atmospheric extinction between the two nights [which implies a lower extinction for February 2002 observations and could be related either to the lower airmass (Table 1), or, to the smaller exposure time of these observations]. The nebular spectrum is present in the red only and does not seem to perturbate the spectrum of HD44179 in the blue.
The nebular 2-D array was presented, along with the one of December 2001 observation at the same declination, in Figure 5. Two main spectra ( and ) merge out from the 2-D array (rather than one in December 2001 observations), which is to be attributed to the binning by four procedure used in the data reduction of February observations. The shape of (a fit will be proposed Section 6), and the decrease of the spectra on each side of the central pixels, indicate, as for December 2001 observation, that the spectra are dominated in the blue by direct light from HD44179: the nebular spectra are superposed on HD44179’s spectra, and restricted to the red. The background reaches the night sky spectrum at the edges of the slit.
5 March 2003 observations
5.1 HD44179
The two March 2003 observations of HD44179 are similar, and were discussed in Zagury (2005) (Figures 1 and 2). As for February 2002 observation, direct light from HD44179 is spread over ”, i.e. ” (3-4 pixels) on each side of the central pixel. The noise level is count/s, higher than in December 2001, which is due to the smaller exposure time.
5.2 Nebula
On Figure 14, March 2003 observations of the Red Rectangle nebula are classified, from left to right and top to bottom, by decreasing importance of the signal. Main features are the same as for December 2001 observations.
The backgrounds away from the nebula are identical (Figure 15, left), in shape and intensity. The match with Massey & Foltz (2000) night sky spectrum is good except in the blue. The excess found in the blue reproduces the background of HD44179 observations; it is proportional to the product of HD44179 1-D spectrum (first observation) by , and is interpreted as remaining light from HD44179 scattered in the atmosphere (Figure 15, right).
Main spectra at positions , , and are identical, up to a constant factor (Figure 16).
In the red (Figure 14), the red bump of the Red Rectangle is present, within the nebula, in all observations. The red rise keeps a constant slope around the main pixel of an observation, and will diminish toward the edges of the nebula; the bump disappears when the pixel is out of the nebula.
The red rises of the main spectra of all observations (except ) are proportional (Figure 17, left). main spectrum shares the same slope in the reddest part of the red rise, but is less steep from the ozone absorption region onwards (Figure 17, right).
The shape of the blue spectra, for a given 2-D array of one of the four observations with lower signal (, , , ), is the same in and out of the nebula, down to the background (Figure 14). All four observations blue spectra are proportional (Figure 18). One will deduce that, as for December 2001 observations, the blue part of these spectra is mainly light from HD44179 scattered in the atmosphere (Figure 18); and that the difference between the spectra at and at positions , , , is due to the relative proportion in the spectra of light from HD44179 scattered in the atmosphere.
The blue decrease of the main spectrum () at position perfectly reproduces the blue part of spectrum (scaled by a factor of 0.1) of the first observation of HD44179 (Figure 19).
(Figure 14) is the nebular observation with the highest signal and the closest to HD44179. The nebula bump is perceived from pixel 43 to pixel 56. The main spectrum is , which is flat in the blue. Such a flat blue slope is observed in the February 2002 observation of HD44179 (, Figure 13, for instance), and can be attributed to direct light from HD44179. Spectra close to differ by a gas extinction factor only (, Figure 20), as it was shown to be the case with the spectra from HD44179’s 2-D array (Zagury, 2006). Away from pixel 48, the spectra match that of other observations in the nebula, observed at comparable distances from HD44179: spectrum of for instance is identical (with a scaling factor of 1.3) to the main spectrum, , of , the blue part of which was shown to be proportional to from the first observation of HD44179 (Figure 19).
As for December 2001 or February 2002, the spectra of the nebula observed in March 2003 reveal the light from the nebula in their reddest part (where atmospheric extinction is minimized, before ozone absorption), but are, in the blue (after the ozone absorption region), dominated by light from HD44179 -direct light or light scattered in the earth atmosphere.
6 Comparison of the observations at different dates
Figure 21 compares the backgrounds, observed away from HD44179, of the three observing runs. In the red, a scaling factor close to 1 will give a good superimposition of the spectra. In the blue, the three backgrounds differ by the amount of light from HD44179 scattered in the atmosphere. The difference between December 2001 and March 2003 backgrounds is small. It becomes significant with the February 2002 background, which is understandable since only the closest position to HD44179 was observed in February 2002. We conclude that the night sky was nearly the same for the three runs. It implies that the conditions of observation, the sensitivity of the detector and the atmospheric extinction are comparable.
The 1-D spectra of HD44179 observed at different dates superimpose well after correction for a difference of Rayleigh extinction (Figure 22) between the observations.
Main spectra at positions and are proportional in March 2003 (Section 5), while they have different shapes in December 2001 observations (Section 3). The pointing of the telescope could be responsible for part of this discrepancy, but the most reasonable explanation is that the difference of optical depths (airmass) between the two dates changes the proportion of refracted and scattered light, from HD44179, in the spectra. It means that the standard way of reducing data, subtraction of a background and normalization by the spectrum of a reference star, can not be applied to these observations.
A precise position-to-position comparison of December 2001 and March 2003 observations (Figure 23), for positions and , shows that the red rise of the nebular spectra is identical from one date to the other, while the spectra differ in the blue from the ozone absorption region onwards.
is the nearest position to HD44179 observed in the nebula, and the one for which direct light from HD44179, refracted in the atmosphere, enhances the level of the spectrum far above that at the other positions. It is also the position for which differences between the different dates are the most striking (Figure 24). The exact position of the slit axis with respect to HD44179 can influence the level of the spectrum. The high airmass (A.M=1.51, against 1.41 for December 2001 and 1.38 for February 2002) probably contributes to the low level of March 2003 spectrum, and its steep rise in the red, which is close to what is observed at larger distances from HD44179: an increase of extinction diminishes the direct light from HD44179, which is the main component of the spectra in the blue, and the reason for its high level; the Red Rectangle nebular bump is then highlighted.
This further raises the question of the influence of the blue continuum on the slope of the red rise at , for December 2001 and February 2002 observations. Figure 24 (right plot), for instance, shows that it is possible to reproduce February 2002 spectrum by the sum of spectra extracted from the 2-D arrays of December 2001 observations of HD44179 and of position . We also note, still concerning the 2-D array of February 2002 observation, that when the blue continuum diminishes, the slope of the red rise increases to its value at positions farther away from HD44179 ( of , February 2002 observation, for instance, is identical to the main spectrum of , December 2001 run).
7 Discussion
The previous analysis leads to two first conclusions. One is that the only part of the spectra which can be attributed to light from the nebula is the red bump, the spectrum at smaller wavelengths being light from HD44179 refracted or scattered in the atmosphere. The second conclusion is that only the red rise of the bump is not modified from one observation to another.
What is the meaning of the bump, and where is the light from the central star scattered by the nebula? Either the light from HD44179 scattered by the nebula really is reduced to a small offset, in the blue and maybe in the red; or, it is seen in the red only because it is strongly extinguished from the ozone absorption region onwards (and towards the UV).
In the first case, the red bump could be, as it has been admitted so far, an emission process due to some kind of particle which would absorb light in the UV and fluoresce in the red. Light from HD44179 scattered by the nebula is then negligible compared to the fluorescence process. However, no such particles have ever been synthetized on earth with the required spectrum, and their nature is still today, after some thirty years of research, a speculative subject (Li & Draine 2002; Van Winckel, Cohen & Gull 2002).
Also in this case, the red bump could result from extinction and scattering by large grains or by the gas [such an explanation was suggested by Cohen et al. (1975), see Section A (Appendix)]. Forward scattering by large grains would give a spectrum ( a constant), with a much too large bump to fit the data [all spectra of the Red Rectangle nebula found in the litterature give a ratio of FWHM to central wavelength in the range 0.18-0.30, while scattering by large grains would imply a ratio close to 4]. It is also not compatible with the large angles of scattering involved in the present case. Scattering by gas will have a spectrum (Rayleigh, 1871), which implies a constant ratio of FWHM to central wavelength of , also too large to match the observations.
In addition to the absence of scattered light from the nebula in the blue, if the red bump is a true nebular feature (an emission process or due to scattering), it is still necessary to understand the reasons for the variability of the blue decrease of the bump (Figure 10, Figure 17, Figure 20, Figure 23), while the red rise keeps, in general, a constant slope (modifications of the red slope are observed close to HD44179 only, and may be due, as pointed out in Section 6, to the underlying continuum of HD44179 light, refracted or scattered in the atmosphere). The correlation between the modifications of the blue side of the bump, and the ozone absorption region, would have to be pure coincidence, as would have to be the transformations used to superimpose the main spectra of March 2003 observation (Figure 20), which attest the role of atmospheric extinction on the decrease.
On the other hand, atmospheric extinction would well explain the particularities of the Red Rectangle nebula spectra. The red rise of the bump is constant, within the nebula, in all observations. It corresponds to a wavelength region with no ozone absorption and where Rayleigh extinction is low. The progressive interruption of the red rise, and the blue decrease, both coincide with the wavelength region where ozone absorption operates. At larger wavelengths, Rayleigh extinction by nitrogen () will relay ozone absorption.
If atmospheric extinction is the explanation of the red bump, the true meaning would be that atmospheric extinction does not act in the same way for the nebular light as it does for point sources’ light, for HD44179 or HD44113 for instance. More generally it implies that extended objects are not extinguished by the atmosphere in the same way as point sources are, atmospheric extinction being far more efficient on the former. This can only be related to turbulence, and to the structure of the atmosphere, already responsible for such phenomena as scintillation, which affects starlight and not the light from planets.
This hypothesis is further supported by the observations presented in Zagury (2005). Faint and extended galaxies observed with FAST (see the FAST database at: http://tdc-www.harvard.edu/archive/), as UGC11917, also show a strong decrease from the ozone absorption region onwards, and their blue shape is close to that of the night sky. Except for the three nebulae used in Zagury (2005), I didn’t have access to the 2-D spectra of the Kwitter-Henry database, but anyone who considers the continua of the Kwitter-Henry spectra will observe that they can be classified, according to their shape, into one of very few categories (I found 4 well defined categories, and this classification can probably be simplified). Many of these spectra have the same marked feature in the red as the Red Rectangle has, while others have a star-like spectrum. One can surmise that this classification results from the relative proportion, in the spectra, of light from the central star refracted by the atmosphere, scattered light from the central star in the atmosphere, night sky, and nebular light in the red.
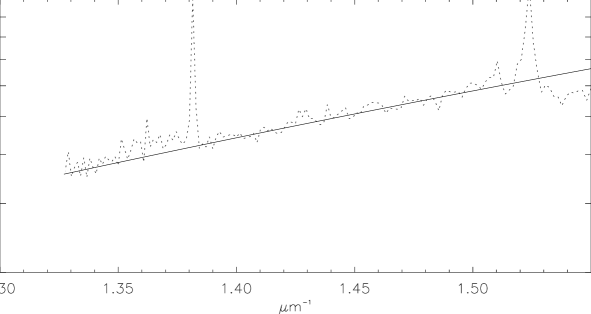
The only part of the Red Rectangle nebula spectrum which is reliable, because of the small effect of atmospheric extinction in this wavelength region, is the red part, under (above ), before ozone absorption modifies the spectrum. To investigate the nature of this part of the spectrum, we need to study its power law dependence when divided by the spectrum of an A0 star (same spectral type as HD44179, TK ), as HD44113. Figure 25 shows that the red rise of the nebula spectrum has a dependence, which indicates Rayleigh scattering by the gas. This would be in conformity with the conditions which prevail for these observations, i.e. a scattering medium close to the source of light, and large angles of scattering.
The conclusions finally adopted here [that atmospheric extinction is more effective on extended objects than it is on point sources, and that the true spectrum of the Red Rectangle nebula reflects scattering by the gas (hydrogen)] can easily be checked by observing the Red Rectangle nebula, and a non-reddened star of A0 type, as HD44113, from space, on a large wavelength range. In the absence of atmospheric extinction, we expect the ratio of the spectra to vary as over all the visible and UV wavelength range. It would also be desirable to observe different positions in the nebula, close to, and far from, HD44179, to determine the variations of the intensity of the scattering, and to see if, close to the star, scattering by large grains, with a dependence, is detected.
8 Conclusion
The observations of the Red Rectangle nebula presented in this paper outline the importance of atmospheric extinction on the re-distribution of starlight in the vicinity (’) of a star. The spectra of the nebula all appeared to be the superimposition of two components, one in the red, clearly associated with the nebula, one in the blue, which is mainly either direct light from HD44179 refracted by the atmosphere, or light from HD44179 forward scattered by atmospheric aerosols (the proportion of direct and scattered lights depends on the distance from HD44179, and on the degree of atmospheric extinction).
In none of the spectra, observed at different places of the nebula, and at different dates, was it possible to detect the spectrum of the nebula in the blue, which means that either there is no (or a negligible) nebular continuum in the blue, or, that atmospheric extinction strongly extinguishes the nebular light from the ozone absorption region on, towards the UV.
The correlation between the decrease (the blue side of the red bump) of the light from the nebula and the ozone absorption region, and the variations of the spectra at one position from one date to another, naturally favor the second hypothesis. It will then be inferred that faint extended objects are more sensitive to atmospheric extinction than point sources are. Hints to the same conclusion can be found in the spectra of the Kwitter-Henry database, and of faint extended galaxies observed with FAST.
This is the first and main conclusion of this paper. It implies that it is not possible to obtain a reliable spectrum of faint extended objects, in the visible and in ground-based observations, by the usual way of normalizing the spectrum by the spectrum of a reference star.
These considerations give an alternative solution to the Red Rectangle problem, and more generally to the red bump found in the spectrum of some nebulae. To explain the bump, last thirty years of research have focused on the existence of particles which would absorb UV light and fluoresce in the red (Section A). Such particles, which should be abundant enough to account for some of the scattered red light in the galaxy (Szomoru & Guhathakurta 1998), with an intrinsic photon conversion efficiency of the photoluminescence near 100 (Zubko, Smith & Witt 1999; Van Winckel, Cohen & Gull 2002), would indeed represent a remarkable discovery, and it is a puzzling question to understand how particles we are not able to synthetize on earth, can be so abundant in the cold and nearly empty interstellar medium. However, none of the attempts to identify these particles has given a satisfactory result yet, their existence being as speculative today as it was thirty years ago (Van Winckel, Cohen & Gull 2002).
That atmospheric extinction be responsible for the red bump would certainly lead to a review of the problem on a more simple and pragmatic basis. It will also explain the similarity outlined by Zagury & Fujii (2003) between the spectrum of a red horizon at sunrise and the spectra of red nebulae. Both spectra result from a combination of Rayleigh scattering by a gas (nitrogen for the red horizon, hydrogen for the nebula), and of atmospheric extinction (Rayleigh extinction and ozone absorption). This is the second conclusion of the paper.
One way to verify these two conclusions would be to obtain broad-band spectra of extended objects from space, with the Hubble Space Telescope for instance. Concerning the Red Rectangle, I expect the ratio of spectra of the nebula and of a non-reddened A0 star, as HD44113, to give a dependence over the complete visible spectrum. To observe Rayleigh scattering by the gas, observed positions in the nebula should be taken far enough from HD44179. Close to HD44179 it is possible that forward scattering by large grains will be more efficient than scattering by the gas, and that a dependence be found. These observations will evidence, for the first time, Rayleigh scattering by the gas in the interstellar medium.
A refined study of the spectra from the Kwiter-Henry database, at the early stage of data reduction where atmospheric extinction is not yet corrected, could also provide valuable information on the relationship between the conditions of observation and the shape of the spectra. As already mentioned in Zagury (2005), there is little doubt that the proximity of the central star, the balance between the proportions of light from the central star refracted or scattered in the atmosphere, and from the night sky, have a determining influence on the final shape of the spectra in the blue. For nebulae with a reliable spectrum in the red (where atmospheric extinction is low), the ratio of scattered light from the nebula to the spectrum of an unreddened star of same spectral type as the central star, should also provide informations on the type of particles which scatter starlight (large grains with a dependence, hydrogen for Rayleigh scattering by the gas), and thus on the geometrical relationship (proximity, angles of scattering) between the nebula and the star.
A difference in the effect of atmospheric extinction on point sources and on extended objects can only be due to the time-dependent structure turbulence introduces in the atmosphere. The consequences for our understanding of the atmosphere, like the relations which exist between the spectra at very short angular distances from a star, would merit further attention and investigations.
Appendix A The Red Rectangle
The large interest (Simbad quotes some 320 references to the Red Rectangle) raised in the thirty past years by the Red Rectangle takes its origin in the Cohen et al. (1975) article, ‘The peculiar object HD44179 (”The Red Rectangle”)’. In conclusion of their paper, the authors address several problems which concern the star system at the center of the nebula, the nature of the bi-conical nebula, and the reason(s) for its important brightness in the red.
Large advances in the comprehension of the inner part of the nebula have been made in the 1990’s, from high resolution imaging, with Roddier et al. (1995) who showed that we do not see direct starlight from HD44179, only scattered light escaping from the poles of an optically thick disc, seen edge-on. The disc, more likely a torus (Tuthill et al. 2002), surrounds a spectroscopic binary with an orbital period of 300 days (Van Winckel, Walkens & Waters 1995). The optical light escaping the torus is that of an A0 star, with effective temperature K (Waelkens et al. 1996). A schematical representation of this inner system ( mas around HD44179) can be seen in Figure 3 of Waelkens et al. (1996) or Figure 8 of Men’shchikov et al. (1998). Recent high resolution images (Tuthill et al. 2002; Cohen et al. 2004) of this inner part of the nebula seem to confirm this representation.
On a larger scale the nebula is biconical, and occupies on the sky. The question of its red color, addressed by Cohen et al. (1975), is still a subject of debate. The quite logical proposal by Cohen et al. (1975), that it could be light from the central A0 star extinguished (by small and large grains) and scattered by the gas (because of the large angles of scattering), did not attract much attention (except for two papers, Greenstein & Oke 1977; Perkins et al. 1981), on-going research being oriented towards the search of particles which would absorb in the UV and luminesce in the red (Duley 1985; d’Hendecourt et al. 1986; Seahra & Duley 1999). However, the existence of these particles is still in the speculative domain (Li & Draine 2002; Van Winckel, Cohen & Gull 2002).
Acknowledgments
This work was made possible thanks to the courtesy of Roc Cutri, and John Huchra. It is most of all indebted to Lucas Macri, for his unfailing kindness in repeating the observations of the Red Rectangle.
References
- [1] Cohen M., et al., 1975, ApJ, 196, 179
- [2] Cohen M., Van Winckel H., Bond H.E., Gull T.R., 2004, Astron.J., 127, 2362
- [3] Duley W.W., 1985, MNRAS, 215, 259
- [4] Fabricant D., et al., 1998, PASP, 110, 79
- [5] Greenstein J.L., Oke J.B., 1977, PASP, 89, 131
- [6] d’Hendecourt L.B., Léger A., Olofsson G., Schmidt W., 1986, A&A, 170, 91
- [7] Li A., Draine B.T., 2002, ApJ, 564, 803
- [8] Massey P., Foltz C.B., 2000, PASP, 112, 566
- [9] Men’shchikov A.B., Balega Y.Y., Osterbart R., Weigelt G., 1998, NewA., 3, 601
- [10] Perkins H.G., Scarrott S.M., Murdin P., Bingham R.G., 1981, MNRAS, 196, 635
- [11] Lord Rayleigh, 1871, Phil. Mag. XLI, 274, 107
- [12] Roddier F., Roddier C., Graves J.E., Northcott M.J., 1995, ApJ, 443, 249
- [13] Seahra S.S., Duley W.W., 1999, ApJ, 520, 719
- [14] Szomoru A., Guhathakurta P., 1998, ApJ, 494, L93
- [15] Tokarz S. P., Roll J., 1997, A.S.P. Conference Series, Vol. 125, 1997, Gareth Hunt and H. E. Payne, eds., p. 140.
- [16] Tuthill P., et al., 2002, A&A, 389, 889
- [17] Van Winckel H., Walkens C., Waters L.B.F.M., 1995, A&A, 293, L25
- [18] Van Winckel H., Cohen M., Gull T.R., 2002, A&A, 390, L47
- [19] Walkens C., Van Winckel H., Waters L.B.F.M., Bakker E.J., 1996, A&A, 314, L17
- [20] Zagury, F., 2006, ‘Spectral analysis of the background in ground-based, long-slit spectroscopy’, in press
- [21] Zagury F., Fuji M., 2003, NewA, 8, 549
- [22] Zubko V.G., Smith T.L., Witt A.N., 1999, ApJ, 511, L57
|
||||||||||||||||||||||||||||||||||||||||||||||||||||||||||||||||||||||||||||||||||||||||||||||||||||||||||||||||||||||||||||||||||||||
-
UT HH:MM:SS at start of exposure.
-
Duration of exposure (seconds).
-
Elevation offset from HD44179.
-
Air mass.
-
Altitude (∘) of the object at time of observation.