Mid-infrared properties of X-ray sources in the Extended Groth Strip
Abstract
Mid-infrared observations of Active Galactic Nuclei (AGN) are important for understanding of the physical conditions around the central accretion engines. Chandra and XMM-Newton X–ray observations of a 300 arcmin region in the Extended Groth Strip are used to select a sample of AGN. The Spitzer instruments IRAC and MIPS detect 68–80% of these sources, which show a wide range of mid-infrared properties. About 40% of the sources have red power-law spectral energy distributions (, ) in the m IRAC bands. In these sources the central engine dominates the emission at both X–ray and IR wavelengths. Another 40% of the sources have blue mid-IR spectral energy distributions () with their infrared emission dominated by the host galaxy; the remaining 20% are not well-fit by a power law. Published IRAC color criteria for AGN select most of the red sources, but only some of the blue sources. As with all other known methods, selecting AGN with mid-IR colors will not produce a sample that is simultaneously complete and reliable. The IRAC SED type does not directly correspond to X–ray spectral type (hard/soft). The mid-IR properties of X–ray-detected Lyman-break, radio, submillimeter, and optically-faint sources vary widely and, for the most part, are not distinct from those of the general X–ray/infrared source population. X–ray sources emit 6–11% of the integrated mid–IR light, making them significant contributors to the cosmic infrared background.
1 Introduction
Understanding the nature of active galactic nuclei (AGN) and the galaxies that host them is important for such diverse goals as pinpointing the sources of the cosmic X–ray and infrared backgrounds and deriving the star formation history of the universe. Multi-wavelength surveys are particularly important for the study of AGN because their appearance in different wavelength regimes can be quite different. Selecting AGN at one particular wavelength is no guarantee of a complete sample. X–ray selection has the advantages of being reasonably efficient and reliable (Mushotzky, 2004) but may miss some obscured sources (Peterson et al., 2005). Infrared and radio observations can identify AGN missed in the X–ray (Donley et al., 2005; Alonso-Herrero et al., 2006) and, for X–ray-selected AGN, can help to distinguish between the different AGN types. Infrared data are also needed to constrain the fraction of the cosmic infrared background (CIRB) emitted by AGN.
The limited spatial resolution of previous generations of X–ray and infrared observatories made cross-identification between wavelengths difficult. Recent work has benefited from the much smaller point spread functions of the Chandra X–ray Observatory, XMM-Newton, the Infrared Space Observatory (ISO), and the Spitzer Space Telescope. Fadda et al. (2002) combined Chandra, XMM, and ISO data from the Lockman Hole and Hubble Deep Field North to conclude that AGN contribute % of the CIRB at 15 m. Work with Spitzer data to date has concentrated on the properties of the X–ray source population. Rigby et al. (2004) studied Chandra Deep Field South sources detected at hard X–ray and 24 m wavelengths and found, surprisingly, that X–ray-hard AGN are not infrared-brighter (as would be expected if they were embedded in the obscuring matter). Alonso-Herrero et al. (2004) found that similarly-selected Lockman Hole sources exhibit a variety of optical/IR spectral types. About half of their sources had spectral energy distributions (SEDs) dominated by stellar emission or showed significant obscuration. Franceschini et al. (2005) found a similar mix of spectral types among ELAIS-N1 Chandra/Spitzer sources and concluded that about 10–15% of 24 m sources are dominated by an AGN.
This paper combines Spitzer, Chandra, and XMM observations to understand the mid-infrared properties of the X–ray sources in the ‘Extended Groth Strip’ (EGS). The X–ray and infrared observations in this region are intermediate in depth and area between GOODS (Dickinson et al., 2001) and the shallower NOAO Deep-Wide Field (Jannuzi & Dey, 1999; Eisenhardt et al., 2004) and SWIRE (Lonsdale et al., 2003) surveys. As such, the EGS provides a valuable probe of the properties of AGN at intermediate fluxes and an additional measure of the cosmic variance of those properties. The extensive multi-wavelength observational data available for the EGS, particularly its spectroscopic redshift survey, should eventually produce an extremely thorough characterization of the X–ray sources and allow comparisons and cross-identifications with other classes of galaxies. In this paper we focus on combining mid-IR and X–ray data to study the properties of AGN and their host galaxies. Identifications of X–ray sources in the Chandra deep fields (Hornschemeier et al., 2003; Barger et al., 2003) suggests that almost all of the EGS X–ray sources should be AGN. The EGS X–ray sources’ median redshift is expected to be with no strong dependence on X–ray flux (Barger et al., 2005).
2 Observational Data
The Extended Groth Strip (EGS) is a high ecliptic- and Galactic-latitude field which extends the original Hubble Space Telescope ‘Groth-Westphal strip’ (Groth et al., 1994) to a size of 2° 15′. The EGS is one of the target fields for the DEEP2 redshift survey (Davis et al., 2003), and has extensive optical and near-infrared ground-based imaging (Coil et al., 2004; Conselice et al., 2003). An approximately area in its southwest corner (the ‘14-hour field’) contains several optical redshift surveys (Lilly et al., 1995; Steidel et al., 2003), submillimeter (Eales et al., 2000; Webb et al., 2003) and ISO observations (Flores et al., 1999), a deep radio survey at 5 GHz (Fomalont et al., 1991), and X–ray observations with both XMM-Newton (Waskett et al., 2003; Miyaji et al., 2004), and Chandra (Nandra et al., 2005a). Observations of the full EGS at ultraviolet and radio wavelengths are in progress, as are additional Chandra observations which will eventually cover the entire EGS to a depth of 200 ks.
The Spitzer data used here were obtained as part of program 8, the “IRAC Deep Survey” with observing time contributed by Guaranteed Time Observers G. Fazio, G. Rieke, and E. Wright. The IRAC observations for this program were obtained at two epochs, 2003 December and 2004 June–July and cover a area to a depth of h per sky position. Observations with the MIPS instrument were begun in 2004 January but were not completed because of a spacecraft safing event. The full-depth MIPS observations, covering approximately the same area as the IRAC data to a depth of 1200 s per sky position at 24 m, were completed in 2004 June.111The analysis of a subset of the EGS X–ray sources presented by Alonso-Herrero et al. (2004) was based on only the 2004 January MIPS and 2003 December IRAC data. The IRAC and MIPS data reduction was similar to that described by Huang et al. (2004) and Egami et al. (2004). The limiting point-source flux densities of the data are (0.9, 0.9, 6.3, 5.8, 83) Jy [limiting AB magnitudes of 24.0, 24.0, 21.9, 22.0, 19.1] at (3.6, 4.5, 5.8, 8.0, 24) m.222 Unless stated otherwise, all IRAC magnitudes and colors as well as IRAC-MIPS colors in this paper are on the AB system. signifies a magnitude in the m band. The 24 m source identification is 80% complete at the 83 Jy limit (about a factor of 1.5 above the confusion limit), while the completeness of the 3.6 and 4.5 m data are substantially affected by source confusion at faint flux densities (Fazio et al., 2004). For comparison to the X–ray sources, we generated two catalogs from the full-area EGS data. The IRAC-only comparison sample is selected at 8 m and contains sources, with the area overlapping the X-ray surveys containing about 4400 8 m sources. The IRAC/MIPS comparison sample includes all sources detected at 24 m and in the IRAC bands and contains sources in the area.
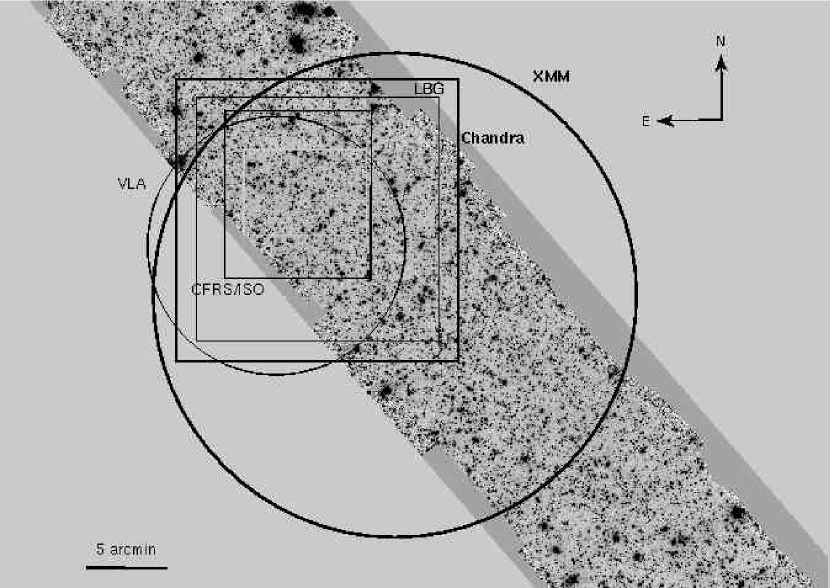
The details of the X-ray observations and source lists used here are described elsewhere (Waskett et al., 2003; Nandra et al., 2005a). Briefly, the XMM-Newton data consist of a 56 ks exposure obtained in 2000 July (ObsID 127921001, PI: Griffiths), centered on the position 0, 0 (J2000). The catalog produced by Waskett et al. (2003) contains 154 sources detected in either/both of the soft (0.5–2 keV) or hard (2–10 keV) bands, with a limiting 0.5–10 keV flux of erg cm s. The expected number of spurious sources is . The Chandra data consist of 200 ks of observations with ACIS-I obtained in 2002 August (ObsIDs 3305, 4357, 4365, PI: Nandra), centered on position 6, (J2000). The catalog produced by Nandra et al. (2005a) contains 158 sources detected in the full (0.5–7 keV) and/or soft (0.5–2 keV) X–ray bands; the expected number of spurious sources is 1.8. The limiting full-band flux, converted to the standard 0.5–10 keV band, is erg cm s. The fields observed by the two X–ray instruments partially overlap and extend outside the region observed by Spitzer; the area in common between the Spitzer and Chandra surveys is about 186 arcmin, with the XMM-only/Spitzer area adding another 114 arcmin. Figure 1 shows the geometry of the various surveys.
We combined the two X–ray catalogs to produce a final list of X–ray sources. Sources from the Chandra and XMM catalogs were matched using the X-ray positions given by Nandra et al. (2005a) and the optical counterpart positions given by Waskett et al. (2003) (these should be more precise than the XMM X–ray positions). The matching radius between the two catalogs was 5″; we expect few false matches because the source density is low. A total of 152 X–ray sources are within the boundaries of the Spitzer observations: 39 XMM-only sources (6 within the XMM-Chandra overlap area), 72 Chandra-only sources (all within the overlap area), and 42 sources in common between the two X–ray lists. (The large number of Chandra-only sources within the overlap area is presumably due to the much fainter flux limit of the Chandra observations.) For the sources detected by both Chandra and XMM, our subsequent analysis uses the X–ray positions and fluxes given by Nandra et al. (2005a). To allow direct comparison between Chandra and XMM sources, we computed hardness ratios from the tabulated fluxes333Hardness ratios are defined as HR= where and are the fluxes in the 2–10 keV hard band and the 0.5–2 keV soft band, respectively. rather than from image counts as is often done.
Most of the effort to date in classifying X–ray sources has involved optical identifications and spectroscopy. Although the focus of this work is the X–ray sources’ mid-infrared properties, we use deep -band images taken with the Suprime camera (Miyazaki et al., 2002) on the Subaru telescope for comparison with other work and to identify any optically-faint, infrared-bright sources. The four 36′′ images cover the EGS completely to a depth of with seeing FWHM 06–08. The optical counterparts of the Chandra sources are discussed in detail elsewhere (Georgakakis et al., 2005). The optical counterparts of the XMM sources within the original HST/WFPC2 ‘Groth Strip’ are discussed by Miyaji et al. (2004).
2.1 Cross-matching and Photometry
With the X–ray catalog positions as the input to the IRAF/APPHOT center and phot routines, we searched for 3.6 m sources within a 25 radius. Only a handful of X–ray sources had multiple sources within the search radius, and we do not consider these as secure detections. Of the 152 X–ray sources, 138 (91%) have secure IRAC detections; all are detected in all four IRAC bands. Detection of MIPS counterparts was performed by searching for the nearest detectable source within 3″. All of the 104 X–ray sources (68% of the total) detected by MIPS at 24 m are also detected by IRAC. Because the IRAC 3.6 m images are crowded, some false X–ray/infrared matches are to be expected. To quantify this effect, we shuffled the X-ray catalog to produce random coordinates within the X–ray/IR overlap region and re-performed the centering and photometry procedure. About 18% of the random “sources” were detected in the 3.6 m-band image; less than half of these (about 8% of the total) were detected in the less-crowded 8.0 m-band image. We conclude that the false-match probability is likely to be about 10%.
Detection of the optical counterparts was performed by using the IRAF apphot routine with the aperture centered on the IRAC position. Of the fourteen IRAC-unmatched sources X–ray sources, six are Chandra sources which do not appear to have optical counterparts, and seven are XMM-Newton sources for which an optical counterpart was not identified by Waskett et al. (2003). All but one of the XMM-Newton sources lacking IRAC counterparts have very faint optical point sources within 5″ of the X–ray position. Since the focus of this work is on the infrared properties we do not discuss these sources further. There are four Chandra sources that have IRAC and MIPS counterparts but lack optical counterparts; these sources are discussed further in Section 5. Figure 2 shows the X–ray to optical ratio for all of the IR-detected sources. As expected given the X–ray survey depth, most have , indicating that they are likely to be AGN and not normal galaxies.
IRAC photometry was performed using the source positions determined from the 3.6 m image. We measured flux densities in 18-radius apertures and corrected to total magnitudes in the standard 122-radius calibration aperture using a ‘mosaic PSF’ for each channel derived from the IRAC images.444The corrections used were 0.55, 0.59, 0.73 and 0.84 magnitudes in the 4 IRAC bands. Photometry on the MIPS 24 m image was done using PSF-fitting, as described by Pérez-González et al. (2005). Photometry on the Subaru -band image was measured in 10-radius apertures, aperture-corrected to 20. Photometric uncertainties used for the aperture photometry are those returned by phot, with the IRAC uncertainties multiplied by two to account for correlated noise in the backgrounds. Table 1 gives the infrared properties of the detected X–ray sources. A handful of the X–ray sources are also matched with sources in the various other surveys which overlap the region. These are marked in Table 1 and discussed in Section 5.
3 Infrared properties of X-ray sources
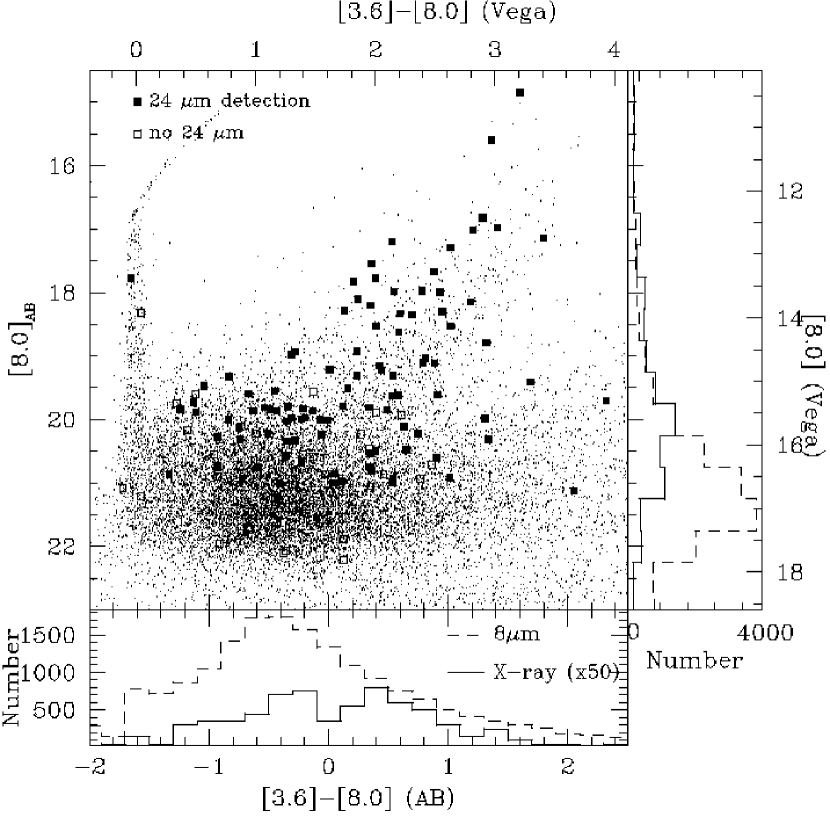
To understand how the mid-IR properties of X–ray and non-X–ray sources differ, we compare the properties of the X–ray sources to unbiased samples selected from the full EGS dataset. There are about 4400 8 m-selected sources in the X-ray survey area, so % of these are X–ray sources. In their optical/IRAC/MIPS identification of X–ray sources in the ELAIS-N1 region, Franceschini et al. (2005) found that % of 8 m sources were Chandra-detected, and that the fraction of X–ray detections decreased with decreasing IR flux. An IRAC color-magnitude diagram (Figure 3) shows a sequence of bright, blue sources with colors near , which corresponds to . These are the colors expected for stars; most of the X–ray and comparison sources are redder and consistent with galaxy colors (see also Figure 5c of Eisenhardt et al., 2004). Four X–ray sources (x42, x98, x113, and c152) lie on the blue sequence. x113 is also very blue in , while the other three sources are not detected at 24 m. Based on these data, we identify these four sources as Galactic stars and omit them from the following plots and analysis.555Miyaji et al. (2004) also identified x113 as a Galactic star. This contamination rate (4/138 = 3%) is comparable to that found by Franceschini et al. (2005).
Figure 3 shows that the X–ray sources have different color distributions from the comparison samples. The X–ray sources’ IRAC colors are redder than those of the 8 m sample in all six band combinations and their IRAC/MIPS colors () are bluer than those of the 24 m sample. KS tests show that all of these differences are statistically significant. The color differences are an indication that the X–ray-producing AGN affects the SED of the infrared counterpart, as expected. The X–ray sources are also about a magnitude brighter than the typical 8 m-selected IRAC source and about 0.3 magnitudes brighter than the typical 24 m source. For the X–ray sources, median AB magnitudes in the 4 IRAC bands are (19.85, 19.95, 20.04, 19.98), while the medians for the full EGS 8 m sample are (20.91, 21.03, 21.00, 21.14). The median X–ray source 24 m flux density is 182 Jy, compared to 146 Jy for the 24 m sample. While it would be interesting if the brighter infrared fluxes indicated that X–ray sources preferentially inhabit more massive galaxies, there is a more mundane explanation: the EGS infrared data are deeper than the X–ray data. We confirmed this by comparing to the Chandra Deep Field-South, where the much shallower (470 s) IRAC data at 3.6 (8.0) m still detects some 90% (60%) of the X–ray sources despite the much deeper X–ray limit in that field.
Mid-infrared SEDs of galaxies containing AGN are expected to be comprised of several components which can have different relative luminosities. In nearby galaxies, the IRAC bands contain the Rayleigh-Jeans tail of the stellar emission and may also include emission from the interstellar polycyclic aromatic hydrocarbon (PAH) features in the 8 m band and hot interstellar dust in the 5.8, and 8 m bands. At , the PAH features redshift out of the IRAC bands and at the ‘1.6 m bump’ from the H opacity minimum in old stars begins to redshift through the IRAC bands (Simpson & Eisenhardt, 1999). At the PAH features are redshifted into the MIPS 24 m band. AGN emission in the mid-IR is often phenomenologically described by a red power-law (; Elvis et al., 1994).666A power law SED does not necessarily imply a non-thermal origin for the emission. Fritz et al. (2005) show that dust emission from a range of dust types and distributions can produce the observed SEDs from a variety of AGN. The utility of mid-IR power-laws for selection of AGN is further discussed by Alonso-Herrero et al. (2006), who presented a study of 24 m sources with power-law () SEDs in the Chandra Deep Field South. Based on the galaxies’ optical-IR SEDs and X–ray and IR properties, they concluded that the majority (including those not detected in X–rays) harbor an AGN.
As a simple description of the EGS X–ray sources’ mid-IR SEDs, we attempted to fit a power law to their IRAC flux densities. We expected that AGN-dominated objects would have red power-laws with , while stellar-dominated galaxies would have blue SEDs with . PAH emission at 8 m or redshifted 1.6 m bump emission will result in poorer fits to a simple power law, as will comparable AGN and stellar contributions to the total IR luminosity. Using a simple method, we fit power laws to the IRAC flux densities of the individual sources in the X–ray and comparison samples. The distributions of power law indices are shown in Figure 4. Seventy-eight percent of the X–ray sources (104/134) had acceptable power-law fits (), with about half of these (53) having . (Typical uncertainties in for the successful fits are .) Thus only about 40% of the EGS X–ray sources show the classic red power-law SED in the mid-infrared. As might be expected, these sources are fainter than the blue-power-law sources at 3.6 and 4.5 m but not different at the longer IR wavelengths. The fraction of comparison sample sources with acceptable power-law fits is about 40% for both the 8- and 24- m-selected samples, and their median is much higher ( for 8 m sources and for 24 m sources), as expected from their bluer colors. About 7% of all 8 m sources and 9% of all 24 m source have good power-law fits with .
AGN and galaxy SEDs are known to be complex, and, as expected, power-law SEDs observed in the IRAC bands do not extrapolate well to the optical and 24 m bands. Extensions of the IRAC power-laws to the optical always over-predicted the -band magnitudes by large factors and, for the blue sources, under-predicted the 24 m fluxes by several magnitudes. In the red sources, the AGN dominates the IRAC bands, so the correlation might be expected to be better: however, the IRAC power-laws predict the 24 m values only to within about 60%.
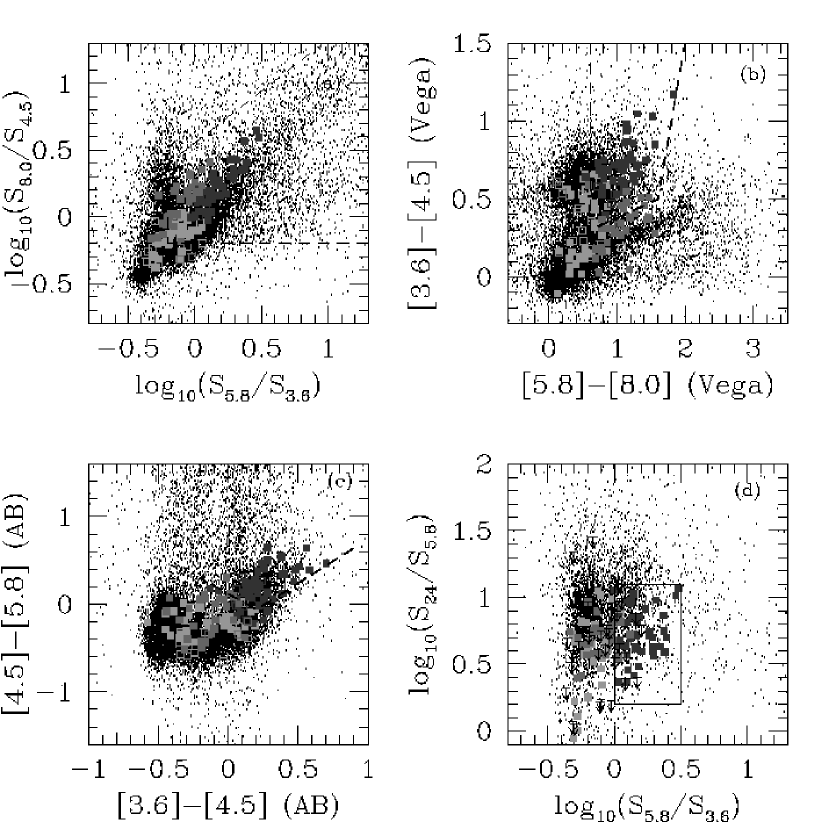
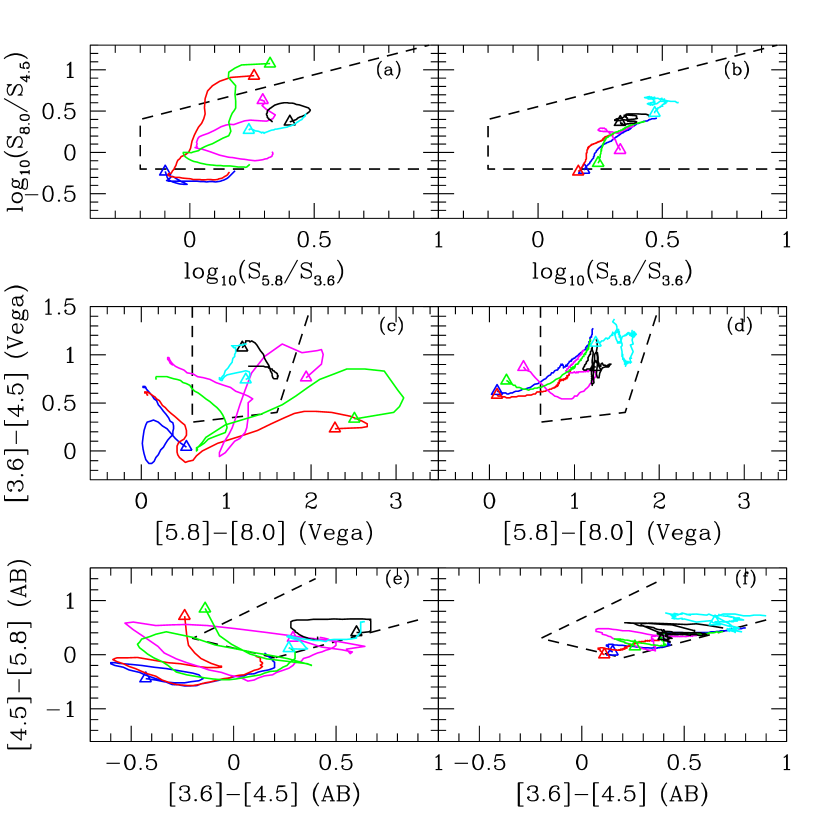
The wide range of spectral shapes exhibited by the EGS X–ray sources means that no proposed mid-infrared color AGN selection will identify all of them. Figure 5 compares the IRAC colors of the EGS X–ray sources to those of the EGS 8 m sample in several color-color spaces, where we have marked the regions of IRAC colors used by various authors to select AGN. The X–ray sources cover a wide range of colors in all of these plots; the X–ray sources not detected at 24 m tend to have bluer IRAC colors (although this effect is not statistically significant). Figure 6 shows the predicted colors of several galaxy and AGN templates which combine optical and near-infrared data from the hyperz package (Bolzonella et al., 2000) and mid-infrared data from Lu et al. (2003). The AGN templates have red colors and lie in the AGN selection regions at all redshifts; the starburst galaxy templates move into and out of the selection regions depending on ; and the normal galaxy templates are blue at low but move into the AGN regions at high redshifts. From this comparison we infer that the blue power-law sources are mostly low-redshift galaxies where the galaxy light dominates the mid-IR, while the red power-law sources are mostly dominated by AGN light but may also include a few starburst galaxies. As might be expected, the red power-law sources mostly satisfy the various AGN color criteria while the blue power-law and non-power-law sources mostly do not.
Important properties of any AGN selection criterion are its completeness (the fraction of all AGN selected) and reliability (the fraction of selected sources which are truly AGN). For example, Stern et al. (2005) used optical spectroscopy to determine that some 83% of the sources meeting their mid-IR criterion in the NOAO Deep-Wide Field/IRAC Shallow Survey region were (mostly broad-lined) AGN. Gorjian et al. (2005) matched an X–ray survey of the same region to the IRAC observations and showed that 67% of matched X–ray/IRAC sources met the Stern et al. (2005) criterion. Of course, we cannot directly assess the reliability of any color criteria for finding AGN (because we do not know how many non-X–ray-detected AGN might be in the survey area), but we can compute how reliably they select X–ray sources. The Stern et al. (2005) criterion seems to be both complete and reliable for shallow infrared and X–ray data, but it is important to test it against other criteria and deeper infrared and X–ray data.
Selecting X–ray sources using published IRAC color criteria does not yield complete samples. The published IRAC color criteria of Lacy et al. (2004), Stern et al. (2005), and Hatziminaoglou et al. (2005) select 98, 68, and 38 of the 134 EGS non-stellar X–ray sources, respectively, so their completeness is 73%, 51%, and 28%. The Hatziminaoglou et al. (2005) criterion specifically addressed the selection of type 1 AGN only, and this may be the cause of its lower completeness. Detection at 24 m only slightly increases the probability that a source will fulfill the IRAC color criteria.
Reliability is more difficult to assess. Of all the EGS sources in the survey area (not just the X–ray detections), the color criteria select 2015, 775, and 580 sources respectively, so their apparent reliabilities are 5%, 9%, and 7%. If all of the color-selected sources are truly AGN, X–ray undetected AGN would outnumber detected AGN by more than 10 to 1. This is not completely unreasonable, since we have shown above that our infrared data are deeper than the X–ray data. Also, Donley et al. (2005) recently found X-ray undetected radio-excess AGN in the Chandra Deep Field North, 60% of which are X–ray undetected even in Chandra exposures times deeper than the EGS data. Only about half of the Chandra Deep Field South AGN selected by the IR power-law criterion of Alonso-Herrero et al. (2004) are X–ray-detected.
How can we reconcile our results on color selection with the high reliability and completeness found by Stern et al. (2005) and Gorjian et al. (2005)? Our low reliabilities in finding X–ray sources are likely due in part to the EGS infrared data being deeper than the X–ray data as discussed above. The much greater depth of the EGS Spitzer data compared to the IRAC Shallow Survey data used by Stern et al. (2005) and Gorjian et al. (2005) also means that the two surveys probe different redshift regimes. As Figure 6 shows, AGN and normal galaxies have different IRAC colors at , but at higher redshifts both types of sources have colors meeting the AGN selection criteria. Also, Stern et al. (2005) may have found an artificially low contamination rate because they computed it only from sources with optical spectroscopy. Their optical spectroscopy is sensitive to galaxies mostly at , meaning that higher-redshift galaxies in the AGN selection area would not have been included in their sample. Assuming that local templates faithfully represent galaxy and AGN SEDs at high redshift, mid-infrared color selection of AGN will be more reliable for samples which do not contain large numbers of high-redshift galaxies. X–ray, optical, and infrared selection all have different contributions to make to AGN selection, but no method is both reliable and complete.
4 Infrared and X–ray properties
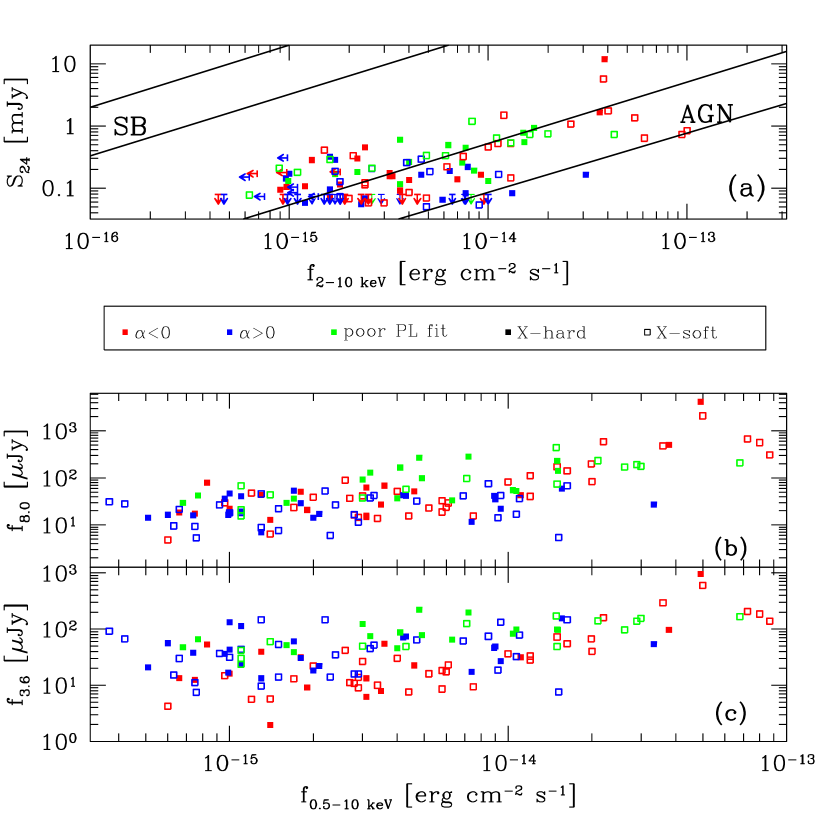
Comparison of X–ray and infrared fluxes is important for understanding the nature of X–ray sources. X–ray-to-infrared ratios, particularly , distinguish between AGN and starburst galaxies; the latter should be bright in the IR, but very faint in hard X–rays. Figure 7a compares and for the EGS sources: about two-thirds of the X–ray sources () have both hard X–ray and 24 m detections. The distribution of is consistent with AGN powering the X–ray sources’ emission at both wavelengths, as also found by Alonso-Herrero et al. (2004) and Franceschini et al. (2005). The two objects with mJy are c72 and x013, discussed in Section 5.2.
X–ray hardness ratios are often used to indicate AGN type, with harder spectra indicating more obscuration. We use to distinguish between X–ray-hard and soft sources; this is the equivalent of for a hardness ratio computed from Chandra counts as used by Szokoly et al. (2004) and Rigby et al. (2004).777We have not attempted to account for -corrections, which can be substantial for hardness ratios: see Figure 8 of Szokoly et al. (2004). The ratio of soft to hard sources in our sample is about 2:1. A simple picture of AGN classification predicts that X–ray-hard sources should have lower ratios (since the obscuring dust should increase the 24 m flux and absorb the hard X–rays; Awaki et al., 1991). To first order, this effect should not depend on redshift since flux ratios are distance-independent. Recent work (Lutz et al., 2004; Rigby et al., 2004) has found very little difference in between X–ray-hard and soft sources; in the EGS sample, we also find no statistically significant difference.
The effect of obscuring dust will vary in the IRAC bands: in the shorter wavelengths, absorption would decrease while at the longer wavelengths, dust emission could increase . We might therefore expect to be similar for obscured and unobscured sources at 3.6 m, and lower for obscured sources at 8 m. In fact, we find no difference in in the IRAC bands between X–ray-hard and soft sources. [ is higher for IR-red sources compared to blue sources, but this merely reflects the fact that red sources are fainter at 3.6 m (Section 3).] Comparing the full-band X–ray fluxes (rather than only the hard band) to the IRAC flux densities (Figures 7b and 7c), there is a statistically significant difference in between X–ray-hard and soft sources: the hard sources have lower at both 3.6 and 8.0 m. This is not quite consistent with the expectations given above, or with the results from 24 m, an indication that diagnostics such as likely oversimplify the complex physical processes responsible for IR and X–ray emission by galaxies and AGN.
Correlations between and arise partly because fluxes indirectly measure distance, but nevertheless indicate whether the emission at the two wavelengths is produced by the same mechanism. Since we have posited that the sources with red IRAC power laws are dominated by the AGN, we expect that they will show better correlation of (which is also AGN-dominated as shown earlier) with than the non-red power-law sources. Figures 7b and 7c show that, as expected, the correlations of with are poor for the blue power-law sources and stronger for the red sources and the full sample. The correlation strength increases slightly with IRAC band wavelength (a similar effect was found by Franceschini et al., 2005). Including the many IRAC-red power-law sources undetected in X–rays (also cf. Alonso-Herrero et al., 2006) in comparisons of and would worsen the correlation.
The IRAC power-law indices can be used to define two different object types: the red sources, dominated by the AGN light, and the blue sources, dominated by galaxy emission. The difference between AGN- and galaxy-domination of the SEDs could be due to differing amounts of AGN obscuration, a difference in the relative intrinsic luminosities of the two components, or some combination of these. If the blue sources are blue because obscuration causes absorption of the AGN’s IR light, we would expect them to have harder X–ray spectra and lower ratios. If the blue sources are IR-blue because their AGN are intrinsically IR-faint, then their X–ray hardness should be the same as the red sources’ and their should be the same or higher. Figures 7b and 7c show that the blue sources do have higher , but only at 3.6 m (where the red sources are fainter by definition).
A direct comparison of X–ray hardness and mid-IR power-law index (Figure 8) shows no correlation between hardness ratio and . X–ray soft sources with power-law SEDs are more likely to be red (the median for soft sources is and that for hard sources is ), but the distributions of soft and hard sources are not significantly different. The distributions of hardness ratios of the red and blue power-law sources and the sources with poor power-law fits are also not significantly different. Fitted column densities are available for about half the sample from Georgakakis et al. (2005), but using these instead of hardness ratios does not change these results. While there is a connection between X–ray hardness ratios and mid-infrared spectral indices, the latter do not appear to be particularly good indicators of AGN type. Rather, they measure the degree to which the mid-infrared is dominated by AGN emission and correlated with X–ray flux.
5 Properties of X–ray cross-identifications
Many of the EGS X–ray sources are detected at other wavelengths as part of other surveys. Figure 9 shows versions of Figures 3, 5b, and 5d where the different classes of sources, including Lyman-break sources (Steidel et al., 2003), radio sources (Fomalont et al., 1991), SCUBA sources (Eales et al., 2000; Webb et al., 2003), and high X–ray to optical ratio objects are explicitly marked. They clearly have a wide range of infrared properties, which we examine in more detail below. We caution that the lower spatial resolution of the Spitzer imaging compared to, e.g., optical data means that source confusion could be an issue when IR properties are derived.
5.1 Lyman-break sources
A catalog of Lyman-break sources (LBS) in the EGS is given by Steidel et al. (2003); it includes 253 objects in the area covered by the IRAC imaging. Most of the spectroscopically-identified sources are classified by Steidel et al. (2003) as galaxies, but there are also three (narrow-lined) ‘AGN’ and three ‘QSOs’ (broad-lined AGN). Huang et al. (2005) find that the LBS have a wide range of properties, with about 5% being ‘infrared-luminous’, dusty star-forming galaxies. The QSO/AGN-classified LBS are among the brightest in the IRAC bands, and tend to be bluer in both and , indicating that their infrared luminosities are not due to star formation. Nandra et al. (2005b) identified matches between EGS Lyman-break and X–ray sources and used these to estimate the evolution in the space density of moderate-luminosity AGN from to . Here we discuss the infrared properties of the five matches between sources listed in the Nandra et al. (2005a) and Steidel et al. (2003) catalogs.
The LBSs detected in the mid-infrared and X–rays include all three of the Steidel et al. (2003) QSOs (sources c82, c99, c113), one AGN (c104), and one galaxy (c128). The two remaining Steidel et al. (2003) Lyman-break AGN are not detected in X–rays or at 24 m and are also infrared-fainter than the X–ray sources, with . The five X–ray detected sources have X–ray fluxes ranging from erg cm s, with hardness ratios (except for c113 which is X–ray-faint and not detected in the hard X–ray band). Compared to other X–ray sources, and particularly to sources with similar X–ray fluxes, the LBSs are infrared-faint and red. All have red power-law SEDs. Source c113 is the IR-reddest X–ray source in the sample, with the steepest IRAC power-law (). Source c128, classified as a galaxy, has the bluest IRAC colors of the LBS but still has a red power-law (). All of the LBSs have IRAC colors consistent with those expected of a galaxy or AGN at high redshift. There are about two dozen other X–ray sources with similar X–ray fluxes and colors and some of these could also be high-redshift AGN. The infrared observations of the LBG/X-ray sources show that they have low amounts of both extinction and dust emission.
5.2 SCUBA and X–ray-bright sources
Two SCUBA sources (Webb et al., 2003) are definitively identified with X–ray sources: CUDSS 14.13 is X–ray source c72, and CUDSS 14.3 is X–ray source c111.888Two additional SCUBA sources are identified with infrared/X–ray sources by Ashby et al. (2005, submitted). We do not discuss them here because the Ashby et al. infrared/X–ray identifications differ from the optical IDs given by Webb et al. (2003), and are in fact the same as two of the Lyman-break sources (c113, c128) discussed in the previous section. These sources differ by about a factor of two in sub-millimeter flux but by almost a factor of 40 in X–ray flux. (c72 is among the brightest X–ray sources, with erg cm s.) Both are also radio sources (sources 15V23 and 15V24 in Fomalont et al., 1991). For comparison, we also discuss in this section source x013, which has comparable X–ray flux to c72 but unknown sub-mm flux.
The three sources c72, x013, and c111 provide an interesting set of contrasts. Figure 10 shows the three sources’ optical-to-radio spectral energy distributions. Although both are SCUBA sources, c72 and c111 have few other properties in common; c72 is much more similar to the non-SCUBA source x013. The latter two sources are both X–ray and infrared-bright — they are the two bright, red sources in the upper right of Figure 3 — and have much higher ratios of IR-to-X–ray flux density than the other EGS sources (see Section 4). Both have red IRAC power-law SEDs, and fall into the ‘AGN boxes’ in all of Figures 5a–5c. Their X–ray hardness ratios are not particularly extreme (0.49 for c72, 0.57 for x013; see Figure 8). While the mid-IR flux densities of c72 and x013 are quite similar, they differ in the band by more than 3 magnitudes. This could be due to different amounts of extinction or simply different redshifts (the -band samples the rest-UV for c72). By comparison, c111 is much fainter in both the infrared and X–rays ( erg cm s), undetected in the soft X–ray band, has a nearly flat SED in the IRAC bands () and a very red color. These properties suggest that c111 may have significant obscuration.
Source c72 has been the subject of several other studies. It was included in the Canada-France Redshift Survey as CFRS 14.1157 (spectroscopic redshift ; Hammer et al., 1995). Using this redshift and km s Mpc, the X–ray luminosity is erg s, making this source a ‘QSO’ as defined by Szokoly et al. (2004). Higdon et al. (2004) presented the mid-infrared spectrum of c72: the spectrum is essentially a power-law with (somewhat shallower than the IRAC index, ). The lack of PAH features in the spectrum led Higdon et al. (2004) to conclude that this source is AGN-dominated in mid-IR wavelengths. Their estimate of the total IR luminosity () would classify it as a hyper-luminous infrared galaxy. Waskett et al. (2003) concluded that the sub-millimeter flux of c72 was too large to be produced by the AGN and must be produced by star formation. Webb et al. (2003) state that HST imaging of c72 “shows an extended object (25) with multiple components separated by diffuse emission”.
Less is known about the other two sources discussed here. Webb et al. (2003) state that the optical counterpart of source c111 has “disturbed” HST morphology and estimate its redshift to be in the range . Source x013 is outside the region covered by most of the other surveys, including the Chandra field of view and the SCUBA map. Waskett et al. (2004) describe x013 as having a ‘stellar’ optical profile, but give an -band magnitude brighter than their optical image’s saturation limit; it is also near saturation on the Subaru image. Miyaji et al. (2004) also describe this source as having ‘pointlike’ optical morphology and state that its X–ray to optical ratio is consistent with that of an AGN.
These three sources present several puzzles. What can be producing the ‘extra’ mid-infrared flux compared to the X–rays in c72 and x013, particularly in the IRAC bands? Perhaps these sources show the ‘5 micron excess’ noted by Edelson & Malkan (1986) and attributed by McAlary & Rieke (1988) to hot dust. Another possible explanation is that perhaps the infrared and X–ray fluxes for these two sources are actually detections of multiple unresolved sources. One source could be an AGN, the true X–ray counterpart, while the other (a star-forming galaxy) provides the extra infrared flux. (The multiple optical components of c72 discussed by Webb et al. (2003) are only about 08 apart and would not be resolved in the Spitzer imaging: however, they would also not be resolved in the mid-IR spectroscopy, which showed few signs of star formation.) Why are c72 and c111, both sub-mm galaxies, so different in the IR and X–rays? The multiple-source hypothesis might account for part of the difference between c72 and c111 if the latter is truly a single source. The difference in IR and X–rays might simply be a result of different AGN properties, unrelated to the star formation probed by the sub-mm. Also, if the redshift estimate of Webb et al. (2003) is correct, c111 is at significantly higher redshift than c72; the well-known ‘negative -correction’ in the observed sub-mm could account for the similar sub-mm fluxes but much different IR and X–ray fluxes. To summarize, mid-IR and sub-mm-bright sources show a variety of X–ray properties.
5.3 Radio sources
The eleven X–ray- and IR-detected radio sources in the survey region have a wide range of properties. They include the two SCUBA sources discussed above, seven sources detected in the deep VLA survey by Fomalont et al. (1991) and one source (x005) outside the Fomalont et al. (1991) area but detected in the shallower VLA survey by Willner et al. (2006, in preparation). The radio sources can be divided into two groups by 8 m flux density: c72, x005, c61 and c77 have and red power-law SEDs. The other seven sources have and all but one have blue power-law SEDs (c111 has a nearly flat SED with ). These two groups are similar to those found by Willner et al. in their study of IRAC counterparts of VLA sources, although the majority of those sources did not have X–ray observations. The radio sources cover a wide range in X–ray flux: source c61 is the X–ray-brightest in the sample ( erg cm s), and source c106 is one of X–ray-faintest. The four 8 m-bright sources are also the brightest in X–rays, although the X–ray fluxes do not group as neatly as the 8 m flux densities. There is no clear distinction between the two radio source groups in X–ray hardness ratio, nor do the radio/X–ray sources as a whole appear to be preferentially harder or softer (or have a different distribution) than the typical X–ray source. By contrast, Georgakakis et al. (2003) found that radio sources in the Phoenix Deep Survey were more X–ray obscured: their survey had almost five times as many objects so perhaps small numbers are biasing our results. The radio-detected X–ray sources do not clearly differ in their infrared or X–ray properties from the non-radio-detected sources.
The radio sources also have a wide range in radio properties, with 5 GHz flux densities varying by a factor of about 1000 for the Fomalont et al. (1991) sources. (Source x005 is much radio-brighter, with mJy, and is also bright in the IR.) The radio flux densities are not correlated with either the IRAC or X–ray fluxes or colors/hardness ratios, and the two groups seen in 8 m and X–ray brightness are not reflected in the radio flux densities or spectral indices. Radio and 24 m flux densities are known to correlate for star-forming galaxies and radio-faint AGN: Donley et al. (2005) used this to select a sample of ‘radio-excess AGN’, many of which were undetected in X–rays. Four EGS sources (c55, c83, c103, and c106) have radio-to-infrared ratios which would qualify them as radio-excess AGN. All four of these sources are X–ray and 8 m-faint; c55 and c83 are radio-bright while c103 and c106 are 24 m-faint. Without redshift information, we cannot constrain their radio luminosities, but if similar to the Donley et al. (2005) sources, these sources are ‘radio-intermediate’: that is, normal radio galaxies rather than blazar-like. The X–ray and radio-to-infrared ratios of the seven non-radio-excess sources are consistent with X–ray emission being produced by the AGN and radio emission produced by star formation (Bauer et al., 2002). X–ray/radio detected AGN show a wide range of mid-IR properties.
5.4 High X–ray-to-optical ratio sources
X–ray-to-optical flux ratios (X/Os) have been known for some time to be useful indicators of the nature of X–ray sources (e.g. Maccacaro et al., 1988). The nature of sources with high X/Os cannot be easily explored with optical spectroscopy since they are often too faint; such sources are thought to be candidates for high-redshift, heavily obscured AGN (Mainieri et al., 2005; Rigby et al., 2005). Figure 2 shows the X–ray to optical ratio for all of the IR-detected sources: 22 sources have , including several VLA sources and the SCUBA source c72. The X–ray and optical properties of these sources will be examined elsewhere; here we examine whether the high X–ray to optical ratio affects their infrared properties. Figure 9 shows that these sources are not completely distinct from the bulk of the IR-detected X–ray sources. However, KS tests show them to be (statistically significantly) fainter and redder than the lower-X/O sources. It follows that the high-X–ray to optical ratio sources should have more negative power-law slopes, and they do: the median is for these sources, compared to for the low-X–ray to optical ratio sources. Rigby et al. (2005) studied a comparably-sized sample of optically-faint X–ray sources in the Chandra Deep Field South and found similar mid-IR properties.
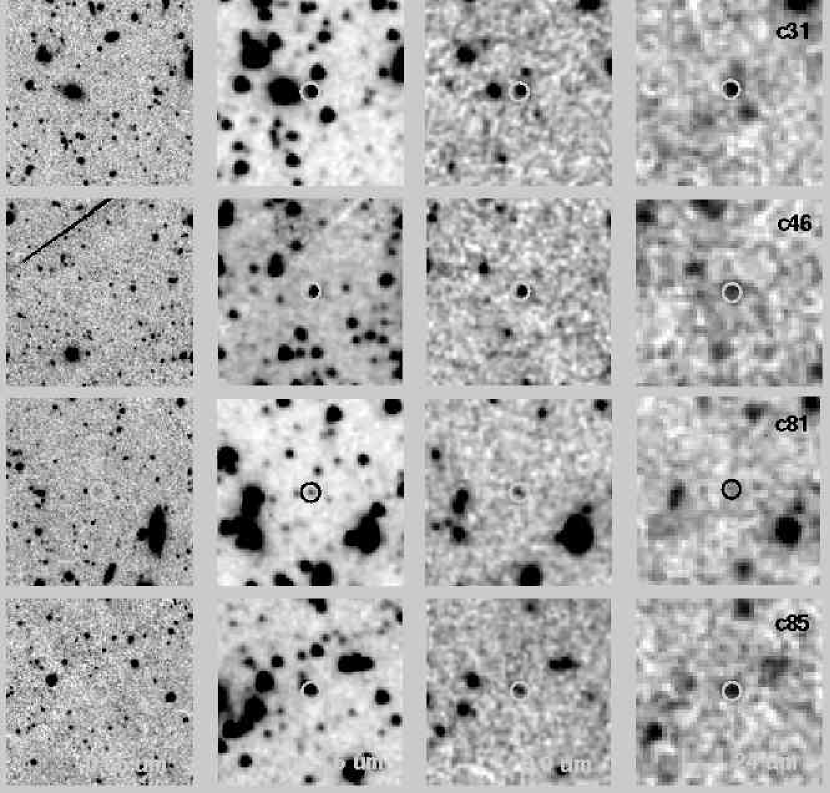
Is there anything special about the four IR-detected X–ray sources with no optical counterparts? These sources are X–ray faint, with erg cm s, but should still be reasonably robust X–ray detections ( full-band net counts). Source c31 is not detected in the hard X-ray band and the hardness ratios of the remaining three sources are about , not atypical. Infrared images of these four sources are shown in Figure 11: all are detected at 24 m, although only weakly in the case of source c81. The optically-undetected sources are again fainter and redder in the mid-IR than the typical X–ray source. Source c81 in particular is 3.5 mag fainter at 3.6 m than the median EGS X–ray source, and accordingly has one of the steepest mid-IR spectral slopes of any of the X–ray sources (). All four optically-undetected sources have red power-law IRAC SEDs. Although their colors make them ‘Extremely Red Objects’ by the definition of Wilson et al. (2004), such objects are not unusual. About a third of the X–ray sources and % of 8 m sources (in a shallower IRAC survey) are also EROs (Wilson et al., 2004). Our optically-undetected sources are not directly comparable to the ‘Extreme X–ray/Optical sources’ found by Koekemoer et al. (2004), since Koekemoer et al.’s EXOs are undetected even in the HST band, () while we do not have observations at the longest optical wavelengths. The EGS optically-undetected sources appear to be merely extreme examples of the other high-X–ray to optical ratio sources and do not require very high redshifts or reddening to explain their IRAC colors (see also Rigby et al., 2005).
6 X–ray Sources and the Cosmic Infrared Background
The fraction of the cosmic IR background originating from AGN is an important parameter in predicting its overall spectrum. The recent modeling of Silva et al. (2004) predicts that AGN emission by itself contributes little (%) to the CIRB, but the combined emission from AGN and their host galaxies is more significant (10–20%) in the mid-IR. Their predictions include the contribution of Compton-thick AGN, which are weak X–ray sources at energies keV but are predicted to make a substantial contribution to the IR and keV X–ray backgrounds. The integrated light from X–ray source counterparts (provided that most are AGN, which we have shown above to be the case for the EGS sources) should therefore provide a lower bound to the true CIRB contribution of AGN. Since the Spitzer data do not have the spatial resolution to directly separate AGN and galaxy emission, we compare the integrated light from the EGS X–ray sources to the ‘AGN+host’ predictions of Silva et al. (2004).
We computed the integrated mid-IR light from the Chandra sources alone in order to have a more uniform X–ray flux limit; the solid angle covered by the intersection of the Chandra and Spitzer images is 1.6 sr. The integrated fluxes from the EGS Chandra/Spitzer sources are 0.31, 0.26, 0.21, 0.21 and 0.21 nW m sr at 3.6, 4.5, 5.8, 8.0, and 24 m, with uncertainties of at least 5% due to the aperture correction, absolute flux calibration, and solid angle. Figure 12 shows the CIRB predictions of Silva et al. (2004) compared with our summation of the IR light from the EGS X–ray sources. We also compare the model predictions to estimates of the integrated galaxy light: derived by integrating galaxy number counts to limits comparable to the EGS data (2–4 Jy) in the IRAC bands (Fazio et al., 2004) and 60 Jy at 24 m (Papovich et al., 2004). The EGS integrated AGNhost fluxes are about half of the Silva et al. (2004) predictions, consistent with the notion that these data provide a lower limit to the true AGN CIRB contribution. The good agreement (within 10%) of the EGS observations with predicted values for Compton-thin AGNhosts suggests, but does not conclusively prove, that many of the non-X–ray-detected AGN are Compton-thick. The agreement between model and observations for the integrated galaxy light is much poorer; in particular the Silva et al. (2004) model under-predicts the CIRB at 5.8 and 8.0 m and may over-predict it at 24 m.
What is the fractional contribution of AGN to the CIRB? The Silva et al. (2004) models predict this to be 7–31% in the mid-infrared bands with the highest value at 8.0 m and the lowest at 24 m. Dividing the integrated light of the X–ray sources by that of the galaxy population, we find that the fraction of integrated light from X–ray sources is 6–8% in the IRAC bands and 11% at 24 m; there is no strong change with wavelength. The measured fraction is about half of the prediction at 3.6 and 4.5 m, about a third at 5.8 and 8.0 m (possibly because of the CIRB under-prediction noted above), and about 1.5 times the prediction at 24 m (possibly a fortuitous coincidence, since the models over-predict the total 24 m CIRB).
Our results do not agree with that of Huang et al. (2004), who found the fraction of integrated IRAC light from XMM sources in the Lockman Hole to increase from 4% at 3.6 m to 14% at 8 m. While those results are based on observations of comparable depth to those in the EGS, the area covered is small (22 arcmin) and contains only nine X–ray sources, so we do not consider the disagreement worrisome. Franceschini et al. (2005) did not give the integrated flux from their ELAIS-N1 sources in the IRAC bands. To their limiting 24 m flux of 200 Jy, Franceschini et al. (2005) find that the X–ray sources produce % of the 24 m light, which they find to be consistent with the % at 15 m found by Fadda et al. (2002) and is also consistent with our results. Brand et al. (2005) find a similar 10% fraction to a 24 m limit of 300 Jy. Although Brand et al. (2005) find that the fraction of IR light contributed by AGN decreases as the IR flux limit decreases, and this makes sense given that AGN should increase the IR flux of a galaxy, there does not seem to be a strong evolution in this fraction over the 80–300 Jy range in . A larger sample of X–ray sources, which will be available from the Chandra observations of the full-length EGS, will enable a better determination of the change in AGN fraction with IR flux limit.
AGN and their hosts make a disproportionate contribution to the CIRB in the IRAC bands, since they make up % of galaxies in the sample but contribute 6–8% of the integrated light. At 24 m, the AGN host galaxies are about 10% of the total number and contribute around 10% of the integrated light. The wavelength-independence of the integrated light fraction suggests that X–ray surveys select sources typical of the CIRB contributors regardless of the source of infrared emission. This is paradoxical given the clear differences between the SEDs of X–ray and non-X–ray sources, but differences in the redshift distributions of the two groups might explain the puzzle. Further work on the CIRB contributions of AGN would be greatly aided by some method of detecting Compton-thick AGN among the infrared sources; confirming that X–ray-undetected IR power-law galaxies are AGN is one possible step forward.
7 Discussion and Summary
Of about 150 X–ray sources within the Extended Groth Strip, more than 90% have IRAC counterparts at flux densities Jy, and about two-thirds are detected with MIPS at flux densities Jy. At the flux limits of the X–ray surveys, most of the sources are expected to be AGN. The ratios of X–ray to optical and IR flux are consistent with this expectation.
The infrared SEDs of the X–ray sources show a broad range of properties but reasonable agreement with predicted colors from nearby template objects. About 40% of the X–ray sources have a red power-law SED dominated by the AGN. The remaining 60% of the sources have either blue or non-power-law IRAC SEDs, indicating domination by galaxy light, PAH emission, or a mixture of galaxy and AGN light. Franceschini et al. (2005) found that 39% of Chandra sources in the ELAIS-N1 region had optical/infrared SEDs classified as ‘QSO’ or ‘Seyfert 1’; if most of our red sources are also ‘type 1’ (unobscured) AGN, then there is good agreement between the two studies. Published IRAC color-color criteria select the EGS X–ray sources with 5–9% reliability (these values would likely be higher with deeper X–ray observations) and 25–75% completeness.
There are good correlations between IR and X–ray fluxes for the red sources, indicating that the AGN dominates in both wavelength regimes. We find only marginal evidence (a difference in IR spectral index between hard and soft sources) for agreement between AGN classifications based on IR SEDs and X–ray hardness ratios even though the amount of obscuration should affect the observed properties in both. Variation in the gas-to-dust ratio and broad ranges of the intrinsic AGN properties could account for some of the lack of correspondence between IR and X–rays. Such an explanation is necessary not only for the properties of observed X–ray sources but to account for the many non-X–ray-detected sources that have similar IR properties.
The X–ray sources detected at other wavelengths show a wide range of properties. None are completely distinct from the main X–ray/IR sample, but most of the subsets are infrared-fainter and redder. The Lyman-break/X–ray sources are bright and blue when compared to other LBSs but faint and red (consistent with being at high redshift) compared to other X–ray sources. Two sub-millimeter sources are quite different in their X–ray properties, implying that the properties of the central AGN and of the intense star formation producing the sub-mm emission are not necessarily connected. One of the sub-mm sources and one additional X–ray source are ‘over-luminous’ in the mid-IR and we propose several possible explanations. The radio-detected X–ray sources divide into two groups based on their mid-IR and X–ray properties, but these groups do not relate to the radio emission. The optically faint sources (including 4 sources undetected in the optical) are again undistinguished in their mid-IR and X–ray properties.
The integrated infrared light from X–ray sources provides a lower bound to the fraction of the cosmic IR background originating from AGN. Our measurements of the integrated light from the Chandra sources are about half of the predicted AGNhost values from Silva et al. (2004): as expected, the X–ray observations do not detect all the AGN. The amount of integrated light from the EGS X–ray sources is in surprisingly good agreement with the Silva et al. predictions for Compton-thin AGN: this may be a coincidence (if the X–ray sources contain the right number of thick and thin AGN) or an indication that most non-X–ray-detected AGN are Compton-thick. Disagreements between the observed fractions of IR light from X–ray sources and the models at some wavelengths may be due to under- or over-predictions of the total CIRB.
Future work on this topic will benefit from the ongoing observations in the EGS region. Statistics will be improved by the larger, more uniform sample of X–ray sources soon to become available from the Chandra observations of the full 2°-long EGS. Spectroscopic redshift information from the DEEP2 survey will allow determination of luminosities and -corrections such that intrinsic properties can be computed. Cross-identification with observations at other wavelengths will allow comprehensive spectral energy distributions to be constructed. Such SEDs can be compared with population synthesis models to estimate galaxy stellar masses and star formation histories, which can in turn be compared to black hole masses computed from X–ray luminosities. The large sample of galaxies observed in the EGS no doubt contains many non-X–ray-selected AGN, and a better understanding of the X–ray-selected sources may be of tremendous help in finding these ‘dark’ AGN.
References
- Alonso-Herrero et al. (2004) Alonso-Herrero, A. et al. 2004, ApJS, 154, 155
- Alonso-Herrero et al. (2006) —. 2006, ApJ, in press (astro-ph/0511507)
- Awaki et al. (1991) Awaki, H., Koyama, K., Inoue, H., & Halpern, J. P. 1991, PASJ, 43, 195
- Barger et al. (2003) Barger, A. J., Cowie, L. L., Capak, P., Alexander, D. M., Bauer, F. E., Fernandez, E., Brandt, W. N., Garmire, G. P., & Hornschemeier, A. E. 2003, AJ, 126, 632
- Barger et al. (2005) Barger, A. J., Cowie, L. L., Mushotzky, R. F., Yang, Y., Wang, W.-H., Steffen, A. T., & Capak, P. 2005, AJ, 129, 578
- Bauer et al. (2002) Bauer, F. E., Alexander, D. M., Brandt, W. N., Hornschemeier, A. E., Vignali, C., Garmire, G. P., & Schneider, D. P. 2002, AJ, 124, 2351
- Bolzonella et al. (2000) Bolzonella, M., Miralles, J.-M., & Pelló, R. 2000, A&A, 363, 476
- Brand et al. (2005) Brand, K. et al. 2005, ApJ, submitted
- Coil et al. (2004) Coil, A. L., Newman, J. A., Kaiser, N., Davis, M., Ma, C., Kocevski, D. D., & Koo, D. C. 2004, ApJ, 617, 765
- Coleman et al. (1980) Coleman, G. D., Wu, C.-C., & Weedman, D. W. 1980, ApJS, 43, 393
- Conselice et al. (2003) Conselice, C. J., Bundy, K., U, V., Ellis, R. S., Eisenhardt, P., & DEEP2 Team. 2003, BAAS, 203, 106.03
- Davis et al. (2003) Davis, M. et al. 2003, Proc. SPIE, 4834, 161
- Dickinson et al. (2001) Dickinson, M. et al. 2001, BAAS, 33, 820
- Donley et al. (2005) Donley, J. L., Rieke, G. H., Rigby, J. R., & Pérez-González, P. G. 2005, ApJ, 634, 169
- Eales et al. (2000) Eales, S., Lilly, S., Webb, T., Dunne, L., Gear, W., Clements, D., & Yun, M. 2000, AJ, 120, 2244
- Edelson & Malkan (1986) Edelson, R. A. & Malkan, M. A. 1986, ApJ, 308, 59
- Egami et al. (2004) Egami, E. et al. 2004, ApJS, 154, 130
- Eisenhardt et al. (2004) Eisenhardt, P. et al. 2004, ApJS, 154, 48
- Elvis et al. (1994) Elvis, M., Wilkes, B. J., McDowell, J. C., Green, R. F., Bechtold, J., Willner, S. P., Oey, M. S., Polomski, E., & Cutri, R. 1994, ApJS, 95, 1
- Fadda et al. (2002) Fadda, D., Flores, H., Hasinger, G., Franceschini, A., Altieri, B., Cesarsky, C. J., Elbaz, D., & Ferrando, P. 2002, A&A, 383, 838
- Fazio et al. (2004) Fazio, G. et al. 2004, ApJS, 154, 39
- Flores et al. (1999) Flores, H., Hammer, F., Thuan, T. X., Césarsky, C., Desert, F. X., Omont, A., Lilly, S. J., Eales, S., Crampton, D., & Le Fèvre, O. 1999, ApJ, 517, 148
- Fomalont et al. (1991) Fomalont, E. B., Windhorst, R. A., Kristian, J. A., & Kellerman, K. I. 1991, AJ, 102, 1258
- Franceschini et al. (2005) Franceschini, A. et al. 2005, AJ, 129, 2074
- Fritz et al. (2005) Fritz, J., Franceschini, A., & Hatziminaoglou, E. 2005, MNRAS, in press (astro-ph/0511428)
- Georgakakis et al. (2003) Georgakakis, A., Hopkins, A. M., Sullivan, M., Afonso, J., Georgantopoulos, I., Mobasher, B., & Cram, L. E. 2003, MNRAS, 345, 939
- Georgakakis et al. (2005) Georgakakis, A., Nandra, K., Laird, E. S., Gwyn, S., Steidel, C. C., Sarajedini, V.L., Barmby, P., Faber. S. M., & Coil, A. L. 2005, MNRAS, submitted
- Gorjian et al. (2005) Gorjian, V. et al. 2005, ApJ, in preparation
- Groth et al. (1994) Groth, E. J., Kristian, J. A., Lynds, R., O’Neil, E. J., Balsano, R., Rhodes, J., & WFPC-1 IDT. 1994, BAAS, 26, 1403
- Hammer et al. (1995) Hammer, F., Crampton, D., Lilly, S. J., Le Fevre, O., & Kenet, T. 1995, MNRAS, 276, 1085
- Hatziminaoglou et al. (2005) Hatziminaoglou, E. et al. 2005, AJ, 129, 1198
- Higdon et al. (2004) Higdon, S. J. U., Weedman, D., Higdon, J. L., Herter, T., Charmandaris, V., Houck, J. R., Soifer, B. T., Brandl, B. R., Armus, L., & Hao, L. 2004, ApJS, 154, 174
- Hornschemeier et al. (2003) Hornschemeier, A. E., Bauer, F. E., Alexander, D. M., Brandt, W. N., Sargent, W. L. W., Bautz, M. W., Conselice, C., Garmire, G. P., Schneider, D. P., & Wilson, G. 2003, AJ, 126, 575
- Huang et al. (2004) Huang, J.-S. et al. 2004, ApJS, 154, 44
- Huang et al. (2005) —. 2005, ApJ, 634, 137
- Jannuzi & Dey (1999) Jannuzi, B. T. & Dey, A. 1999, in ASP Conf. Ser. 191: Photometric Redshifts and the Detection of High Redshift Galaxies, ed. R. Weymann, L. Storrie-Lombardi, M. Sawicki, & R. Brunner, 111
- Koekemoer et al. (2004) Koekemoer, A. M. et al. 2004, ApJ, 600, L123
- Lacy et al. (2004) Lacy, M. et al. 2004, ApJS, 154, 166
- Lilly et al. (1995) Lilly, S. J., Hammer, F., Le Fevre, O., & Crampton, D. 1995, ApJ, 455, 75
- Lonsdale et al. (2003) Lonsdale, C. J. et al. 2003, PASP, 115, 897
- Lu et al. (2003) Lu, N., Helou, G., Werner, M. W., Dinerstein, H. L., Dale, D. A., Silbermann, N. A., Malhotra, S., Beichman, C. A., & Jarrett, T. H. 2003, ApJ, 588, 199
- Lutz et al. (2004) Lutz, D., Maiolino, R., Spoon, H. W. W., & Moorwood, A. F. M. 2004, A&A, 418, 465
- Maccacaro et al. (1988) Maccacaro, T., Gioia, I. M., Wolter, A., Zamorani, G., & Stocke, J. T. 1988, ApJ, 326, 680
- Mainieri et al. (2005) Mainieri, V., Rosati, P., Tozzi, P., Bergeron, J., Gilli, R., Hasinger, G., Nonino, M., Lehmann, I., Alexander, D. M., Idzi, R., Koekemoer, A. M., Norman, C., Szokoly, G., & Zheng, W. 2005, A&A, 437, 805
- McAlary & Rieke (1988) McAlary, C. W. & Rieke, G. H. 1988, ApJ, 333, 1
- Miyaji et al. (2004) Miyaji, T., Sarajedini, V., Griffiths, R. E., Yamada, T., Schurch, M., Cristóbal-Hornillos, D., & Motohara, K. 2004, AJ, 127, 3180
- Miyazaki et al. (2002) Miyazaki, S. et al. 2002, PASJ, 54, 833
- Mushotzky (2004) Mushotzky, R. 2004, in ASSL Vol. 308: Supermassive Black Holes in the Distant Universe, ed. A. Barger (Kluwer Academic, Dordrecht), 53
- Nandra et al. (2005a) Nandra, K., Laird, E. S., Adelberger, K., Gardner, J., Mushotzky, R. F., Rhodes, J., Steidel, C. C., Teplitz, H. I., & Arnaud, K. A. 2005a, MNRAS, 356, 568
- Nandra et al. (2005b) Nandra, K., Laird, E. S., & Steidel, C. C. 2005b, MNRAS, 360, L39
- Pérez-González et al. (2005) Pérez-González, P. G. et al. 2005, ApJ, 630, 82
- Papovich et al. (2004) Papovich, C. et al. 2004, ApJS, 154, 70
- Peterson et al. (2005) Peterson, K. C., Gallagher, S. C., Hornschemeier, A. E., Muno, M. P., & Bullard, E. C. 2005, ApJ, in press (astro-ph/0509702)
- Piccinotti et al. (1982) Piccinotti, G., Mushotzky, R. F., Boldt, E. A., Holt, S. S., Marshall, F. E., Serlemitsos, P. J., & Shafer, R. A. 1982, ApJ, 253, 485
- Ranalli et al. (2003) Ranalli, P., Comastri, A., & Setti, G. 2003, A&A, 399, 39
- Rigby et al. (2005) Rigby, J. R., Rieke, G. H., Pérez-González, P. G., Donley, J. L., Alonso-Herrero, A., Huang, J.-S., Barmby, P., & Fazio, G. G. 2005, ApJ, 627, 134
- Rigby et al. (2004) Rigby, J. R. et al. 2004, ApJS, 154, 160
- Silva et al. (2004) Silva, L., Maiolino, R., & Granato, G. L. 2004, MNRAS, 355, 973
- Simpson & Eisenhardt (1999) Simpson, C. & Eisenhardt, P. 1999, PASP, 111, 691
- Steidel et al. (2003) Steidel, C. C., Adelberger, K. L., Shapley, A. E., Pettini, M., Dickinson, M., & Giavalisco, M. 2003, ApJ, 592, 728
- Stern et al. (2005) Stern, D. et al. 2005, ApJ, 631, 163
- Szokoly et al. (2004) Szokoly, G. P. et al. 2004, ApJS, 155, 271
- Waskett et al. (2004) Waskett, T. J., Eales, S. A., Gear, W. K., McCracken, H. J., Brodwin, M., Nandra, K., Laird, E. S., & Lilly, S. 2004, MNRAS, 350, 785
- Waskett et al. (2003) Waskett, T. J., Eales, S. A., Gear, W. K., Puchnarewicz, E. M., Lilly, S., Flores, H., Webb, T., Clements, D., Stevens, J. A., & Thuan, T. X. 2003, MNRAS, 341, 1217
- Webb et al. (2003) Webb, T. M. A., Lilly, S. J., Clements, D. L., Eales, S., Yun, M., Brodwin, M., Dunne, L., & Gear, W. K. 2003, ApJ, 597, 680
- Wilson et al. (2004) Wilson, G. et al. 2004, ApJS, 154, 107


| CXOaafootnotemark: | XMMbbfootnotemark: | IRAC RA | IRAC Dec | [3.6] | [4.5] | [5.8] | [8.0] | [24] | other IDsccfootnotemark: |
|---|---|---|---|---|---|---|---|---|---|
| (J2000) | (J2000) | AB | AB | AB | AB | AB | |||
| 142 (catalog 14h-142) | 14 15 56.88 | +52 16 07.2 | |||||||
| 98 (catalog 14h-098) | 14 16 08.45 | +52 21 17.1 | |||||||
| 74 (catalog 14h-074) | 14 16 10.59 | +52 16 21.8 | |||||||
| 67 (catalog 14h-067) | 14 16 13.72 | +52 22 35.6 | |||||||
| 132 (catalog 14h-132) | 14 16 14.18 | +52 19 39.4 | |||||||
| 5 (catalog 14h-005) | 14 16 22.75 | +52 19 16.5 | |||||||
| 26 (catalog 14h-026) | 14 16 22.94 | +52 12 12.3 | |||||||
| 69 (catalog 14h-069) | 14 16 29.66 | +52 23 33.1 | |||||||
| 91 (catalog 14h-091) | 14 16 31.16 | +52 22 10.1 | |||||||
| 32 (catalog 14h-032) | 14 16 32.81 | +52 19 01.6 | |||||||
| 31 (catalog 14h-031) | 14 16 34.53 | +52 22 38.9 | |||||||
| 127 (catalog 14h-127) | 14 16 34.53 | +52 11 53.5 | |||||||
| 70 (catalog 14h-070) | 14 16 35.98 | +52 19 11.9 | |||||||
| 37 (catalog 14h-037) | 14 16 38.08 | +52 23 08.6 | |||||||
| 113 (catalog 14h-113) | 14 16 39.95 | +52 15 03.9 | |||||||
| 42 (catalog 14h-042) | 14 16 42.37 | +52 25 26.8 | |||||||
| 13 (catalog 14h-013) | 14 16 42.44 | +52 18 12.3 | |||||||
| 3 (catalog 14h-003) | 14 16 43.25 | +52 14 35.9 | |||||||
| 2 | 63 (catalog 14h-063) | 14 16 43.40 | +52 29 02.9 | ||||||
| 146 (catalog 14h-146) | 14 16 43.56 | +52 21 02.3 | |||||||
| 27 (catalog 14h-027) | 14 16 43.97 | +52 22 19.1 | |||||||
| 4 | 35 (catalog 14h-035) | 14 16 45.39 | +52 29 05.9 | ||||||
| 6 | 15 (catalog 14h-015) | 14 16 48.78 | +52 25 58.9 | ||||||
| 7 | 1 (catalog 14h-001) | 14 16 49.44 | +52 25 30.8 | ||||||
| 118 (catalog 14h-118) | 14 16 49.56 | +52 16 53.5 | |||||||
| 82 (catalog 14h-082) | 14 16 49.90 | +52 18 09.1 | |||||||
| 56 (catalog 14h-056) | 14 16 50.50 | +52 16 34.8 | |||||||
| 25 (catalog 14h-025) | 14 16 50.92 | +52 15 28.5 | |||||||
| 8 | 9 (catalog 14h-009) | 14 16 51.27 | +52 20 46.0 | ||||||
| 9 (catalog c009) | 14 16 51.91 | +52 27 00.4 | |||||||
| 11 (catalog c011) | 14 16 53.74 | +52 21 24.2 | |||||||
| 47 (catalog 14h-047) | 14 16 53.90 | +52 20 43.2 | |||||||
| 12 | 54 (catalog 14h-054) | 14 16 58.40 | +52 24 13.1 | ||||||
| 15 (catalog c015) | 14 17 00.14 | +52 23 04.2 | |||||||
| 16 | 8 (catalog 14h-008) | 14 17 00.69 | +52 19 18.6 | ||||||
| 18 | 55 (catalog 14h-055) | 14 17 04.21 | +52 24 53.6 | ||||||
| 17 | 22 (catalog 14h-022) | 14 17 04.25 | +52 21 40.0 | ||||||
| 19 (catalog c019) | 14 17 05.68 | +52 31 46.8 | |||||||
| 20 (catalog c020) | 14 17 05.71 | +52 32 30.6 | |||||||
| 83 (catalog 14h-083) | 14 17 06.89 | +52 18 08.9 | |||||||
| 21 (catalog c021) | 14 17 08.41 | +52 32 25.1 | |||||||
| 22 | 80 (catalog 14h-080) | 14 17 08.70 | +52 29 30.1 | ||||||
| 23 | 148 (catalog 14h-148) | 14 17 08.89 | +52 27 09.1 | ||||||
| 30 (catalog 14h-030) | 14 17 09.89 | +52 18 50.0 | |||||||
| 25 | 20 (catalog 14h-020) | 14 17 10.56 | +52 28 29.0 | ||||||
| 26 (catalog c026) | 14 17 10.97 | +52 28 37.7 | |||||||
| 27 | 58 (catalog 14h-058) | 14 17 11.06 | +52 25 40.8 | ||||||
| 28 (catalog c028) | 14 17 11.61 | +52 31 32.5 | |||||||
| 29 | 17 (catalog 14h-017) | 14 17 11.85 | +52 20 11.9 | ||||||
| 31 (catalog c031) | 14 17 14.30 | +52 25 33.3 | |||||||
| 32 (catalog c0032) | 14 17 14.83 | +52 34 19.3 | |||||||
| 33 | 29 (catalog 14h-029) | 14 17 15.04 | +52 23 12.9 | ||||||
| 34 (catalog c034) | 14 17 15.21 | +52 26 50.5 | |||||||
| 144 (catalog 14h-144) | 14 17 15.40 | +52 19 14.5 | |||||||
| 35 (catalog c035) | 14 17 18.96 | +52 27 44.2 | |||||||
| 37 (catalog c037) | 14 17 19.28 | +52 27 55.9 | |||||||
| 38 | 129 (catalog 14h-129) | 14 17 20.05 | +52 25 00.5 | ||||||
| 39 (catalog c039) | 14 17 20.40 | +52 29 12.2 | |||||||
| 40 (catalog c040) | 14 17 22.95 | +52 31 43.7 | |||||||
| 41 | 28 (catalog 14h-028) | 14 17 23.40 | +52 31 53.7 | ||||||
| 42 (catalog c042) | 14 17 23.60 | +52 25 55.1 | |||||||
| 43 (catalog c043) | 14 17 24.24 | +52 32 29.8 | |||||||
| 44 | 4 (catalog 14h-004) | 14 17 24.59 | +52 30 24.9 | ||||||
| 46 (catalog c046) | 14 17 25.27 | +52 35 44.3 | |||||||
| 47 | 114 (catalog 14h-114) | 14 17 27.04 | +52 29 12.2 | ||||||
| 48 (catalog c048) | 14 17 27.28 | +52 31 31.5 | |||||||
| 49 | 149 (catalog 14h-149) | 14 17 28.90 | +52 35 54.1 | ||||||
| 92 (catalog 14h-092) | 14 17 29.88 | +52 37 16.4 | |||||||
| 50 | 48 (catalog 14h-048) | 14 17 29.95 | +52 27 47.9 | ||||||
| 51 (catalog c051) | 14 17 30.59 | +52 22 43.4 | |||||||
| 53 (catalog c053) | 14 17 30.71 | +52 23 04.8 | |||||||
| 54 (catalog c054) | 14 17 30.81 | +52 28 18.6 | |||||||
| 55 | 53 (catalog 14h-053) | 14 17 32.62 | +52 32 03.2 | 15V10 | |||||
| 57 | 128 (catalog 14h-128) | 14 17 33.82 | +52 33 49.4 | ||||||
| 58 (catalog c058) | 14 17 33.87 | +52 24 55.9 | |||||||
| 59 (catalog c059) | 14 17 34.37 | +52 31 06.9 | |||||||
| 60 | 11 (catalog 14h-011) | 14 17 34.85 | +52 28 10.6 | ||||||
| 61 | 2 (catalog 14h-002) | 14 17 35.95 | +52 30 29.8 | 15V12 | |||||
| 62 (catalog c062) | 14 17 36.30 | +52 30 16.8 | |||||||
| 63 (catalog c063) | 14 17 36.33 | +52 35 44.4 | |||||||
| 64 | 45 (catalog 14h-045) | 14 17 36.88 | +52 24 30.2 | ||||||
| 153 (catalog 14h-153) | 14 17 37.03 | +52 35 58.0 | |||||||
| 65 (catalog c065) | 14 17 37.34 | +52 29 21.6 | |||||||
| 66 | 117 (catalog 14h-117) | 14 17 38.68 | +52 34 14.0 | ||||||
| 67 | 24 (catalog 14h-024) | 14 17 38.86 | +52 23 33.1 | ||||||
| 68 (catalog c068) | 14 17 39.04 | +52 28 44.2 | |||||||
| 69 (catalog c069) | 14 17 39.30 | +52 28 50.3 | |||||||
| 70 (catalog c070) | 14 17 39.56 | +52 36 19.1 | |||||||
| 71 (catalog c071) | 14 17 41.48 | +52 35 45.3 | |||||||
| 72 | 23 (catalog 14h-023) | 14 17 41.86 | +52 28 23.4 | CUDSS14.13, 15V23 | |||||
| 75 | 122 (catalog 14h-122) | 14 17 45.44 | +52 29 51.3 | ||||||
| 76 | 50 (catalog 14h-050) | 14 17 45.62 | +52 28 02.0 | ||||||
| 77 | 59 (catalog 14h-059) | 14 17 45.95 | +52 30 32.6 | 15V28 | |||||
| 78 (catalog c078) | 14 17 46.13 | +52 25 27.2 | |||||||
| 79 (catalog c079) | 14 17 46.68 | +52 28 58.5 | |||||||
| 80 (catalog c080) | 14 17 46.96 | +52 25 11.5 | |||||||
| 81 (catalog c081) | 14 17 47.04 | +52 28 16.8 | |||||||
| 82 | 102 (catalog 14h-102) | 14 17 47.34 | +52 35 10.5 | Westphal-MD106 | |||||
| 83 (catalog c083) | 14 17 49.21 | +52 28 03.4 | 15V34 | ||||||
| 84 | 88 (catalog 14h-088) | 14 17 49.23 | +52 28 11.7 | 15V33 | |||||
| 85 (catalog |