3D Spectroscopy of Herbig-Haro objects
1 Introduction and Observations
HH 110 (in L1267, pc lopez:Rei91 ) and HH 262 (in L1551, pc lopez:Graham90 ) are two Herbig-Haro (HH) objects that share a peculiar, rather chaotic morphology. In addition, no stellar source powering these jets has been detected at optical or radio wavelengths. Both, previous observations lopez:Lopez98 lopez:Lopez05 and models lopez:Raga02 , suggest that the jet emission reveals an early stage of the interaction between a supersonic outflow and the dense outflow environment. These HHs are thus suitable to search for observational signatures of supersonic outflow/dense environment interaction.
We mapped these HHs with the Integral Field Instrument PMAS (Postdam Multi-Aperture Spectrophotometer) at the 3.5m CAHA telescope, under the PPAK configuration (331 science fibers, of 2.”7 each, in an hexagonal grid of 72” of diameter). We used the J1200 grating (spectral resolution 15 km s-1 for H; wavelength range 6500-7000 Å that includes the emissions from the characteristic red HHs lines: H, and the [NII] and [SII] doublets). Mosaics from several overlapping pointings (4 for HH 110 and 8 for HH 262) were made in order to cover the whole area of the emission of the HHs.
2 Results
From the PMAS data, we obtained maps of the morphology (monochromatic flux) and kinematics (radial velocity field and velocity dispersion) for the H, [NII] and [SII] line emissions of these two HHs. In addition, we computed line-ratio maps in order to explore the 2D structure of the electron density and excitation conditions, looking for the behaviour of the excitation and density spatial structures as a function of the velocity field. We show in the next section some of the maps obtained as an exemple of the PMAS science output.
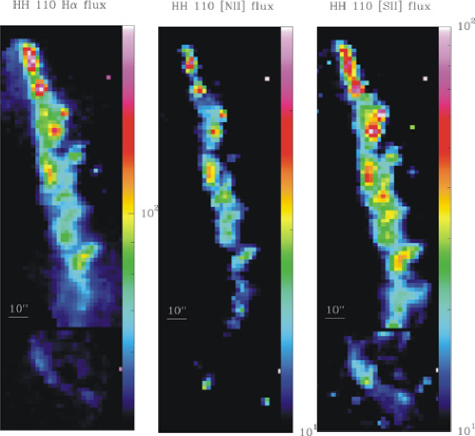
2.1 HH 110
The morphology of the emission is very similar for all the lines mapped, although some differences among the three lines can be appreciated. In particular, the H emission appears sligthly more extended across the jet beam than the [NII] and [SII] emissions (a low-emission component surrounding the knots is only detected in the H line).
The radial velocities derived from all the lines mapped appear blueshifted (in the rest frame of the cloud) and show a similar behaviour in all the lines along the jet axis: first, becomes redder as we move from the northern edge of the jet (knot A, with 30 km s-1 in H) to the south, up to a distance of 40” from knot A, where the reddest values are found ( 15 km s-1 in H); it changes further out towards more blueshifted values; the highest blueshifted values of ( 35 km s-1 in H) are found at 100” from knot A.
In general, electron densities, as derived from the sulphur line ratio, decrease along the jet axis with distance from knot A. However, the highest values ( 700 cm-3) are found at 40” from knot A, around the positions where reaches the reddest values for all the mapped lines.
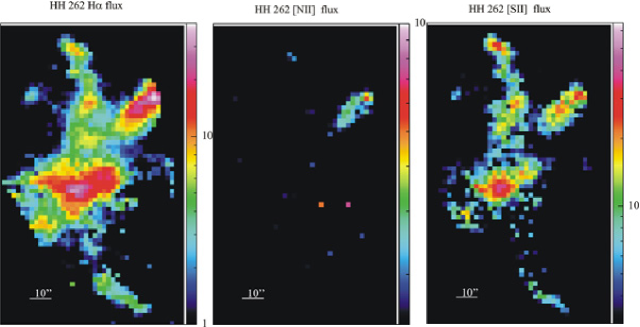
2.2 HH 262
The morphology of the H and [SII] emissions are similar. In contrast, emission from the [NII] line is only found in the northwestern region of HH 262.
The radial velocities derived from the H and [SII] lines appear redshifted, in the rest frame of the cloud, for all the HH 262 knots, and present a rather complex pattern. As a general trend, increases from the north to the center of HH 262 and decreases from the center to the south. For the HH 262 knots, significant differences between the H and [SII] values are found, and the velocity difference changes for each knot. FWHMs of these two lines appear significantly wider (by 20–30 km s-1) towards the center of HH 262 relative to the rest of the knots.
Electron densities derived from the sulphur line ratios are close to the low-density limit for most of the HH 262 knots. The highest values ( 240 cm-3) are found towards the northwestern HH 262 knots, coinciding with the loci where emission from the [NII] lines is detected. For the rest of the object, electron density is less than 100 cm-3, decreasing slightly from north to south.
References
- (1) J.A. Graham, M.H. Heyer: PASP 102, 972 (1990).
- (2) R. López, M. Rosado, A. Riera et al: AJ 116, 845 (1998).
- (3) R. López, R. Estalella, A.C. Raga et al: A&A 432, 567 (2005).
- (4) A.C. Raga, E.M.de Gouveia Dal Pino, A. Noriega-Crespo et al: A&A 392, 267 (2002).
- (5) B. Reipurth, M. Olberg: A&A 246, 535 (1991).
Index
- paragraph §2.2