SIGNATURES OF EXTRAGALACTIC DUST IN PRE-SWIFT GRB AFTERGLOWS
Abstract
We present the results of a systematic analysis of gamma-ray burst afterglow spectral energy distributions (SEDs) in the optical/near-infrared bands. Our input list includes the entire world sample of afterglows observed in the pre-Swift era by the end of 2004 that have sufficient publicly available data. We apply various dust extinction models to fit the observed SEDs (Milky Way, Large Magellanic Cloud and Small Magellanic Cloud) and derive the corresponding intrinsic extinction in the GRB host galaxies and the intrinsic spectral slopes of the afterglows. We then use these results to explore the parameter space of the power-law index of the electron distribution function and to derive the absolute magnitudes of the unextinguished afterglows.
1 INTRODUCTION
According to the most popular progenitor model of long-duration Gamma-Ray Bursts (GRBs), the collapsar model (Woosley, 1993), a GRB is the result of ultra-relativistic jets ejected by an accreting black hole formed by the core-collapse of a massive star (most probably a Wolf-Rayet star). This predicts a physical link between GRBs and supernovae (SNe) that has been spectroscopically confirmed in four cases so far: XRF 020903 (Soderberg et al., 2005), GRB 021211/SN2002lt (Della Valle et al., 2003), GRB 030329/SN2003dh (e.g., Hjorth et al., 2003a; Stanek et al., 2003) and GRB 031203/SN2003lw (e.g., Malesani et al., 2004, Mazzali et al. 2005, in preparation). Further evidence comes from the observation of late-time bumps in GRB afterglows that can be modelled very well by an underlying SN component (Bloom et al., 1999; Zeh, Klose, & Hartmann, 2004), and which have led to the conclusion that in fact all long-duration GRBs are physically related to SN explosions (Zeh, Klose, & Hartmann, 2004, Paper I). Furthermore, the collapsar model implies that the progenitors of long-duration GRBs are associated with regions of high-mass star formation (Paczyński, 1998), which might reveal themselves by a detectable extinction in the GRB host galaxies along the lines of sight towards the burster. This idea is further supported by the so-called dark bursts (Groot et al., 1998), for which no optical afterglow has been discovered despite rapid and deep searches in small error box regions. While most none-discoveries are the result of too shallow searches and too large error boxes (e.g., Jakobsson et al., 2004b; Rol et al., 2005), a small percentile remains that require intrinsic extinction to dim the afterglow, e.g., GRB 970828 (Groot et al., 1998; Djorgovski et al., 2001), 990506 (Taylor et al., 2000) and 020819 (Jakobsson et al., 2005a), while others might have been intrinsically underluminous (for a discussion, see e.g., Fynbo et al., 2001a; Lazzati, Covino & Ghisellini, 2002; Klose et al., 2003).
Of particular interest within the dust extinction model is the statistical distribution of the amount of visual extinction in the GRB host galaxies, as well as the nature of the corresponding dust. Given the fact that GRBs and their afterglows can be observed up to high redshift, they offer the possibility to get insight into the nature of cosmic dust when the universe was much younger and galaxies were much less evolved. Furthermore, since the optical properties of the dust grains trace the environmental conditions in the interstellar medium (Fitzpatrick & Massa, 1986; Draine, 2000; Bradley et al., 2005), they are to some degree an indicator for the physical conditions to make a GRB progenitor.
The present paper is the third in a series of papers where we employ a large database of photometry gathered from the literature to reanalyze all optical afterglow light curves of GRBs in the pre-Swift era in a consistent manner to derive a homogenous sample, which is then used to study afterglow properties in a statistical way. In Paper I and an update (Zeh, Klose, & Hartmann, 2005), the properties of the supernovae underlying nearby afterglow light curves were explored. In Paper II (Zeh, Klose, & Kann, 2005) the optical light curve parameters were derived for a large (and basically complete) sample of afterglows observed by the end of 2004, up to the launch of the Swift mission. In this paper, we extend this systematic analysis to the spectral energy distribution (SED) of GRB afterglows in the optical/near-infrared bands in order to search for signals from extinction by dust in the GRB host galaxies.
In § 2, we present the methods with which we analyzed the afterglow SEDs. Among the 59 GRBs studied in Paper II, 30 had data quality sufficiently high to be included in a sample for an investigation of the SEDs. We then further reduce this sample to a Golden Sample of 19 GRB afterglows with parameters derived from specific dust model fits. In § 3 we present the results derived from our analysis and discuss our findings in the context of the standard fireball model. The fitting process allows us to derive the host galaxy extinction along the line of sight and the intrinsic, extinction-corrected spectral slope () of the afterglow light in the optical/near-infrared bands. The - sample is then further analyzed statistically to derive conclusions about the environment of GRBs and the dust properties of high-redshift galaxies.
2 DATA ANALYSIS
2.1 The fitting Procedure
In Paper II we presented the analysis of a complete list of optical/NIR afterglow light curves for which sufficient public data was available, up to GRB 041006. One parameter derived in these light curve fits is the normalization constant , the magnitude of the afterglow at a certain time, being one day after the GRB trigger in the case of a light curve fit with a simple power-law (), or the jet break time, , in case of a fit with a smoothly broken power-law with a pre-break decay slope and a post-break decay slope (Beuermann et al., 1999). All data used to fit these light curves is corrected for Galactic extinction with derived from the COBE maps (Schlegel, Finkbeiner & Davis, 1998) employing the Milky Way extinction curve of Cardelli, Clayton & Mathis (1989). The contemporaneous afterglow brightness in different photometric bands is then transformed into a spectral energy distribution, using zero fluxes and median wavelengths taken from the literature. The SED for GRB 030329 is derived in an alternate way, see Appendix B. The fits use a Levenberg-Marquardt minimization algorithm. Unless stated otherwise, all errors in this paper are at the confidence level.
Initially, we assume no extinction and the SEDs are fit with a simple power-law, . In the following, we label a slope derived from such a fit . A steep combined with a non-linear (curved) is then indicative of extinction in the GRB host galaxy.
In order to derive the visual extinction in the GRB host galaxy along the line of sight, we transform the wavelengths of the SED into the host galaxy frame following (Fynbo et al., 2001b), using redshifts taken from the compilation of Friedman & Bloom (2005). In two cases redshift estimates are used. For GRB 980519, we use a redshift of , following Jaunsen et al. (2001) who state that due to the lack of a supernova bump. For XRF 030723, we varied the redshift and fit the SED for each redshift, and find the best results in a redshift range of to 0.4. Thus, we adopt . Fynbo et al. (2004) find tentative evidence for a low redshift (although the host galaxy would be very faint), and Butler et al. (2005a) find a preferred from the Amati relation (Amati et al., 2002). In both cases, the SED is fit well by a power-law with an additional small amount of source frame extinction. The influence of intergalactic Lyman absorption on the photometry was accounted for by excluding SED data points lying beyond Hz in the host frame from the fit111For GRB 030323 (), the V band also had to be excluded as the host galaxy is a DLA with a very wide Lyman absorption line (Vreeswijk et al., 2004).. The observed SED (corrected for Galactic extinction) is then modeled by the function
| (1) |
with
| (2) |
Here, is the intrinsic power-law slope of the SED, and a normalization constant (we choose the unextinguished flux density at Hz in the host galaxy frame). The function is the extinction law assumed for the interstellar medium (ISM) of the GRB host galaxy. We call this extinction source frame extinction. It encompasses local extinction close to the site of the GRB and host galaxy extinction further away in case the afterglow passes through a significant part of the host galaxy along the line of sight. The extinction law for the Milky Way (MW), the Large Magellanic Cloud (LMC), and the Small Magellanic Cloud (SMC) was taken from Pei (1992). These three dust types differ strongly in the wavelength region we examine (host frame UV/optical/NIR), especially toward shorter wavelengths. The sequence MW, LMC, SMC is given by a decreasing strength of the 2175 Å bump, an increasing FUV extinction, and a decreasing reddening per H atom (Draine, 2000). The former implies the absence of very small carbonaceous grains (Weingartner & Draine, 2001), while the latter is consistent with the trend observed for the metallicity in HII regions, with MW representing the highest metallicity and SMC the lowest. Thus, SMC dust traces the dust properties in low-metallicity environments. As the wavelengths of the SED are shifted from the UV into the optical/NIR, a distinction between the three dust types is easiest for GRBs at high redshift, whereas for nearby GRBs the three extinction curves are almost identical in the considered wavelength regime.
Since the fit has three free parameters (, and ), the observed SED has to have at least four data points. The one exception is GRB 000131 (Appendix B), which we include because of its very high redshift (, Andersen et al., 2000). The fitting process is very sensitive to slight variations in the SED, especially if the data points have small errors, so we did a careful check for each SED and removed outliers. Furthermore, we added a systematic error of 0.03 magnitudes to each data point of the SED (with the exception of those small number of cases where is based on only one data point, as these almost always have much larger errors anyway) to encompass uncertainties that may derive from the process of data reduction. This results in a strong decrease of for the fits and reduces the importance of this measure for discerning among different models for SED fits.
2.2 Selection of a Golden Sample
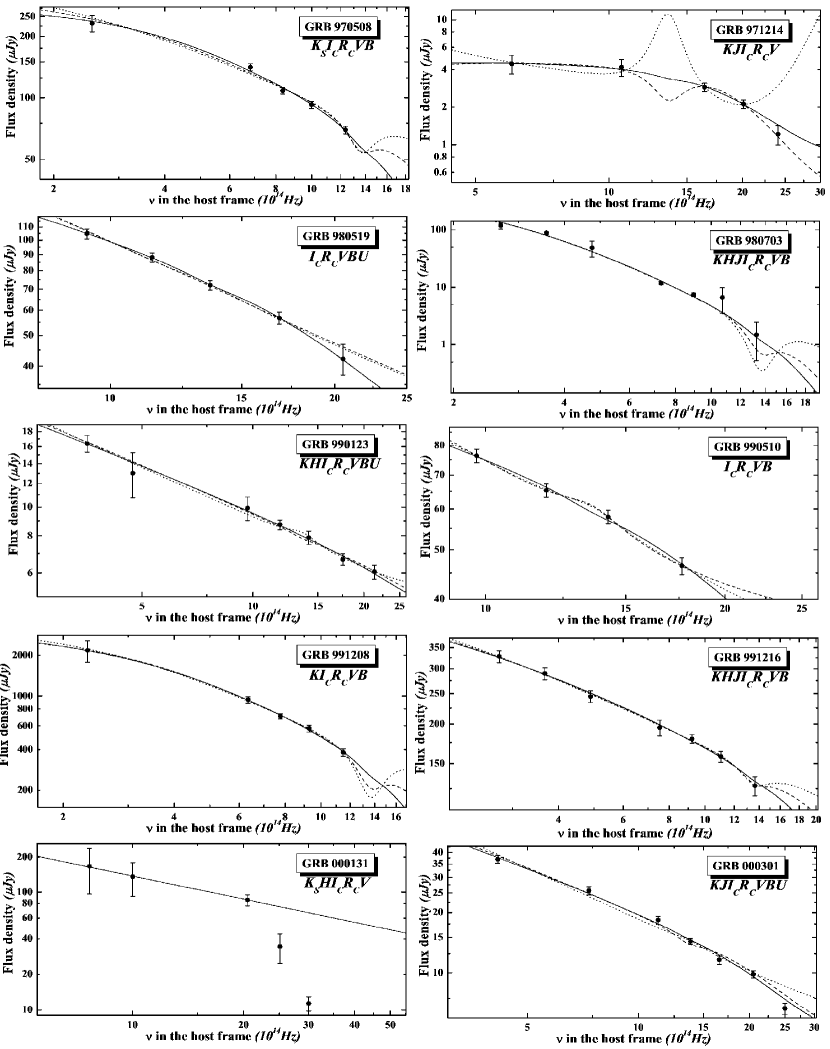
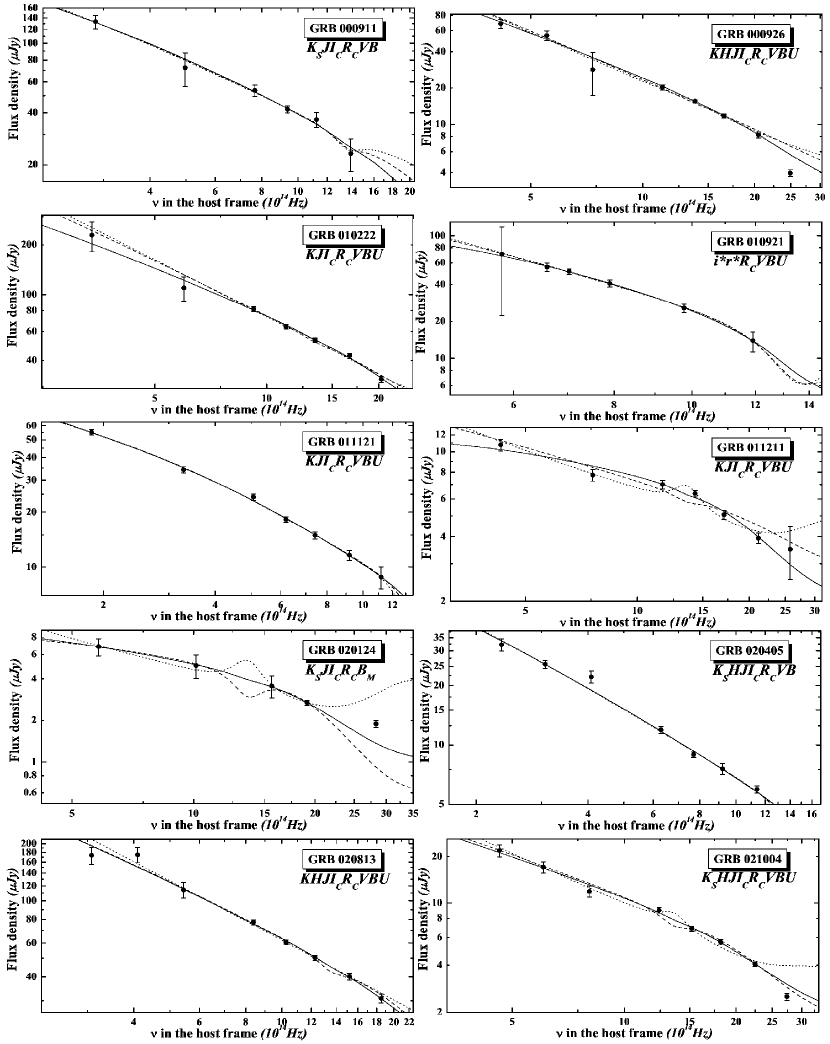
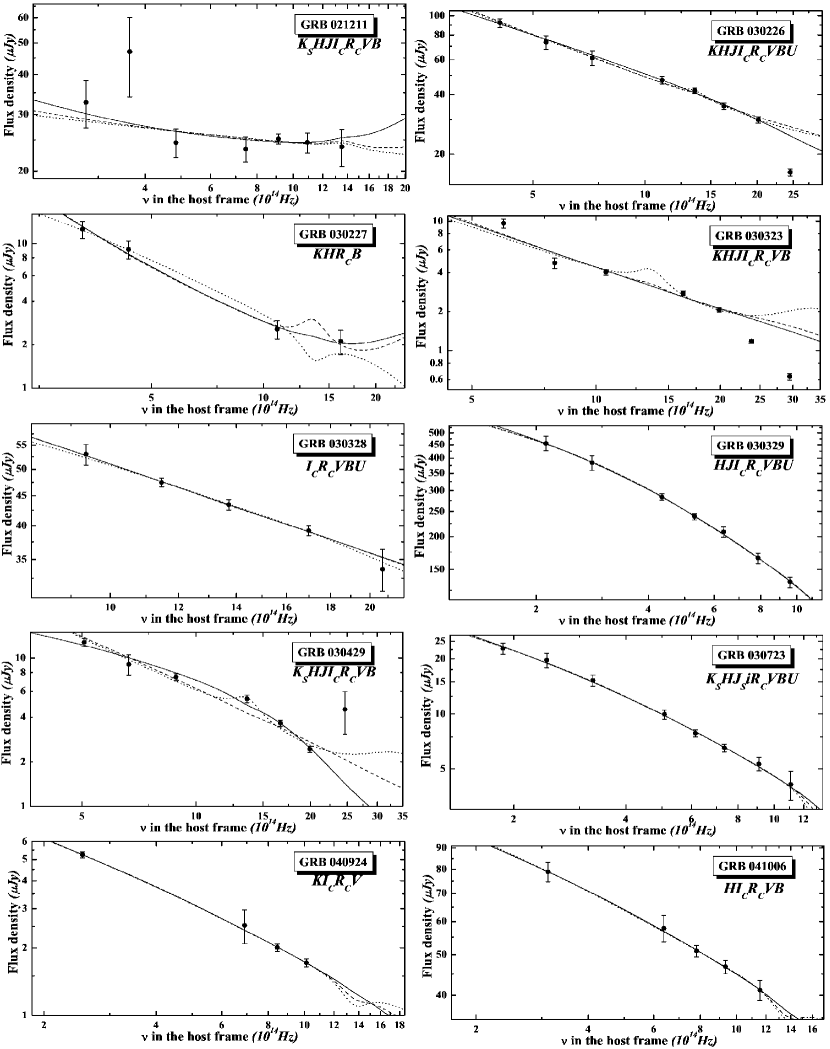
Our final sample (Table 1) comprises 30 afterglows out of the 59 bursts included in the sample of Paper II, with fits to the three dust models for each afterglow. Figure 1 shows all 30 SEDs and the associated best fits for each of the three dust models. This figure contains all fit results that we obtain, including those with unphysical results, just in order to show the failure of certain extinction laws to reproduce the observational data.
Table 1 reveals that many of the fits are unsatisfactory. First of all, some fits have very large error bars and . Since the SEDs are fit by allowing all three free parameters (incl. ) to vary simultaneously, this creates a cross-sectional error, as the errors of and are correlated. The steepest spectral slope () results in the smallest extinction () and vice versa. Secondly, many fits, especially when using the MW dust model, find negative extinction. This would imply bright emission features, for which we have no evidence. Thirdly in some cases is found, while the standard fireball model implies in the timespans (hours to days) and wavelength bands that afterglows are typically observed in, and thus the timespan where we derive . These afterglow SEDs (e.g. GRB 971214) are categorized by a relatively shallow unextinguished slope to 1 but a strong spectral curvature. Correction of this curvature results in . One solution would be dust with an increased FUV extinction, but recent results on high redshift quasars (Maiolino et al., 2004) do not support this idea. We note that in these cases the data base is also sparse in photometric bands other than .
To derive a more homogenous sample, which we call the Golden Sample, we employ the following criteria:
-
1.
The 1 error in () and the 1 error in () should both be .
-
2.
.
-
3.
We do not consider GRBs where all fits (MW, LMC, and SMC) find , even if the previous criterium is fulfilled.
-
4.
(although we do not reject cases with ).
-
5.
A known redshift.
As there is no case where LMC dust is clearly preferred compared to SMC and MW dust (Table 1), in the following we remove all LMC dust cases from further consideration.
After applying these criteria, for the remaining 19 GRBs, in eight cases only one dust model remains. For GRB 000131 no distinction can be made, as it is not fit with extinction. The remaining ten GRBs give ambiguous results when it comes to distinguishing between the two dust models. With the exception of GRB 020813 and GRB 030328, where visual inspection of the fits shows that the inclusion of SMC dust reproduces the observed SED better than MW dust, no true distinction can be made at all. For these GRBs, we do not claim any dust model preference, but for the sake of consistency, we choose the dust model result which produces smaller errors in the derived parameters. This results in 19 - pairs which we designate our Golden Sample (Table 2).
2.3 Highly extinguished GRBs outside our sample
There are some GRBs for which high visual source frame extinction has been deduced in the literature but which are not included in Table 1. For GRB 980329, no redshift is known, although it is assumed to be high. Jaunsen et al. (2003) derive a Bayesian photometric redshift of . The very steep observed spectral slope (uncorrected for extinction) has been noted by several authors. Yost et al. (2002) use their own data combined with data from the literature and derive an for , corresponding to assuming a Galactic dust-to-gas ratio. This is concurrent with our result for SMC dust and under the assumption of a redshift of . However, this result also has , implying that the true host extinction is lower than . Two afterglows which have redshifts but viable data in only two colors, GRB 990705 and GRB 000418, could not be fitted with the procedure outlined in §2.1. Masetti et al. (2000) find , in agreement with our result. While they do discuss reddening by intrinsic dust, their lack of a redshift measurement does not allow them to find a definite result. The steep initial decay suggests a wind environment with a cooling break blueward of the optical bands. Using this case and SMC dust, we derive . For GRB 000418, assuming a wind (ISM) environment with the cooling break blueward of the optical bands and the new derived light curve parameters from Paper II we fix via the - relations and find (). The latter is slightly smaller than in Klose et al. (2000) (who used an ISM environment), while Berger et al. (2001a) find for LMC dust. Finally, there are indications of very high source frame extinction from the NIR afterglows of GRB 030528 (Rau et al., 2004) and GRB 040827 (De Luca et al., 2005), but we were not able to perform any fits.
3 RESULTS AND DISCUSSION
3.1 The prevalence of SMC-like dust in GRB host galaxies
In the selection of our Golden Sample, there were eight bursts where application of our selection criteria yielded an unambiguous result. SMC dust is by far the most preferred model, with seven out of the eight cases (Table 2), only GRB 970508 has evidence for MW dust. This result is expected from studies of GRB host galaxies, which indicate that most hosts are low-metallicity galaxies, as they are Lyman emitters, blue, and subluminous (e.g., Fynbo et al., 2003; Le Floc’h et al., 2003; Jakobsson et al., 2005b). Thus we deduce that the ISM in these galaxies is probably metal-poor.
While the preference of SMC-like dust in GRB environments has already been found by many groups for several bursts, e.g., GRB 000301C (Jensen et al., 2001), GRB 000926 (Fynbo et al., 2001b), GRB 010222 (Lee et al., 2001), GRB 020813 (Savaglio & Fall, 2004), GRB 021004 (Holland et al., 2003), GRB 030226 (Klose et al., 2004), GRB 030429 (Jakobsson et al., 2004a), XRF 030723 (Fynbo et al., 2004), our study puts this conclusion on a statistical basis. Given the sparse knowledge we have so far on the dust properties in cosmologically remote galaxies we note however that this finding does not necessarily imply the requirement of low-metallicity environments for the creation of GRB progenitors, as it might be indicated by SMC-like dust. The fact that at least some afterglows SEDs are fitted best assuming MW dust (e.g., the spectral feature found in the spectrum of GRB 991216, Vreeswijk et al., 2005, which is mirrored in our SED result, and the strong preference of MW dust for GRB 030227, although the large errors make this case unsure) raises doubt on such a general requirement. Even though one can not rule out the possibility that in such cases the line of sight passes through foreground material with different grain properties and ISM metallicity. In any case, it is clear from this study that GRB afterglows can be used as a tool in order to explore the properties of cosmic dust in the cosmologically remote universe, in star-forming regions in particular and in galaxies in general. But high quality photometric data are essential for building larger samples.
3.2 The extinction within GRB host galaxies
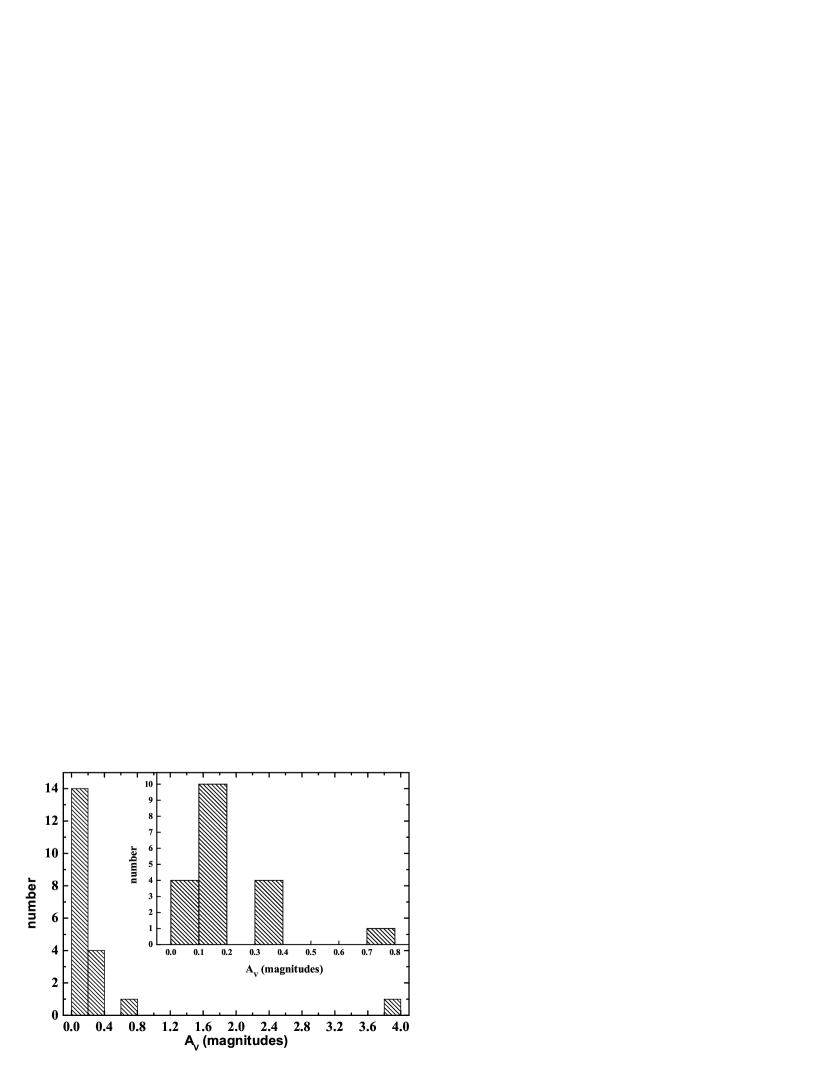
Among the 19 GRBs in our Golden Sample (Table 2), we find eleven with . We note that almost all of these cases are also those with the highest quality data. Basically, this is not surprising, as more SED data reduces errors. It is more speculative to state that, given high quality SED data, there will always be small amounts of source frame extinction detected in GRB afterglows. In eight of these cases, the detection is significant at the 2 level or higher, it is significant at more than 3 in two cases and at 4 in one case.
The distribution of derived intrinsic extinctions is given in Figure 2. A strong clustering toward low extinctions () is evident. Zooming in with smaller bins shows that values between and are preferred, with a non-error-weighted mean value of . No afterglow is extinguished by more than 0.8 magnitudes. As a comparison, the prime example of a dark burst is plotted, GRB 970828. For this burst, Djorgovski et al. (2001) derive by interpolating between X-ray and radio data and comparing this with deep optical observations that found no afterglow Groot et al. (1998). The intervening space is free of examples, creating a potential Dark Burst Desert. On the other hand, there are two afterglows in Table 1 that have mean values lying in this Dark Burst Desert but are not included in the Golden Sample due to the large errors of their fits (criterium (1) in § 2.2). For GRB 010921, MW dust is preferred, as SMC dust finds . We derive , in agreement with Price et al. (2003). While this is a positive detection, the error encompasses most other bursts of the Golden Sample. For GRB 980703, no dust model preference can be derived, but even for the SMC result with smaller extinction, we find .
How real is the non-existence of highly extinguished afterglows? A first argument against the reality of the Dark Burst Desert is that our sample is biased toward afterglows with low source frame extinction, as we require viable photometric data in several wavebands and a known redshift. Intrinsic extinction complicates the gathering of photometry (starting with the discovery of the afterglow) and a spectroscopic redshift. In § 2.3, we mentioned several probably highly extinguished afterglows that are not part of our sample due to the sparsity of their photometric data. Highly extinguished afterglows are not observed well enough to determine conclusively that they are highly extinguished and not just intrinsically faint (Klose et al., 2003).
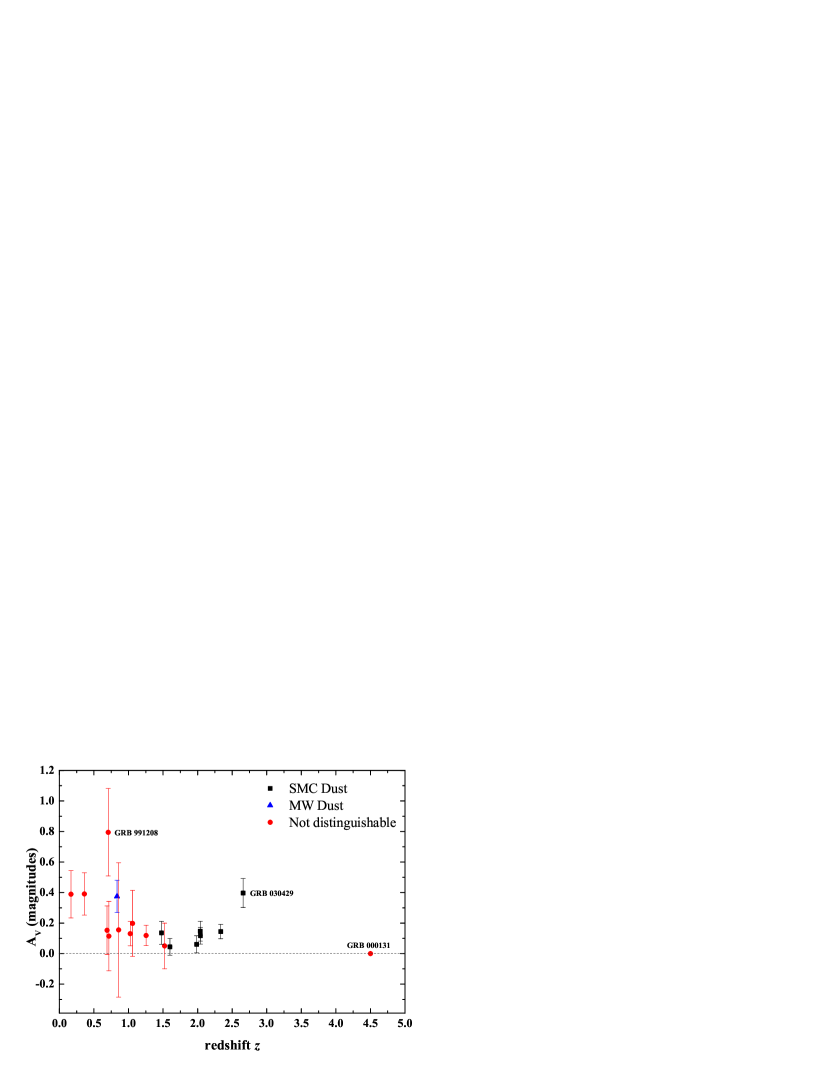
Figure 3 shows the derived visual extinctions (Table 2) plotted as a function of redshift (values taken from Friedman & Bloom, 2005). With the exception of GRB 030429 the amount of extinction drops sharply toward high redshifts. Most likely, this can be explained by an observational bias, at least in the pre-Swift era where only very few afterglows were already localized within minutes after a burst. In particular, due to the wavelength dependence of the dust opacity, the higher the redshift the more effective dust can dim an afterglow in the optical bands. Furthermore, the redshift measurement itself is biased toward bright and unextinguished afterglows, as many redshifts are determined from absorption spectra taken when the afterglow is much brighter than the underlying host galaxy. Finally, our data indicate that, on average, low- GRBs have brighter afterglows (cf. Figure 7), and thus have a greater chance of being detected through significant extinction. Unfortunately, the chances of detecting a ”Rosetta Stone Dark Burst” at low redshift that is highly obscured by dust but still bright enough to yield viable data and a redshift might be small if the GRB frequency is coupled with the star-formation rate (e.g., Lloyd-Ronning et al., 2002; Firmani et al., 2004) and low metallicities (MacFadyen & Woosley, 1999).
It is also visible that the the ability to discern between different dust models is coupled to the redshift, as the strongest deviations (2175 Å bump, FUV extinction) appear in the UV region and the burst has to lie at a certain redshift to shift these features into the optical bands.
3.3 Host extinction versus star formation rate
Assuming that our database is not seriously affected by an observational bias (dark bursts), Figure 4 shows that the standard GRB afterglow is nearly unextinguished in its host galaxy. Since any long-lasting dust destruction by the intense fireball radiation should represent itself in a color evolution of the afterglow (Waxman & Draine, 2000), which we do not find in our data, we conclude that on average there is not much evidence for dust in GRB environments along the line of sight. Furthermore, any dust destruction could only affect the dust in the immediate GRB environment, say, within 10 pc around the burster (Waxman & Draine, 2000; Draine, 2000; Rhoads & Fruchter, 2001; Draine & Hao, 2002). Dust at larger distances will still produce extinction. Additionally, the Swift satellite has made observations of early GRB afterglows routine, and a major result is the almost complete absence of reverse shock UV flashes (Roming et al., 2005). It seems that in most cases the absence of large amounts of dust is not due to dust destruction but due to the fact that the standard GRB progenitor (seen pole-on along its rotational axis) is not enshrouded by dust, globally and locally. Thus, if in those cases where significant extinction is found the extinction is not just produced in the immediate GRB environment (local extinction) but prevails within the host galaxy (global extinction), we would expect that GRBs for which we find significant optical extinction are located in very dusty, submm-bright hosts.
In order to explore this possibility, we have taken from the literature all submm data for GRB hosts with a flux density at the 1 level that are also in our main sample of 30 afterglows (Berger et al., 2003a; Tanvir et al., 2004) and calculated the corresponding star formation rate (SFR) via the procedure developed by Yun & Carilli (2002) (cf. Berger et al., 2003a) to take the different redshifts into account. Since the SFR is a direct measure of the far-infrared luminosity of a galaxy (Kennicutt, 1998), it traces its total amount of radiating dust. For GRB 980703, we conservatively used the result for SMC dust, which has the lowest extinction, and took the SFR from Berger et al. (2001b). We added GRB 000418 (, § 2.3), arbitrarily assuming a 1 error of 0.5 mag, and transformed the result for GRB 011211 (SMC dust) into an upper limit, as we find , making unsure. The resulting relation of SFR ( per year) versus is shown in Figure 4. A trend is visible, a rising SFR is coupled to a rising intrinsic visual extinction along the line of sight, with the exception of GRB 010222. A linear fit to the data (excepting GRB 010222222 The most remarkable outlier in the potential SFR- relation is GRB 010222. A Hubble Space Telescope image of the GRB 010222 host galaxy reveals the location of the GRB being offset by a small margin from the center of the galaxy (Fruchter et al., 2001; Galama et al., 2003). We find a low extinction value along the line of sight, whereas persistent submillimeter flux indicates that this is a dusty starburst galaxy (Frail et al., 2002). The discrepancy is resolved if the GRB happened toward the edge of the galaxy, but our line of sight places it in front of the galaxy.) gives . We conclude that, on average, GRB afterglows that show significant extinction along the line of sight in their host are located in galaxies with a substantial star formation rate and, hence, a globally acting extinction by large amounts of dust. If this interpretation is correct, then the trend seen in the data indicates that the line-of-sight can pass through a significant extent of the host galaxy. Since the sample is still very small and the error bars on both the SFR and the extinction are very large, it is clear that more and better data are required in order to verify this result.
3.4 The intrinsic spectral slope and the power-law index of the electron distribution function
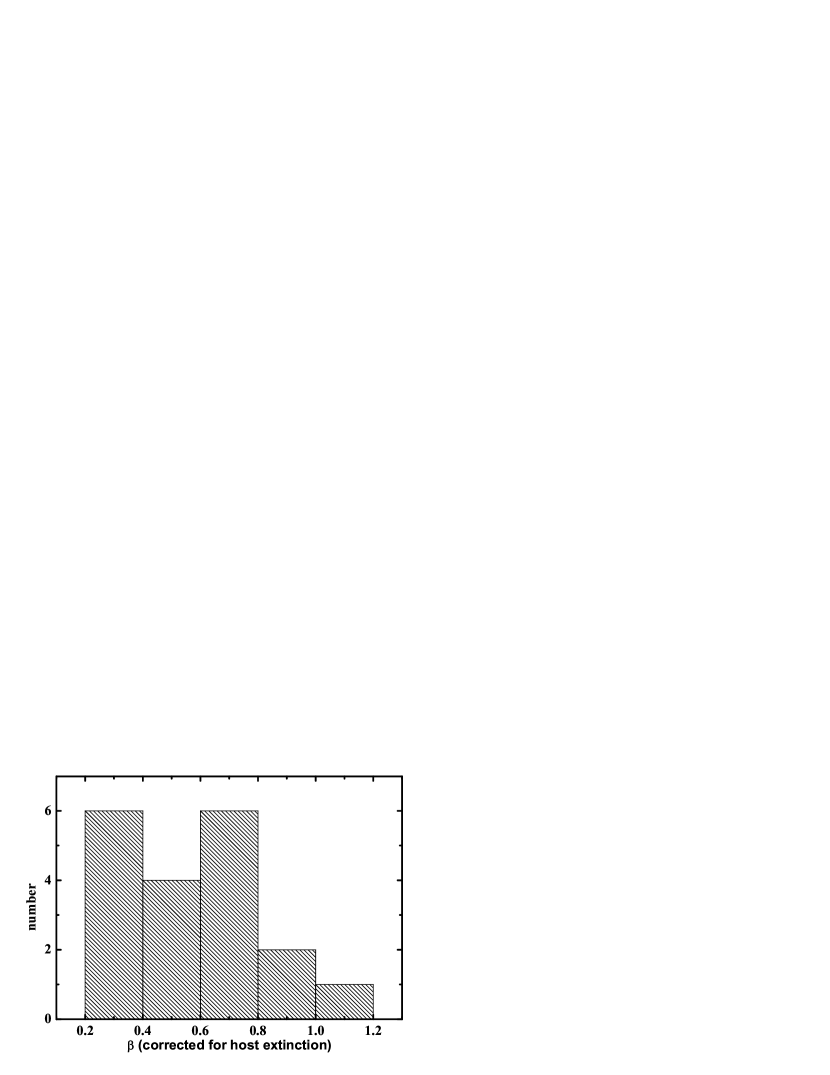
Figure 5 displays the distribution of the intrinsic spectral slopes, , for the bursts from Table 2. The distribution is broad, ranging from 0.2 to 1.2, and features a peak around . We find a non-error-weighted mean value of . This result of a broad distribution of the intrinsic SED of the afterglows is probably robust, since (1) our light curve fits of the individual afterglows usually include many data points covering several days, so that we are not much sensitive to individual measurement errors and (2) these fits do not include the very early phase of an afterglow when its spectral properties might develop much faster than at later times. In fact, with the exception of the early afterglows of GRB 021004 and GRB 030329, we have never found clear evidence for color variations of the genuine afterglow light in our data.
While it is not the goal of the present paper to find reliable explanations for the observed width of the distribution of spectral slopes of the afterglows in the optical/NIR bands, we note that the mean of this distribution gives a value for the power-law index of the electron distribution () of , assuming a wind environment and the cooling frequency blueward of the optical bands (Zhang & Mészáros, 2004, and references therin) and the peak of the histogram (Figure 5). This is in general agreement with theoretical predictions for ultra-relativistic shocks (Kirk et al., 2000; Achterberg et al., 2001). The maximum values we find for (Figure 5) could then be explained by those afterglows which had the cooling frequency redward of the optical bands during the entire time span when they were observed, provided that is a universal number. On the other hand, a universality of seems to be difficult to reconcile with those afterglows which have . Assuming the standard afterglow models (Zhang & Mészáros, 2004), these afterglows require , provided that the basic model assumptions are indeed fulfilled in these cases. Note that in Paper II we also found afterglows that require based on their light curve shapes alone.
The fact that some afterglows require has already been reported and in detail explored by others (cf. Panaitescu & Kumar, 2000; PK2001, 2001; Panaitescu, 2005). Based on our SED fits three of 19 afterglows have within their 1 error bar (GRB 970508, GRB 991216 and GRB 030429) which implies , while a very shallow afterglow decay slope brings GRB 990123, GRB 991216, GRB 010222, GRB 030328 and GRB 041006 into this sample (Paper II). Obviously, only a minority of afterglows require . It is not obvious why these afterglows are specific in some sense. The afterglow of GRB 991216 is one of the brightest afterglow for redshifts . On the other hand, the afterglow of GRB 041006 is one of the less luminous afterglows (§ 3.6). Thus, is not a question of luminosity. Note that both afterglows have only small intrinsic extinction (), so these low values for are not just an artifact of the fitting process. For GRB 991216, the unextinguished slope is , for GRB 041006 it is . We also note that all these afterglow light curves are sampled fairly (GRB 990123) to very well (GRB 010222), implying that the finding of a flat spectral slope is not a question of data quality either.
3.5 Dust-to-gas ratios in GRB host galaxies
X-ray observations or the modeling of Lyman absorption allow the determination of the hydrogen column density along the line of sight to the GRB in its host galaxy after correcting for the column density in our Galaxy (Dickey & Lockman, 1990). In Figure 6 we present a sample of afterglows for which we have derived and for which values are reported in the literature (Table 3). This is an update of the plot first presented in Galama & Wijers (2001) and expanded in Stratta et al. (2004) 333Note that we, unlike Galama & Wijers (2001) and Stratta et al. (2004), use a log-log plot to avoid crowding toward low , leading to a linear depiction of the dust model curves.. The results reinforce our findings presented in § 3.1. With two exceptions, all points in the plot lie on the theoretical prediction for SMC dust or even above it. The two exceptions are GRB 021004 and 030329, where only upper limits for are given in the literature, leading to dust-to-gas ratios higher than even for the Milky Way. On the other hand, both afterglow SEDs are best fit with SMC dust (although the preference is only weak for GRB 030329), implying that the three dust models we use are not applicable in all cases. Incidentally, GRB 021004 and GRB 030329 have the two best observed afterglow light curves with the most pronounced substructure (Paper II). The strongest outlier in Figure 3 is GRB 990123, for which we find a very low source frame extinction. The extremely bright UV flash of this burst (Akerlof et al., 1999) may have burned significant amounts of dust along the line of sight (cf. Waxman & Draine, 2000; Galama & Wijers, 2001; Rhoads & Fruchter, 2001; Perna, Lazzati & Fiore, 2003), reducing the dust-to-gas ratio. No early multicolor data exists to probe the color variations that are expected in the early light curve.
3.6 The luminosity distribution of the afterglows
Knowledge of the intrinsic spectral slope of the afterglows allows us to determine their luminosity distribution (Appendix A).
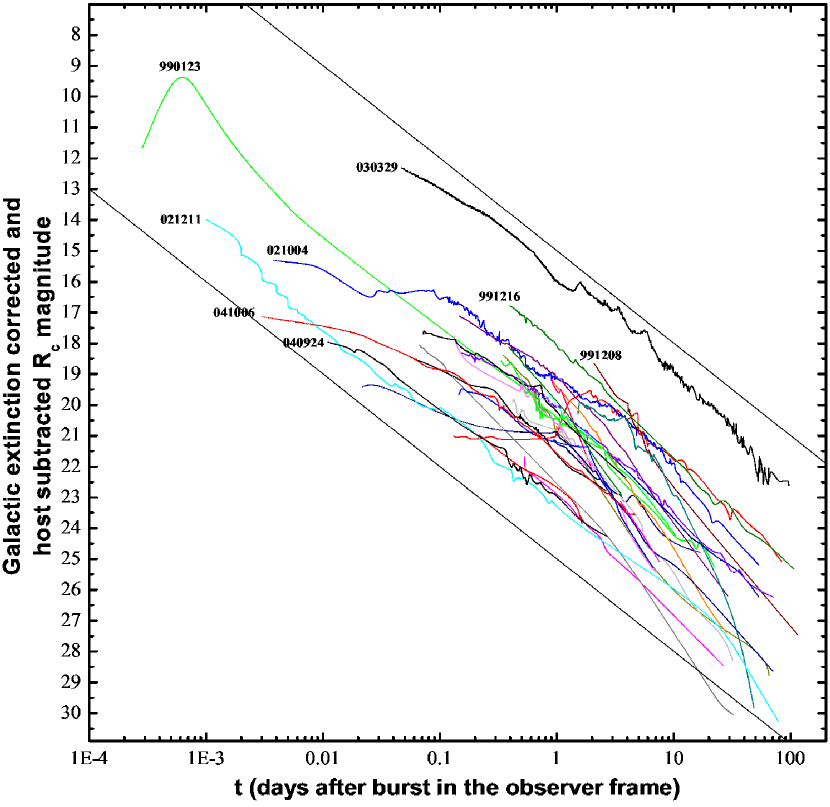
At first, in Figure 7, we show the -band light curves of all 30 afterglows of the SED sample (Table 1) plotted with smoothed splines connecting the data points to guide the eye (for reasons of clarity, error bars on the photometry have been omitted). The data have been corrected for Galactic extinction and host contribution. For the light curve of GRB 030329, the supernova contribution has also been subtracted, using the data from Zeh, Klose, & Hartmann (2005). A very large spread of magnitudes is seen, the range at one day after the trigger is 7.5 magnitudes between the afterglows of GRB 021211 and GRB 030329. Further bright afterglows are those of GRB 991208 and GRB 991216, other faint afterglows are GRB 040924, GRB 030227 and GRB 971214.
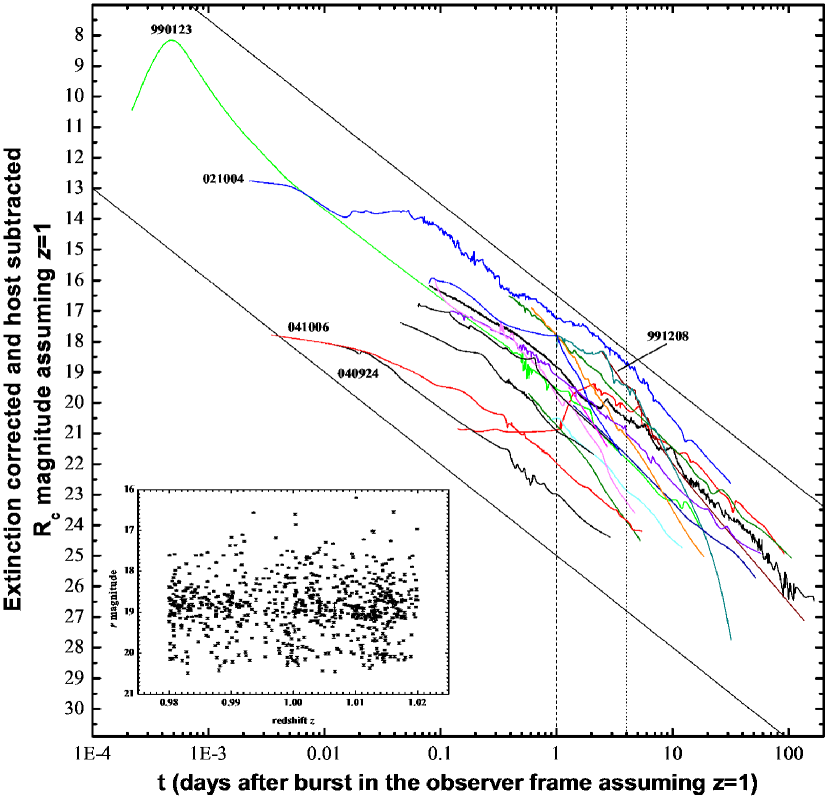
Figure 8 displays the afterglow light curves of the Golden Sample (Table 2) after applying the cosmological -correction (the second term of eq. A5) (Table 4) and after the time shifting to a common redshift of (the first term of eq. A5). In other words, Figure 8 is a measure of the absolute band magnitudes of the afterglows up to a constant. Compared to Figure 7 the magnitude range has decreased, now being 5.7 magnitudes at one day after the burst. Nine of the 16 afterglows that have data one day after the burst lie in a range only two magnitudes wide, approximately clustered around the afterglow of GRB 030329. In other words, this afterglow is now seen to be quite typical. The two afterglows above this range are those of GRB 021004 and GRB 991208 (assuming for the latter burst an extrapolation of the decay with to one day after the burst in the host rest frame, Paper II). The six afterglows beneath this range are GRB 030226, GRB 020405, GRB 030328, GRB 011121, GRB 041006 and GRB 040924. Of these six afterglows, only two (GRB 030226 and GRB 030328) lie at . GRB 021004 is the most luminous afterglow at all times, although it is possible that the afterglow of GRB 991208 was brighter at earlier times when it was not yet discovered (Castro-Tirado et al., 2001)444We note that both Nardini et al. (2005) and Liang & Zhang (2005) have reached similar conclusions using host galaxy extinction values derived from the literature..
Knowledge of the unextinguished light curves allows us to determine the luminosity distribution of our afterglow sample. Based on Fig. 8 we derive the band magnitudes at one and four days (corresponding to half a day and two days after the burst in the host frame at =1) and transform them into absolute magnitudes . We do not extrapolate the afterglow light curves, except for GRB 030429 and GRB 020813, which both have their final data points close to 4 days and are post-break. Thus, not all light curves are included (e.g., GRB 991208 is not yet detected at one day, GRB 030328 is not detected any more at four days if at ). The sample then contains 16 GRBs at both one day and at four days, the results are given in Table 5. Thereby, we computed the luminosity errors in a conservative fashion. Given that the errors of and are correlated (the result is coupled to and the other way around), we calculate three values of for the pairs , , and . The pair results in a lower luminosity, and the pair in a higher luminosity. The difference between these luminosities and the luminosity derived from the pair () is a conservative upper limit for the error of . In addition, we impose limits and . If or , we set or , respectively, when computing .
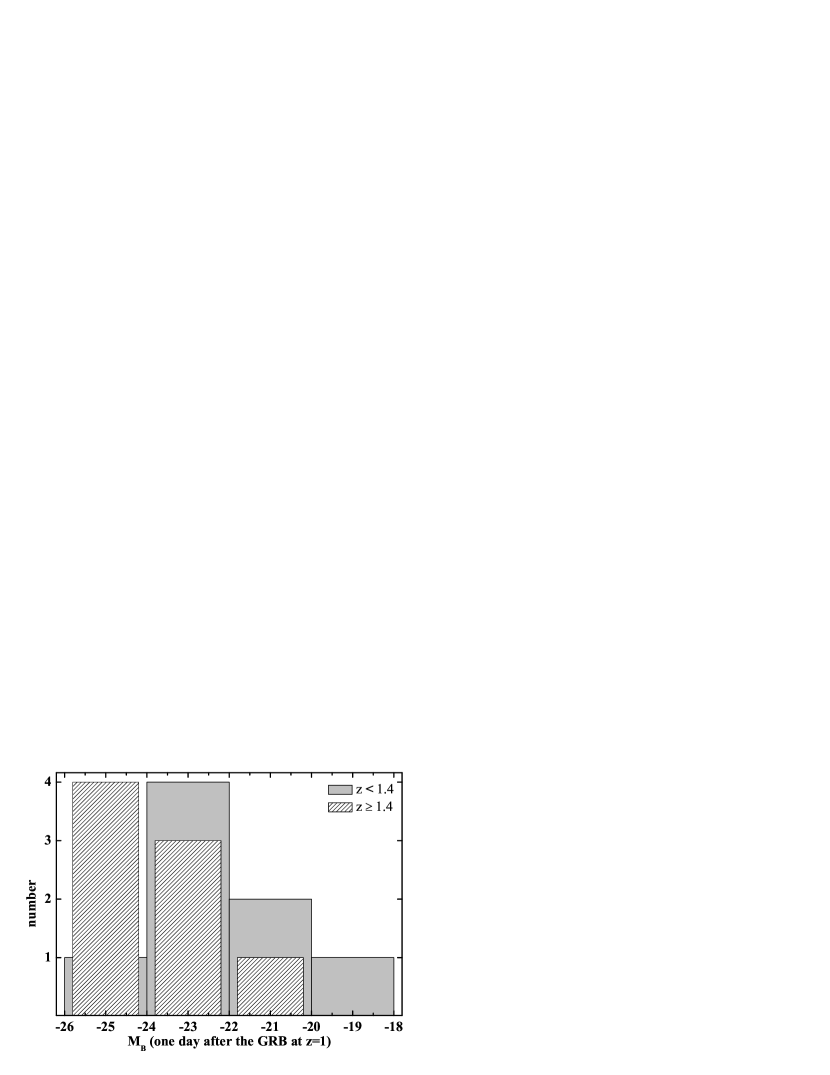
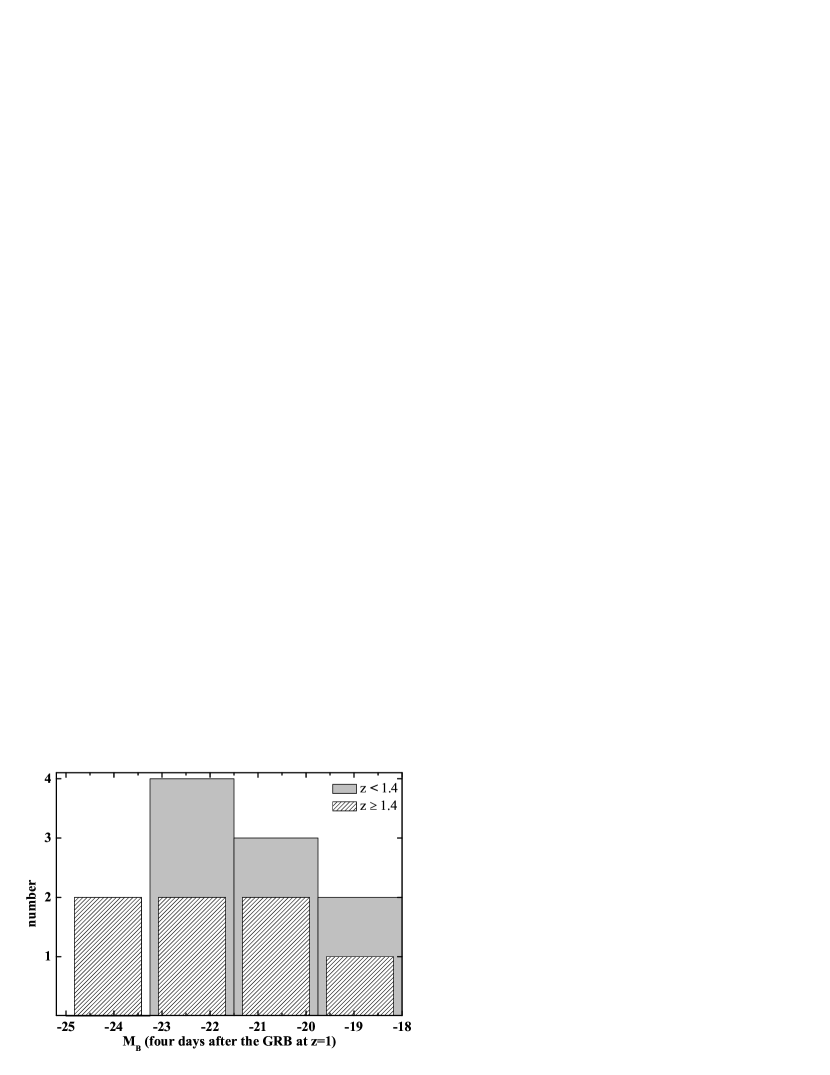
The resulting luminosity distributions are given in Figures 9 and 10. In addition, in order to search for a potential evolutionary effect or an observational bias, we distinguish GRBs with and , this being the median of the redshift distribution of our sample. A bimodal distribution of the afterglow luminosities is evident in Figures 11 and 12. Afterglows at tend to be less luminous, which might be explainable by an observational bias: the chances to detect intrinsically faint afterglows are higher for a lower .
At one day after the GRB at , the complete distribution has a two peaks, the mean lying at , with the most luminous afterglow, GRB 021004, having , and the faintest, GRB 040924, having . The means for the distributions of the and GRBs are and , respectively. The difference between the mean values is mag, indicating a bimodality.
At four days after the burst at , a single broad peak remains, for the complete distribution, the mean value is . Now, the brightest afterglow (GRB 021004) has and the faintest afterglow (GRB 041006) has . Once again, the bimodal distribution for nearby () and distant () GRB afterglows is evident. The means for the distributions of the and GRBs are and , respectively. The difference between the mean values is mag, the significance of the bimodality has been strongly reduced.
Gendre & Boër (2005) analysed the X-ray afterglow light curves of GRBs and shifted them to in an analog process, finding a bimodal flux distribution. There are eight GRBs in their sample (GRB 970508, GRB 990123, GRB 991216, GRB 000926, GRB 010222, GRB 011121, GRB 030226, and GRB 030329) that are also among the afterglows we have plotted in Figure 8. GRB 990123, GRB 991216, GRB 000926, and GRB 010222 are in group I of Gendre & Boër (2005), while GRB 970508, GRB 011121, GRB 030226, and GRB 030329 are in their group II. We note that for , day lies at the end of the initial plateau phase of the light curve of GRB 970508. The afterglow brightens by 1.5 magnitudes shortly afterward. A comparison reveals that while the two groups mix in the optical (the afterglow of GRB 030329 being more luminous than those of GRB 990123 and GRB 010222 at one day after the burst at ), the mean absolute magnitude of group I afterglows is , while it is for group II afterglows, with the difference being mag. While this finding is intriguing, the sample is too small to draw any conclusions.
Knowledge of the extinction corrected afterglow magnitudes allows us to compare the luminosities of the afterglows at a common point in the evolution of the jet, the jet break time. Ignoring any fine structure in the light curves, for all bursts in our Golden Sample with a jet break (Paper II) we computed the apparent -band afterglow magnitudes at the time of the jet break from the Beuermann equation (Beuermann et al., 1999). We included the fit around the jet break of GRB 030329 but excluded GRB 021004, as the reality of the late break we found in Paper II is unclear due to the many rebrightening episodes. These magnitudes were then converted to luminosities and normalized to the luminosity of the afterglow of GRB 990123 at the time of its jet break.
We use these luminosity ratios to search for correlations between afterglow luminosity and parameters of the prompt emission of the GRBs. We take the isotropic energy release and the source frame peak energy from Friedman & Bloom (2005), and the collimation corrected energies from Paper II. We do not find any correlations between the afterglow luminosity during the break time and these three parameters, with the absolute value of the correlation coefficient being smaller than 0.25 in all cases.
4 SUMMARY & CONCLUSIONS
We have presented a sample of 30 GRB afterglow spectral energy distributions in the optical/NIR bands which have been modeled with various dust extinction curves (Milky Way, Large Magellanic Cloud and Small Magellanic Cloud) to derive the source frame extinction, , intrinsic to the host galaxies and the spectral slope, , of the afterglows unaffected by any dust extinction. As all afterglows have been analyzed in a systematic way, the results are fully comparable, making this sample unique in terms of both size and consistency. For the further statistical study, we selected 19 afterglows, our Golden Sample, which have physically reasonable results and small error bars.
The preferred dust models we find (§ 3.1) as well as the deduced source frame dust-to-gas ratios (§ 3.5) based on the inclusion of data taken from the literature, both indicate that the majority of GRBs we have investigated, covering the redshift range from 0.1 to 4.5, occur in low-metallicity environments. The distribution that we have derived from these data (§ 3.2) highlights a sparsity of strongly extinguished afterglows, creating a Dark Burst Desert, even though it is unclear if the preference of low extinctions is more than an observational and sample selection bias. Our finding that most afterglows suffer from only low extinction in their hosts could indicate that afterglows are usually not obscured by dust close to the burster. One would then expect that the most extinguished afterglows are in fact located in globally dusty hosts. Indeed, we find weak evidence for a correlation between the submm flux of GRB host galaxies and the source frame extinction . Although the statistical significance is low due to the small sample size and the large errors, this finding calls for a more thorough investigation.
Knowledge of and allowed us then to correct the afterglow light curves for intrinsic extinction and to derive the true luminosity distribution of our afterglow sample at chosen times in the host galaxy frame (§ 3.6). We find that, on average, low- afterglows are less luminous than high- afterglows. The most likely explanation we have at hand for this finding is an observational bias against intrinsically faint afterglows at high redshifts. A bimodal distribution found by Gendre & Boër (2005) in similarly corrected X-ray afterglows is not clearly seen in the optical although, on average, GRBs with fainter X-ray afterglows also have fainter optical afterglows. Unfortunately, the available sample size is still too small to reach definite conclusions. A search for correlations between prompt emission parameters and the luminosity of the optical afterglows at jet break time has come up empty.
Since our sample is exclusively composed of GRBs from the pre-Swift era, a similar study in a few years time on Swift-discovered GRB afterglows will shed light on the Dark Burst Desert and the true afterglow luminosity distribution by removing observational bias factors via rapid and highly precise GRB localizations. Already, Swift has lead to the discovery of very faint afterglows (e.g. GRB 050126, GRB 050607, Berger et al., 2005a; Rhoads, 2005) including what may be the ”darkest” burst ever, GRB 050412 (Kosugi et al., 2005; Jakobsson et al., 2005a). The recent discovery of the first afterglows of short GRBs (Hjorth et al., 2005; Fox et al., 2005; Covino et al., 2005; Berger et al., 2005b; Soderberg & Berger, 2005) opens the possibility of finally making a comparison of the environment of the two different classes of GRBs.
Appendix A Shifting the afterglows to a common redshift
In the following, we consider the proper afterglow, i.e., cleaned from any underlying host component as well as corrected for Galactic extinction and extinction in the host galaxy. In cases where the late-time light curve is dominated by a supernova component, the data was removed due to a lack of knowledge concerning the supernova SED. We start with the expression for the flux density per unit frequency, , of a time-dependent source that is shifted to a redshift , which was originally observed at a redshift (Dado, Dar & de Rújula, 2002):
| (A1) |
Here, and are measured in the observers frame, is the luminosity distance. The exponential function corrects for a postulated extinction in the host galaxy at redshift , where is the optical depth in the host at the observed frequency.
When shifting an afterglow to a redshift , its apparent magnitude changes by an amount , with
| (A2) |
where is the wavelength-dependent filter response function for the given photometric band. For an unabsorbed afterglow
| (A3) |
We assume = const. Since the light curve shape can be affected by a jet break and by rebrightening episodes (which are achromatic according to our present data base), we do not specify . Using eq. (A3), it follows that in eq. (A1)
| (A4) |
with . Any extinction correction is included in in eq. (A1).
After transforming flux density per unit frequency into flux density per unit wavelength and inserting eqs. (A1, A3, A4) into eq. (A2), we obtain
| (A5) |
In a logarithmic plot (apparent magnitude vs. log time) the first term in eq. (A5) represents a shift of the observed light curve in time. The second term in eq. (A5) shifts the light curve along the magnitude axis; the light curve shape is not affected.
In our calculations we assumed a flat universe with matter density , cosmological constant , and Hubble Constant km s-1 Mpc-1 (Spergel et al., 2003). For we used the filter functions of the VLT/FORS1 Bessel filters (see http://www.eso.org/instruments/fors1/filters.html).
Appendix B Comparison with the literature
We have searched the literature for publications that also derive the source frame extinction toward the gamma-ray-bursts listed in Table 1. In most cases, these results are in good agreement with our findings.
GRB 970508 To our knowledge, Reichart (1998) was the first who discussed the extinction in a GRB host galaxy derived via a fit of the observed SED in the optical bands. Analysing collected data from the literature, he finds for GRB 970508 (albeit for a slightly higher , having left the redshift as a free parameter), concurrent with our result for the preferred MW dust extinction model.
GRB 971214 Halpern et al. (1998) find a strong spectral curvature in their data and infer a large for an assumed redshift of . As a fixed value for the spectral slope, they took the color of the afterglow of GRB 970508. This strong spectral curvature is mirrored in our SED fit which finds a large extinction and . Fits with a fixed derived from the - relations (Zhang & Mészáros, 2004) are strongly rejected.
GRB 980519 We have found no references to intrinsic extinction in the literature. This makes our preferred SMC dust result of , derived under the assumption of a redshift of , a novel result.
GRB 980703 This burst has the highest extinction in our sample (Table 1). This result is not unprecedented, however. While finding different values, several authors reported on a high extinction at different times after the burst: Castro-Tirado et al. (1999) find 0.9 days post-burst, Vreeswijk et al. (1999) find at 1.2 days, and Bloom et al. (1998) derive at 5.3 days. Our achromatic fit gives for the MW dust model, close to the result from Castro-Tirado et al. (1999), while SMC dust gives . The light curves are not sampled well enough to check if the discrepancies between the various authors are the result of chromatic changes of the SED, a bumpy structure, or a true decrease of line-of-sight extinction with time.
GRB 990123 Galama et al. (1999) find a negative extinction for this burst and therefore fix it to zero, consistent with the low value we derive: for the preferred SMC dust model. On the other hand, Savaglio et al. (2003) derive a very high extinction of from metal column abundances. Given the high quality of the optical photometry, we can not reproduce such a high extinction.
GRB 990510 Both, Stanek et al. (1999) and Beuermann et al. (1999) find a slight curvature in the SED. Removing the -band data point, Stanek et al. (1999) find , comparable to our result, for SMC dust. Neither publication fits the SED with a dust model to derive the host extinction.
GRB 991208 Almost all data on this afterglow (in ) is from Castro-Tirado et al. (2001). They do not discuss intrinsic extinction in the host galaxy. Together with additional -band data from Bloom et al. (1999) and Chary et al. (2002), we find a high extinction of for MW dust, the weakly preferred model, and an excellent fit (/dof=0.20).
GRB 991216 After correcting for significant Galactic foreground extinction, both Garnavich et al. (2000) and Halpern et al. (2000) find a SED well approximated by a power-law, concurrent with no dust reddening, although these authors do not discuss intrinsic reddening. With a larger database and more colors, we find for the weakly preferred MW dust, still a low value. This is consistent with the value that Vreeswijk et al. (2005) find from a low-resolution spectrum. They also detect a broad absorption feature centered at 2360 Å, which can be interpreted as a redshifted 2715 Å bump, giving credence to our choice of MW dust as the preferred model.
GRB 000131 For an SMC dust model, Andersen et al. (2000) find . We are not able to perform a free fit as the SED has only three colors ( and are affected by Lyman dampening), but fitting a straight power-law shows the SED is consistent with no extinction (i.e., no SED curvature is seen).
GRB 000301C Jensen et al. (2001) find very low host extinction () for this burst using an SMC dust curve, and no solution for MW and LMC dust. Rhoads & Fruchter (2001) derive a best fit result of for SMC dust, find a slightly worse fit for LMC dust and a much worse fit for MW dust. We also find negative extinction for MW dust, and also low values for LMC and SMC dust ( for SMC dust), completely in concordance with the results of the other authors.
GRB 000911 Comparing their host galaxy SED with synthetic spectra of extinguished galaxies, Masetti et al. (2005) find for SMC dust, consistent with our result of . The LMC result ( compared to ) is also in agreement.
GRB 000926 For SMC dust, we find , in good agreement with Fynbo et al. (2001b) who find for SMC dust. Several other analyses (Price et al., 2001; Sagar et al., 2001) disagree more with our results, but Fynbo et al. (2001b) employ a spectral energy distribution as we do, while the other studies have shorter baselines. Based on metal column abundances from high-resolution spectra, Savaglio et al. (2003) find a large , which we can not confirm via the broad band photometry.
GRB 010222 Working with five-color SDSS photometry, Lee et al. (2001) find low extinction ( for fixed) for this burst with an SMC dust curve, which is less than what we derive ( for and SMC dust). Our result is consistent with that of Galama et al. (2003), who find . Savaglio et al. (2003) find a higher extinction of based on metal column abundances.
GRB 010921 Not finding a supernova bump in this nearby GRB, Price et al. (2003) invoke . While Zeh, Klose, & Hartmann (2004) do find a weak SN bump and we derive the SED from this fit, we also find significant extinction of for MW dust, the preferred model, thus validating the analysis in Price et al. (2003).
GRB 011121 Price et al. (2002) deduce a Galactic visual extinction of along the line of sight by fitting the uncorrected data points with a MW extinction law at , which translates into a Galactic , assuming 3.1. They could not constrain the host extinction, however. Garnavich et al. (2003) find a Galactic and a spectral slope of between about 0.4 and 1.5 days after the burst; a possible extinction in the host galaxy is not considered. Greiner et al. (2003) adopt based on the COBE data (Schlegel, Finkbeiner & Davis, 1998), find no evidence for host extinction, and at 2.5 days after the burst. They note, however, that the HI maps of Dickey & Lockman (1990) favor a lower Galactic extinction of mag, i.e. (assuming 3.1). We refitted the combined data set taken from Greiner et al. (2003), adding carefully selected (early and HST data) data from Garnavich et al. (2003) and Price et al. (2002). In addition, we have now used deduced via the HI data (Dickey & Lockman, 1990), in order to overcome the potential mixture of an unknown source frame extinction and an uncertain Galactic extinction along the line of sight. We omitted the -band data (Greiner et al., 2003), however, since they worsen the fit. In doing so, we now derive a moderate host extinction of mag (SMC dust). The MW dust model is not preferred, although the low redshift of the GRB makes a differentiation among the three dust models hard.
GRB 011211 Both Holland et al. (2002) and Jakobsson et al. (2003) find very low extinction for this burst. Jakobsson et al. (2003) rule out MW dust and find that SMC dust gives the best fit with . Our result is that MW dust is ruled out, LMC dust gives a low with a very bad fit, and SMC dust gives a moderate but with . Thus the results are comparable in principle.
GRB 020124 Hjorth et al. (2003b) find by fixing for SMC dust, deeming unrealistic. Their SED is consistent with ours, showing a strong curvature. They additionally employ a synthetic -band point derived from extrapolating the spectrum and find from a free fit of SMC dust, still higher than what we derive (excluding the band, as it is affected by Lyman dampening), although the results are identical within the large errors. Berger et al. (2002) find to 0.9.
GRB 020405 Working with almost the same data set as we do, and including X-ray observations, Masetti et al. (2003) find negligible (though unspecified) dust extinction in this afterglow. On the other hand, Stratta et al. (2005), comparing the X-ray and the optical brightness, invoke a gray extinction curve with a very high . We find moderate extinction for all three dust models.
GRB 020813 Savaglio & Fall (2004) performed a very stringent analysis of an early high-resolution spectrum of this afterglow and, via analysis of metal column densities, derive , and for MW, LMC, and SMC dust, respectively. Our analysis gives a very good match, with definite results: , and , respectively. Furthermore, we also come to the conclusion that SMC dust is the preferred model. To make their unextincted spectral slope more compatible with standard models, Li et al. (2003) invoke (which converts to ). Covino et al. (2003) deduce , but for the Galactic extinction curve of Cardelli, Clayton & Mathis (1989).
GRB 021004 For an SMC dust curve, Holland et al. (2003) derive , coupled with . This work finds a lower coupled with a higher . This is for the free fit, a wind model with the cooling break blueward of the optical gives fixed and , which is comparable. Fitting an SED derived on October 11.67, Fynbo et al. (2005) find exactly this result () for SMC dust, associated with . They find higher extinction for LMC dust and a worse fit, and negative extinction for MW dust, just as we do.
GRB 021211 Fox et al. (2003) derive extinction values for this GRB by fixing . As our light curve fitting finds a very blue afterglow with (i.e., almost flat), these values can not be compared adequately. Fox et al. (2003) find up to , while we only derive small negative extinction for all dust models. Since these authors have derived their spectral slope from an early color, this may imply color evolution (cf. Nysewander et al., 2005). Holland et al. (2004) derive an unextincted slope of at 0.87 days after the burst in the observer frame and an upper limit on the source frame extinction of .
GRB 030226 Klose et al. (2004) find negligible extinction for this afterglow based on their multicolor data set, in contrast to Pandey et al. (2004) who, on theoretical grounds, argue for a fixed and thus derive small extinction from their . We utilize both data sets, and find a result concurrent with Klose et al. (2004), MW and LMC dust are ruled out, and the reddening using SMC dust () is negligible within errors.
GRB 030227 Castro-Tirado et al. (2003) were not able to conclusively fit their SED. Their is in perfect agreement with the result we find, . While the data set is sparse, it is, with the exception of one data point, from Castro-Tirado et al. (2003) exclusively. The steep supports dust reddening, and the unextinguished , a reasonable value, further supports our findings of , which could explain the faintness of this not too distant (, Watson et al., 2003) afterglow. The sparse data points of the SED and their large errors lead to very large errors in and , however.
GRB 030323 The SED of this burst is unusual. The band can not be included due to Lyman dampening, and the spectrum (a strong DLA) shows that the band is also unreliable. With the exception of the band, the SED shows a strong curvature without being very steep. As there is no reason to remove the band point (based on three photometric points, and not two each as in and ), we tried to fit the SED with it (removing it results in very good fits that have ). As the data points have small errors, the result is a very bad fit ( for two degrees of freedom). Vreeswijk et al. (2004) do not fit the light curves, but analyse the SED at different post-burst times from observations at near-identical epochs. They fix , derived from the - relations. Using this value, they find , and for MW, LMC and SMC dust curves, respectively. Fixing to this value and fitting our SED yields , and for MW, LMC and SMC dust curves, respectively. While these values are higher than those in Vreeswijk et al. (2004), they are comparable if conservative errors are assumed. However, the -band data is a strong outlier in these fits.
GRB 030328 After Paper II went into press, Maiorano et al. (2006) presented a large amount of data on this burst that was not available to us before. We refitted the optical light curves and derive the following parameters which supersede those presented in Table 1 of Paper II: (1.34 in Paper II), dof = 81 (18 in Paper II), mag ( in Paper II), ( in Paper II), ( in Paper II), days after the burst ( in Paper II), (fixed to 10 in Paper II). The host galaxy magnitude remains unchanged. (See Paper II for the definitions of these values.) These changes do not influence the conclusions of Paper II. We note that the value for the break smoothness parameter is fully in agreement with the possible correlation between and (Figure 8 of Paper II), and is almost identical to the value pair derived for GRB 010222.
From the Fe II column density derived from the optical spectrum, Maiorano et al. (2006) estimate mag, in agreement with our result mag.
GRB 030329 The SED of this burst was derived in an alternate way compared to all other SEDs. The rebrightening episodes starting at one day are found to be achromatic over several days. The high data quality makes it possible to shift the light curves to a common magnitude, the amount of shift is used to construct the SED, assuming conservative errors. This method is independent of the light curve fit, which is very complicated in the case of GRB 030329 (cf. Paper II). Bloom et al. (2004) find , coupled with , for MW dust. Our result is: , coupled with , which is comparable within errors. For fixed, Bloom et al. (2004) derive , comparable to which we derive when fixing at this value.
GRB 030429 Jakobsson et al. (2004a) rule out MW dust (as do we) and find for SMC dust at 0.548 days after the burst, slightly lower than our value of . They also find higher extinction for LMC dust, but the fit is much worse, contrary in part to our result. We find much lower source frame extinction for LMC dust, but here also the quality of the fit is bad.
XRF 030723 Fynbo et al. (2004) give for SMC dust and , completely concurrent with our result of for SMC dust and under the assumption of a redshift of .
GRB 040924 Silvey et al. (2004) use their own data and data from the GCN archives to derive , slightly lower than the value we find (). They do not fit the SED with a dust model. Soderberg et al. (2006) derive and argue that for the standard blastwave model, and thus mag. This is in agreement with our result mag.
GRB 041006 Soderberg et al. (2006) find and, to keep , assume negligible host galaxy extinction. This is in agreement with our result , but we note that the shape of the SED is indicative of a slight amount of dust. The derived and the shallow post-break light curve decay slope (Paper II) are both indicative of a hard electron spectrum with .
References
- Achterberg et al. (2001) Achterberg, A., Gallant, Y. A., Kirk, J. G., & Guthmann, A. W. 2001, MNRAS, 328, 393
- Akerlof et al. (1999) Akerlof, C., et al. 1999, Nature, 398, 400
- Amati et al. (2002) Amati, L., et al. 2002, A&A, 390, 81
- Andersen et al. (2000) Andersen, M. I., et al. 2000, A&A, 364, L54
- Ballantyne et al. (2002) Ballantyne, D. R., et al. 2002, A&A, 389, L74
- Berger et al. (2001a) Berger, E., et al. 2001a, ApJ, 556, 556
- Berger et al. (2001b) Berger, E., et al. 2001b, ApJ, 560, 652
- Berger et al. (2002) Berger, E., et al. 2002, ApJ, 581, 981
- Berger et al. (2003a) Berger, E., et al. 2003a, ApJ, 588, 99
- Berger et al. (2003b) Berger, E., et al. 2003b, Nature, 426, 154
- Berger et al. (2005a) Berger, E., et al. 2005a, ApJ, 629, 328
- Berger et al. (2005b) Berger, E., et al. 2005b, Nature, 438, 988
- Beuermann et al. (1999) Beuermann, K., et al. 1999, A&A, 352, L26
- Bloom et al. (1998) Bloom, J. S., et al. 1998, ApJ, 508, L21
- Bloom et al. (1999) Bloom, J. S., et al. 1999, Nature, 401, 453
- Bloom et al. (1999) Bloom, J. S., et al. 1999, GCN Circ. 480, http://gcn.gsfc.nasa.gov/gcn/gcn3/480.gcn3
- Bloom et al. (2003) Bloom, J. S., et al. 2004, ApJ, 572, L45
- Bloom et al. (2004) Bloom, J. S., et al. 2004, AJ, 127, 252
- Bohlin et al. (1978) Bohlin, R. C., et al. 1978, ApJ, 224, 132
- Bradley et al. (2005) Bradley, J., et al. 2005, Science, 307, 244
- Butler et al. (2005a) Butler, N. R., et al. 2005a, ApJ, 621, 884
- Butler et al. (2005b) Butler, N. R., et al. 2005b, ApJ, 629, 908
- Cardelli, Clayton & Mathis (1989) Cardelli, J. A., Clayton, G. C., & Mathis, J. S. 1989, ApJ, 345, 245
- Castro-Tirado et al. (1999) Castro-Tirado, A. J., et al. 1999, ApJ, 511, L85
- Castro-Tirado et al. (2001) Castro-Tirado, A. J., et al. 2001, A&A, 370, 398
- Castro-Tirado et al. (2003) Castro-Tirado, A. J., et al. 2003, A&A, 411, L315
- Chary et al. (2002) Chary, R., et al. 2002, ApJ, 566, 229
- Chevalier & Li (1999) Chevalier, R. A., & Li, Z.-Y. 1999, ApJ, 520, L29
- Covino et al. (2003) Covino, S., et al. 2003, A&A, 404, L5
- Covino et al. (2005) Covino, S., et al. 2005, A&A, in press (astro-ph/0509144)
- Dado, Dar & de Rújula (2002) Dado, S., Dar, A., & de Rújula, A. 2002, A&A, 388, 1079
- Della Valle et al. (2003) Della Valle, M., et al. 2003, A&A, 406, L33
- De Luca et al. (2005) De Luca, A., et al. 2005, A&A, 440, 85
- Dickey & Lockman (1990) Dickey & Lockman 1990, ARA&A, 28, 215
- Djorgovski et al. (2001) Djorgovski, S. G., et al. 2001, ApJ, 562, 654
- Draine (2000) Draine, B. T. 2000, ApJ, 532, 273
- Draine & Hao (2002) Draine, B. T., & Hao, L. 2002, ApJ, 569, 780
- Firmani et al. (2004) Firmani, C. et al. 2004, ApJ, 611, 1033
- Fitzpatrick & Massa (1986) Fitzpatrick, E. L., & Massa, D. 1986, ApJ, 307, 286
- Fox et al. (2003) Fox, D. W., et al. 2003, ApJ, 586, L5
- Fox et al. (2005) Fox, D. W., et al. 2005, Nature, 437, 845
- Frail et al. (2002) Frail, D. A., et al. 2002, ApJ, 565, 829
- Friedman & Bloom (2005) Friedman, A. S., & Bloom, J. S. 2005, ApJ, 627, 1
- Fruchter et al. (2001) Fruchter, A. 2001, GCN Circ. 1087, http://gcn.gsfc.nasa.gov/gcn/gcn3/1087.gcn3
- Fynbo et al. (2001a) Fynbo, J. P. U., et al. 2001a, A&A, 369, 373
- Fynbo et al. (2001b) Fynbo, J. P. U., et al. 2001b, A&A, 373, 796
- Fynbo et al. (2003) Fynbo, J. P. U., et al. 2003, A&A, 406, L63
- Fynbo et al. (2004) Fynbo, J. P. U., et al. 2004, ApJ, 609, 962
- Fynbo et al. (2005) Fynbo, J. P. U., et al. 2005, ApJ, 633, 317
- Galama & Wijers (2001) Galama, T. J., & Wijers, R. A. J. M. 2001, ApJ, 549, L209
- Galama et al. (1999) Galama, T. J., et al. 1999, Nature, 398, 394
- Galama et al. (2003) Galama, T. J., et al. 2003, ApJ, 587, 135
- Garnavich, Loeb, & Stanek (2000) Garnavich, P. M., Loeb, A., & Stanek, K. Z. 2000, ApJ, 544, L11
- Garnavich et al. (2000) Garnavich, P. M., et al. 2000, ApJ, 543, 61
- Garnavich et al. (2003) Garnavich, P. M., et al. 2003, ApJ, 582, 924
- Gendre & Boër (2005) Gendre, B., & Boër, M. 2005, A&A, 430, 465
- Greiner et al. (2003) Greiner, J., et al. 2003, ApJ, 599, 1223
- Groot et al. (1998) Groot, P. J., et al. 1998, ApJ, 493, L27
- Halpern et al. (1998) Halpern, J. P., et al. 1998, Nature, 393, 41
- Halpern et al. (2000) Halpern, J. P., et al. 2000, ApJ, 543, 697
- Hjorth et al. (2003a) Hjorth, J., et al. 2003, Nature, 423, 847
- Hjorth et al. (2003b) Hjorth, J., et al. 2003, ApJ, 597, 699
- Hjorth et al. (2005) Hjorth, J., et al. 2005, Nature, 437, 859
- Holland et al. (2002) Holland, S. T., et al. 2002, AJ, 124, 639
- Holland et al. (2003) Holland, S. T., et al. 2003, AJ, 125, 2291
- Holland et al. (2004) Holland, S. T., et al. 2004, AJ, 128, 1955
- Hopkins et al. (2004) Hopkins, P. F., et al. 2004, AJ, 128, 1112
- Jakobsson et al. (2003) Jakobsson, P., et al. 2003, A&A, 408, 941
- Jakobsson et al. (2004a) Jakobsson, P., et al. 2004a, A&A, 427, 785
- Jakobsson et al. (2004b) Jakobsson, P., et al. 2004b, ApJ, 617, L21
- Jakobsson et al. (2005a) Jakobsson, P., et al. 2005, ApJ, 629, 45
- Jakobsson et al. (2005b) Jakobsson, P., et al. 2005, MNRAS, 362, 245
- Jaunsen et al. (2001) Jaunsen, A. O., et al. 2001, ApJ, 546, 127
- Jaunsen et al. (2003) Jaunsen, A. O., et al. 2003, A&A, 402, 125
- Jensen et al. (2001) Jensen, B. L., et al. 2001, A&A, 370, 909
- Kennicutt (1998) Kennicutt, R. C., Jr. 1998, ApJ, 498, 541
- Kirk et al. (2000) Kirk, J. G., Guthmann, A. W., Gallant, Y. A., & Achterberg, A. 2000, ApJ, 542, 235
- Klose et al. (2000) Klose, S., et al. 2000, ApJ, 545, 271
- Klose et al. (2003) Klose, S., et al. 2003, ApJ, 592, 1025
- Klose et al. (2004) Klose, S., et al. 2004, AJ, 128, 1942
- Kosugi et al. (2005) Kosugi, G., et al. 2005, GCN Circ. 3263, http://gcn.gsfc.nasa.gov/gcn/gcn3/3263.gcn3
- Lazzati, Covino & Ghisellini (2002) Lazzati, D., Covino, S., & Ghisellini, G. 2002, MNRAS, 330, 583
- Le Floc’h et al. (2003) Le Floc’h, E., et al. 2003, A&A, 400, 499
- Lee et al. (2001) Lee, B. C., et al. 2001, ApJ, 561, 183
- Li et al. (2003) Li, W., et al. 2003, PASP, 115, 844
- Liang & Zhang (2005) Liang, E., & Zhang, B. 2005, ApJ, submitted (astro-ph/0508510)
- Lloyd-Ronning et al. (2002) Lloyd-Ronning, N. M., et al. 2002, ApJ, 574, 554
- MacFadyen & Woosley (1999) MacFadyen, A. I., & Woosley, S. E. 1999, ApJ, 524, 262
- Malesani et al. (2004) Malesani, D., et al. 2004, ApJ, 609, L5
- Maiolino et al. (2004) Maiolino, R., et al. 2004, Nature, 431, 533
- Maiorano et al. (2006) Maiorano, E., et al. 2006, A&A, submitted
- Masetti et al. (2000) Masetti, N., et al. 2000, A&A, 354, 473
- Masetti et al. (2003) Masetti, N., et al. 2003, A&A, 404, 465
- Masetti et al. (2005) Masetti, N., et al. 2005, A&A, 438, 841
- Mirabal et al. (2003) Mirabal, N., et al. 2003, ApJ, 587, 128
- Møller et al. (2002) Møller, P., et al. 2002, A&A, 396, L21
- Nardini et al. (2005) Nardini, M., et al. 2005, A&A, submitted (astro-ph/0508447)
- Nysewander et al. (2005) Nysewander, M. C., et al. 2005, ApJ, submitted (astro-ph/0505474)
- Owens et al. (1998) Owens, A., et al. 1998, A&A, 339, L37
- Paczyński (1998) Paczyński, B. 1998, ApJ, 494, L45
- Panaitescu & Kumar (2000) Panaitescu, A., & Kumar, P. 2000, ApJ, 543, 66
- (102) Panaitescu, A., & Kumar, P. 2001, ApJ, 556, 1002
- Panaitescu (2005) Panaitescu, A. 2005, MNRAS, 362, 921
- Pandey et al. (2004) Pandey, S. B., et al. 2004, A&A, 417, 919
- Pei (1992) Pei, Y. C. 1992, ApJ, 395, 130
- Perna, Lazzati & Fiore (2003) Perna, R., Lazzati, D. & Fiore, F. 2003, ApJ, 585, 775
- Piro et al. (2001) Piro, L., et al. 2001, ApJ, 558, 442
- Predehl & Schmitt (1995) Predehl, P., & Schmitt, J. H. M. M. 1995, A&A, 293, 889
- Price et al. (2001) Price, P. A., et al. 2001, ApJ, 549, L7
- Price et al. (2002) Price, P. A., et al. 2002, ApJ, 572, L51
- Price et al. (2003) Price, P. A., et al. 2003, ApJ, 584, 931
- Rau et al. (2004) Rau, A., et al. 2004, A&A, 427, 815
- Reichart (1998) Reichart, D. E. 1998, ApJ, 495, L99
- Rhoads (2005) Rhoads, J. E. 2005, GCN Circ. 3527, http://gcn.gsfc.nasa.gov/gcn/gcn3/3527.gcn3
- Rhoads & Fruchter (2001) Rhoads, J. E., & Fruchter, A. S. 2001, ApJ, 546, 117
- Rol et al. (2005) Rol, E., et al. 2005, ApJ, 624, 868
- Roming et al. (2005) Roming, P. W. A., et al. 2005, ApJ, submitted (astro-ph/0509273)
- Sagar et al. (2001) Sagar, R., et al. 2001, BASI 29, 1
- Sari, Piran & Halpern (1999) Sari, R., Piran, T., & Halpern, J. P. 1999, ApJ, 519, L17
- Sari, Piran & Narayan (1999) Sari, R., Piran, T., & Narayan, R. 1998, ApJ, 497, L17
- Savaglio & Fall (2004) Savaglio, S., & Fall, S. M. 2004, ApJ, 614, 293
- Savaglio et al. (2003) Savaglio, S., et al. 2003, ApJ, 585, 638
- Schlegel, Finkbeiner & Davis (1998) Schlegel, D. J., Finkbeiner, D. P., & Davis, M. 1998, ApJ, 500, 525
- Schneider et al. (2005) Schneider, D. P., et al. 2005, AJ, 130, 367
- Silvey et al. (2004) Silvey, J., et al. 2004, GCN Circ. 2833, http://gcn.gsfc.nasa.gov/gcn/gcn3/2833.gcn3
- Soderberg et al. (2005) Soderberg, A. M., et al. 2005, ApJ, 627, 877
- Soderberg et al. (2006) Soderberg, A. M., et al. 2006, ApJ, 636, 391
- Soderberg & Berger (2005) Soderberg, A. M., & Berger, E. 2005, GCN Circ. 4375, http://gcn.gsfc.nasa.gov/gcn/gcn3/4375.gcn3
- Spergel et al. (2003) Spergel, D. N., et al. 2003, ApJS, 148, 175
- Stanek et al. (1999) Stanek, K. Z., et al. 1999, ApJ, 522, L39
- Stanek et al. (2001) Stanek, K. Z., et al. 2003, ApJ, 563, 592
- Stanek et al. (2003) Stanek, K. Z., et al. 2003, ApJ, 591, L17
- Stratta et al. (2004) Stratta, G., et al. 2004, ApJ, 608, 846
- Stratta et al. (2005) Stratta, G., et al. 2005, A&A, 441, 83
- Tanvir et al. (2004) Tanvir, N., et al. 2004, MNRAS, 352, 1073
- Taylor et al. (2000) Taylor, G. B., et al. 2000, ApJ, 537, L17
- Tiengo et al. (2004) Tiengo, A., et al. 2004, A&A, 423, 861
- Vreeswijk et al. (1999) Vreeswijk, P. M., et al. 1999, ApJ, 523, 171
- Vreeswijk et al. (2004) Vreeswijk, P. M., et al. 2004, A&A, 419, 927
- Vreeswijk et al. (2005) Vreeswijk, P. M., et al. 2005, A&A, in press (astro-ph/0510404)
- Watson et al. (2003) Watson, D., et al. 2003, ApJ, 595, L29
- Waxman & Draine (2000) Waxman, E., & Draine, B. T. 2000, ApJ, 537, 796
- Weingartner & Draine (2001) Weingartner, J. C., & Draine, B. T. 2001, ApJ, 548, 296
- Woosley (1993) Woosley, S. E. 1993, ApJ, 405, 273
- Yost et al. (2002) Yost, S. A., et al. 2002, ApJ, 577, 155
- Yun & Carilli (2002) Yun, M. S., & Carilli, C. L. 2002, ApJ, 568, 88
- Zeh, Klose, & Hartmann (2004) Zeh, A., Klose, S., & Hartmann, D. H. 2004, ApJ, 609, 952 (Paper I)
- Zeh, Klose, & Hartmann (2005) Zeh, A., Klose, S., & Hartmann, D. H. 2005, in Proceedings of the 22nd Texas Symposium on Relativistic Astrophysics, ed. P. Chen, E. Bloom, G. Madejski (SLAC), & V. Patrosian (Stanford University), preprint (astro-ph/0503311)
- Zeh, Klose, & Kann (2005) Zeh, A., Klose, S., & Kann, D. A. 2006, ApJ, in press (astro-ph/0509299) (Paper II)
- Zhang & Mészáros (2004) Zhang, B., & Mészáros, P. 2004, Int.J.Mod.Phys. A19 (2004) 2385
| GRB | #aadenotes the corresponding number in the sample constructed in Paper II. | FiltersbbFilters that are not used for the fit (e.g, due to Lyman dampening) are not included. The degrees of freedom of the fit are always number of filters minus three, except for GRB 000131. | MW Dust | LMC Dust | SMC Dust | ||||||
|---|---|---|---|---|---|---|---|---|---|---|---|
| 970508 | 2.73 | 2.00 | 1.14 | ||||||||
| 971214 | 0.32 | 0.14 | 0.09 | ||||||||
| 980519ccFor GRB 980519 and XRF 030723, redshift estimates were employed (see § 2). | 1 | 0.61 | 0.73 | 0.01 | |||||||
| 980703 | 2.28 | 2.10 | 2.33 | ||||||||
| 990123 | 2 | 0.21 | 0.35 | 0.20 | |||||||
| 990510 | 3 | 0.03 | 0.01 | 0.58 | |||||||
| 991208 | 0.20 | 0.17 | 0.26 | ||||||||
| 991216 | 4 | 0.12 | 0.16 | 0.29 | |||||||
| 000131ddWith only three viable colors, GRB 000131 could not be fit with three free parameters. The fit was performed without extinction. No dust preference can be derived. The fit has one degree of freedom. | 0.01 | 0 | 0.01 | 0 | 0.01 | 0 | |||||
| 000301C | 5 | 2.48 | 2.03 | 1.14 | |||||||
| 000911 | 0.26 | 0.28 | 0.33 | ||||||||
| 000926 | 6 | 1.02 | 1.67 | 0.37 | |||||||
| 010222 | 7 | 1.35 | 1.36 | 0.58 | |||||||
| 010921 | 0.07 | 0.06 | 0.03 | ||||||||
| 011121 | 8 | 0.55 | 0.54 | 0.49 | |||||||
| 011211 | 9 | 2.03 | 7.12 | 1.89 | |||||||
| 020124 | 10 | 0.14 | 0.15 | 0.01 | |||||||
| 020405 | 11 | 1.82 | 1.75 | 1.75 | |||||||
| 020813 | 12 | 1.62 | 1.10 | 0.95 | |||||||
| 021004 | 1.62 | 1.57 | 0.69 | ||||||||
| 021211 | 1.16 | 1.13 | 1.05 | ||||||||
| 030226 | 13 | 0.15 | 0.57 | 0.32 | |||||||
| 030227 | 1.41 | 0.74 | 0.48 | ||||||||
| 030323 | 5.91 | 6.35 | 6.41 | ||||||||
| 030328 | 14 | 0.23 | 0.22 | 0.18 | |||||||
| 030329 | 0.10 | 0.09 | 0.06 | ||||||||
| 030429 | 15 | 2.60 | 7.72 | 1.79 | |||||||
| 030723ccFor GRB 980519 and XRF 030723, redshift estimates were employed (see § 2). | 0.16 | 0.15 | 0.19 | ||||||||
| 040924 | 0.10 | 0.10 | 0.09 | ||||||||
| 041006 | 16 | 0.06 | 0.05 | 0.05 | |||||||
| GRB | DustaaThis represents which dust model is used in the fit. Bold M and S mean a MW and SMC dust fit, respectively, with strong arguments favoring this fit. M and S mean a MW and SMC dust fit, respectively, with weak arguments favoring this fit. If no letter is given, then , and no conclusions can be drawn about the dust model. | |||
|---|---|---|---|---|
| 970508 | M | 2.73 | ||
| 990123 | S | 0.20 | ||
| 991208 | M | 0.20 | ||
| 991216 | M | 0.12 | ||
| 000131 | 0.01 | 0 | ||
| 000301C | S | 1.14 | ||
| 000911 | M | 0.26 | ||
| 000926 | S | 0.37 | ||
| 010222 | S | 0.58 | ||
| 011121 | S | 0.49 | ||
| 020405 | S | 1.75 | ||
| 020813 | S | 0.95 | ||
| 021004 | S | 0.69 | ||
| 030226 | S | 0.32 | ||
| 030328 | S | 0.18 | ||
| 030329 | S | 0.06 | ||
| 030429 | S | 1.79 | ||
| 040924 | S | 0.09 | ||
| 041006 | M | 0.06 |
| GRB | () | MethodaaMethod: X – via X-ray data; O – via Lyman (optical) | Reference |
|---|---|---|---|
| 970508 | 6 | X | Galama & Wijers (2001) |
| 990123 | 5.4 | X | Galama & Wijers (2001) |
| 991216 | 6.8 | X | Ballantyne et al. (2002) |
| 000301C | 1.6 | O | Jensen et al. (2001) |
| 000926 | 4 | X | Piro et al. (2001) |
| 010222 | 12 | X | Stratta et al. (2004) |
| 020405 | 4.7 | X | Mirabal et al. (2003) |
| 021004 | X | Møller et al. (2002) | |
| 030226 | 3.2 | X | Klose et al. (2004) |
| 030329bbThe value for GRB 030329 has been transformed into an upper limit. | X | Tiengo et al. (2004) | |
| 030429 | 4.0 | O | Jakobsson et al. (2004a) |
| 041006 | 3.2 | X | Butler et al. (2005b) |
| GRB | aa is the second term of Equation A5. | GRB | GRB | GRB | |||
|---|---|---|---|---|---|---|---|
| 970508 | 0.16 | 000301C | 2.09 | 020405 | 0.77 | 030329 | 3.87 |
| 990123 | 1.22 | 000911 | 0.49 | 020813 | 0.83 | 030429 | 3.56 |
| 991208 | 0.35 | 000926 | 2.36 | 021004 | 2.55 | 040924 | 0.12 |
| 991216 | 0.27 | 010222 | 1.32 | 030226 | 1.84 | 041006 | 0.64 |
| 000131 | 3.64 | 011121 | 2.08 | 030328 | 1.09 |
| GRB | GroupaaDenotes membership in group I or group II of Gendre & Boër (2005) | (at one daybbafter the GRB, assuming at =1) | (at four daysbbafter the GRB, assuming at =1) |
|---|---|---|---|
| 970508 | II | ||
| 990123 | I | ||
| 991208 | |||
| 991216 | I | ||
| 000131 | |||
| 000301C | |||
| 000911 | |||
| 000926 | I | ||
| 010222 | I | ||
| 011121 | II | ||
| 020405 | |||
| 020813 | |||
| 021004 | |||
| 030226 | II | ||
| 030328 | |||
| 030329 | II | ||
| 030429 | |||
| 040924 | |||
| 041006 |