Integral Field Spectroscopy of the core of Abell 2218
Abstract
We report on integral field spectrocopy observations, performed with the PPAK module of the PMAS spectrograph, covering a field-of-view of 74”64” centered on the core of the galaxy cluster Abell 2218. A total of 43 objects were detected, 27 of them galaxies at the redshift of the cluster. We deblended and extracted the integrated spectra of each of the objects in the field using an adapted version of galfit for 3D spectroscopy (galfit3d). We use these spectra, in combination with morphological parameters derived from deep HST/ACS images, to study the stellar population and evolution of galaxies in the core of this cluster.
1 Introduction
Galaxy clusters have been used for decades to study the evolution of galaxies. Being tracers of the largest density enhancements in the universe, clusters are considered the locations where galaxies formed first. It is known that they are dominated by old and large elliptical galaxies, with colors that are consistent with a bulk formation at high redshift followed by a passive evolution (e.g., zieg01 ). However, butc84 have shown an increase in the fraction of blue galaxies in clusters from low to intermediate redshift, which disagrees with that simple scenario. Furthermore, a fast morphological evolution from late to early-type galaxies, claimed as a possible solution, does not predict the observed fractions of S0 galaxies at low redshift. Other processes like gas-stripping and gravitational harassment have to be considered. These notions predict that galaxies at the core of clusters must have globally older stellar populations than galaxies in the outskirts of the cluster. Consequently, we should detect deviations from passive evolution in the scaling relations for early-type galaxies (e.g., the Fundamental Plane). In order to test this hypothesis we started a complete spectroscopic survey of the core of Abell 2218.
Abell 2218 is one of the richest clusters in the Abell catalogue abell89 , with a richness class 4. It has a redshift of 0.17, and a velocity dispersion of 1370 km s-1 kris78 ; borg92 . Detailed high-resolution X-ray maps mcha90 and mass-concentration studies based on the properties of the gravitationally lensed arcs have shown that the cluster contains two density peaks, the strongest of them dominated by a large cD galaxy. Several observational programs have produced a large dataset of well deblended slit spectra for the galaxies in the outer parts of this cluster zieg01 , and extensive multi-band, ground-based and HST imaging, e.g., acs . We focused our survey in the central arcmin region of the cluster, around the cD galaxy.
1.1 Observations and data reduction
Observations were carried out on 30/06/05 and 06/07/05 at the 3.5m telescope of the Calar Alto observatory with the PMAS roth05 spectrograph and its PPAK module kelz06 . The V300 grating was used, covering a wavelength range between 4687-8060 Å with a nominal resolution of 10 Å FWHM. The PPAK fiber bundle consists of 331 science fibers of 2.7” diameter, concentrated in a single hexagonal bundle covering a field-of-view of 72”64”. Following a dithered 3-pointing scheme, 3 hours of integration time was accumulated each night, 6 hours in total. In addition to our Integral Field Spectroscopy (IFS) data, we used a F850LP-band image of 11310s exposure time taken with the ACS camera on board the HST, obtained from the HST archive.
Data reduction was performed using R3Dsanc05 , in combination with IRAF packages and E3Dsanc04 . The reduction involved standard steps for fiber-based integral-field spectroscopy. First, science frames are bias subtracted. A continuum illuminated exposure, taken before the science exposures, is used to locate and trace the spectra on the CCD. Each spectrum is then extracted by coadding the flux within an aperture of 5 pixels. Wavelength and flux calibration are performed using an arc lamp and standard calibration star exposures, respectively. The three dithered exposures are then combined, and a datacube with 1”/pixel sampling is created for each night using E3D. Finally, the two datacubes are recentered and combined using IRAF tasks.
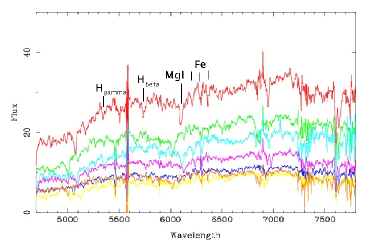
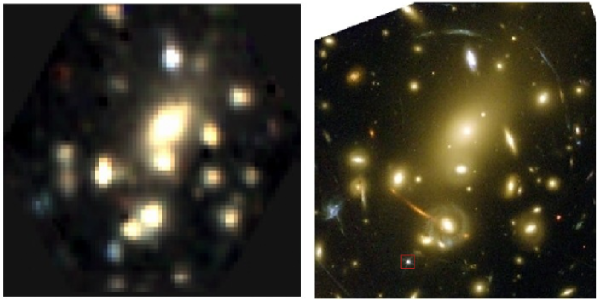
Figure 1 shows a three-color image created by coadding the flux of the final datacube through three broad-bands: , and -band (left panel), together with a similar image created using HST observations (right panel)acs . It is interesting to note the similarities between the two images, despite the differences in sampling and resolution. As we quoted before, many galaxies are strongly blended. In particular, the central cD contaminates most of the galaxies in the field.
1.2 Galaxy detection and spectra extraction
In order to deblend and extract the integrated spectra of each individual galaxy in the field, we used a technique developed by ourselves sanc04a ; garc05 . The technique is an extension to IFS of galfit peng02 , that we named galfit3d. It entails a deblending of the spectrum of each object in the datacube by fitting analytical models. IFS data can be understood as a set of adjacents narrow-band images, each with the width of a spectral pixel. For each narrow-band image it is possible to apply modelling techniques developed for 2D imaging, like galfit, and extract the morphological and flux information for each object in the field at each wavelength. The spectra of all the objects are extracted after repeating the procedure for each narrow-band image throughout the datacube. We have already shown that the use of additional information to constrain the morphological parameters increases the quality of the recovered spectra garc05 . For that purpose we have used the F850LP-band image obtained with the HST/ACS camera.
First, we use SExtractor bert96 on the section of the F850LP-band image correponding to the field-of-view of our IFS data. For each detected galaxy we recover its position, integrated magnitude, scale length, position angle and ellipticity. These parameters were used as an initial guess to fit each of the galaxies in the F850LP-band image with a 2D Sérsic profile model, convolved with a PSF, using galfit. The PSF was obtained using a poststamp image of the star in the PPak field-of-view. The fit for each individual object was done in a sequential way, from the brightest to the faintest, masking all the remaining objects. After iterating over all the detected galaxies we obtain a final catalogue of their morphological parameters. Similar techniques are used to derive the morphological parameters of galaxies in different ACS imaging surveys rix04 ; coe06 .
The catalogue of detected galaxies in the F850LP-band image was cross-checked visually with a 2D image derived from the datacube by coadding the flux over the entire wavelength range (4687-8060 Å). A final catalogue of 41 objects (40 galaxies and 1 star) was created, excluding two detected arc-lenses. Once we derived the morphological parameters for each galaxy, we extracted their integrated spectra by modelling each galaxy in the datacube with galfit3d. We use the same model used for the F850LP-band image, with the morphological parameters fixed, and fitting only the flux at each wavelength. The fit was performed again in a sequential way, from the brightest to the faintest, masking all the objects but the fitted one. In each iteration we used as input the residual datacube of the previous iteration, “cleaning” each object one-by-one. We finally got a spectrum for each of the 40 galaxies in the field-of-view.
1.3 Analysis and Results
Figure 2, shows a few examples of the extracted spectra. Different absorption features are detected in each spectrum, including some that are sensitive to age and metallicity (e.g., H and MgI). A few spectra show clear gaseous emission lines (e.g., H, [OIII] and H). We derive redshifts for 28 of the 40 galaxies by comparing the observed wavelength of the absorption (or emission) features with the restframe values. Of those, 27 galaxies are at a redshift around , the nominal redshift of the cluster, and another one at . The signal-to-noise of the remaining 12 spectra is too low to unambiguously identify spectral features. We derived the age and metallicity of the galaxies by fitting each spectrum with single stellar population synthetic models, created using the GISSEL code bc04 .
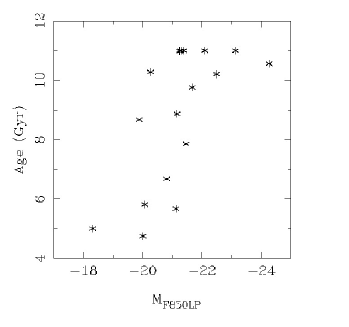
Figure 3 shows a preliminary result obtained from the combination of parameters derived from the fitting procedure and the morphological analysis. It shows the luminosity-weighted age versus the F850LP-band absolute magnitude for the 17 galaxies for which we have completed the analysis. There is a large spread of ages in the stellar populations of the galaxies in the core of Abell 2218, contrary to the expectations from a single bulk formation and a passive evolution. Furthermore, the brightest (and more massive) galaxies are older than the fainter (and less massive) ones, which show a larger spread in ages. This may indicate that the smaller, less massive galaxies have formed later, being captured by the cluster, and/or they have enjoyed more recent periods of star formation. These results illustrate that the evolution of stellar populations in galaxies in clusters is far from passive, even in the central core.
References
- (1) Smail, I., Kuntschner, H., Kodama, T., et al. 2001, MNRAS, 323, 839
- (2) Abell, G. O., Corwin, H. G., & Olowin, R. P. 1989, ApJS, 70, 1
- (3) Bertin, E., & Arnouts, S., 1996, AAS, 117, 393
- (4) Bruzual, G., & Charlot, S., 2003, MNRAS, 344, 1000
- (5) Butcher, H., Oemler, A., 1984, ApJ, 285, 426
- (6) Coe, D., Benitez, N., Sánchez, S.F., et al., 2006, ApJ, submitted
- (7) Kelz, A., Verheijen, M.A.W., Roth, M.M. et al., 2006, PASP, in press
- (8) Kristian, J., Sandage, A., & Westphal, J.A., 1978, ApJ, 221, 383
- (9) Le Borgne, J.F., Pelló, R., Sanahuja, B., 1992, A&AS, 85, 87
- (10) García-Lorenzo, B., Sánchez S.F., Mediavilla, E., et al., ApJ, 621, 146
- (11) McHardy, I.M., Stewart, G.C., Edge, A.C., et al. 1990, MNRAS, 242, 215
- (12) Peng, C.Y., Ho, L.C., Impey, C.D., Rix, H., 2002, AJ, 124, 266
- (13) Roth, M.M., Kelz, A., Fechner, T., et al., 2005, PASP, 117, 620
- (14) Sánchez S.F., 2004, AN, 325, 167
- (15) Sánchez S.F., García-Lorenzo, B., Mediavilla, E., et al., 2004, ApJ, 615, 156
- (16) Sánchez S.F. & N.Cardiel, Calar Alto Newsletter, num. 10
- (17) Rix, H., Barden, M., Beckwith S.V.W., et al., 2006, ApJS, 152, 163
- (18) Ziegler, B.L., Bower, R.G., Smail, I., et al., 2001, MNRAS, 325, 1571