The Oxygen Abundance of HE 13272326111Based on observations collected at the European Southern Observatory, Paranal, Chile (Proposal ID 075.D-0048).
Abstract
From a newly obtained VLT/UVES spectrum we have determined the oxygen abundance of HE 13272326, the most iron-poor star known to date. UV-OH lines yield a 1D LTE abundance of (subgiant case) and (dwarf case). Using a correction of 1.0 dex to account for 3D effects on OH line formation, the abundances are lowered to and , respectively, which we adopt. Without 3D corrections, the UV-OH based abundance would be in disagreement with the upper limits derived from the O I triplet lines: (subgiant) and (dwarf). We also correct the previously determined carbon and nitrogen abundances for 3D effects. Knowledge of the O abundance of HE 13272326 has implications for the interpretation of its abundance pattern. A large O abundance is in accordance with HE 13272326 being an early Population II star which formed from material chemically enriched by a first generation supernova. Our derived abundances, however, do not exclude other possibilities such as a Population III scenario.
1 INTRODUCTION
Frebel et al. (2005) recently reported the discovery of the dwarf or subgiant HE 13272326, the most iron-poor star known to date (with ). Abundances were derived for nine elements and upper limits for a further eight (Aoki et al. 2006), including oxygen (). No detection of molecular OH lines in the UV was possible from their Subaru/HDS spectrum. A new attempt is presented here to measure the oxygen abundance of HE 13272326 from different O indicators: UV-OH lines, the [O I] at 6300 Å and the O I triplet at 7774 Å, using a higher quality VLT/UVES spectrum. A measurement of the O abundance of HE 13272326 is desired for the investigation into the origin of the star.
As the third most common element in the Universe, O generally is an ideal tracer of its chemical history. Hence, it has been studied in extensive detail in metal-poor stars to unravel the earliest evolutionary phases of the Galaxy which is crucial for an understanding of the formation mechanism of the first generations of stars. It is not clear how the first low-mass stars could form in the early Universe. A possibility might involve the C and O yields from Population III supernova which act as sufficient cooling sources in star-forming gas clouds producing the first low-mass stars (e.g. Umeda & Nomoto 2003; Bromm & Loeb 2003). However, the picture which emerged from the observational studies is not free from inconsistencies, making the scientific interpretation difficult. A discrepancy of the O abundances derived from different O indicators poses a serious, not yet resolved, problem (for a recent discussion see Asplund 2005).
Our new observations of HE1327-2326 are presented in §2 and the O abundance measurements are described in §3. We discuss the implications in §4.
2 OBSERVATIONS AND DATA REDUCTION
Between March and May 2005, HE 13272326 was observed with the Ultraviolet-Visual Echelle Spectrograph (Dekker et al. 2000) at the Very Large Telescope, Chile. For the service mode observations we made use of the dichroic mode and three wavelength settings. The total exposure time of 18 h was divided into 18 one hour exposures with the BLUE 346 nm setting covering 3050–3870 Å, 15 simultaneous one hour exposures with the RED 580 nm setting covering 4780–6805 Å, and 3 simultaneous one hour exposures with the RED 760 nm setting covering 5720–9470 Å. A slit width was used in the blue arm of the spectrograph, yielding a resolving power of while a slit width was used in the red arm, yielding . All data have been reduced with the REDUCE package (Piskunov & Valenti 2002). Overlapping echelle orders were subsequently merged, and the resulting spectra rebinned to an appropriate sampling. A signal-to-noise of was estimated at Å. To ensure the detection of weak features, unmerged individual orders were used for their verification.
3 THE OXYGEN ABUNDANCE
3.1 The Model Atmosphere
We performed a 1D LTE abundance analysis of the newly acquired VLT/UVES spectrum. The latest version of the MARCS code222Numerous models for different stellar parameters and compositions are readily available at http://marcs.astro.uu.se (Gustafsson et al., in preparation) was used to compute a model tailored to the chemical abundances observed in HE 13272326 based on the subgiant abundances reported in Frebel et al. (2005). Furthermore, we adopted their effective temperature of T K as well as the two solutions for the surface gravity, (subgiant) and (dwarf). For more details and the derivation of the stellar parameters of HE 13272326, we refer the reader to Aoki et al. (2006). For the OH analysis we used the Gillis et al. (2001) line list. For the O I triplet lines we used data taken from the NIST database. The value for the resonance [O I] line was taken from Storey & Zeippen (2000).
To confirm the validity of our abundance determination technique we took a MARCS model with the stellar parameters matching those of the well-studied subgiant HD140283 (we adopt T K, , ; see Boesgaard et al. 1999 for details). We computed synthetic spectra with different O abundances to reproduce the Boesgaard et al. spectrum of HD140283 in the UV-OH line region around Å. From the comparison of the synthetic with the observed spectrum we derive an abundance of which is in good agreement with the results derived by Boesgaard et al. (1999) () using the solar abundance adopted by them. From the O triplet lines we derived which also agrees well with the Boesgaard et al. (1999) value ().
3.2 The 1D LTE Analysis
In our new spectrum we detect 12 Fe I lines in the UV spectral range. Seven of those have already been detected in the Subaru spectrum of our previous analysis (see Aoki et al. 2006 for more details). Our LTE metallicity derived from these lines is for both the subgiant and dwarf solution. Employing the same NLTE correction as in Frebel et al. (2005) results in an iron abundance for HE 13272326 in good agreement with the previously reported metallicity. Unfortunately it is not possible to detect any Fe II lines. Our upper limits are (subgiant) and (dwarf) which are significantly tighter than the previous values of and , respectively (Aoki et al. 2006).
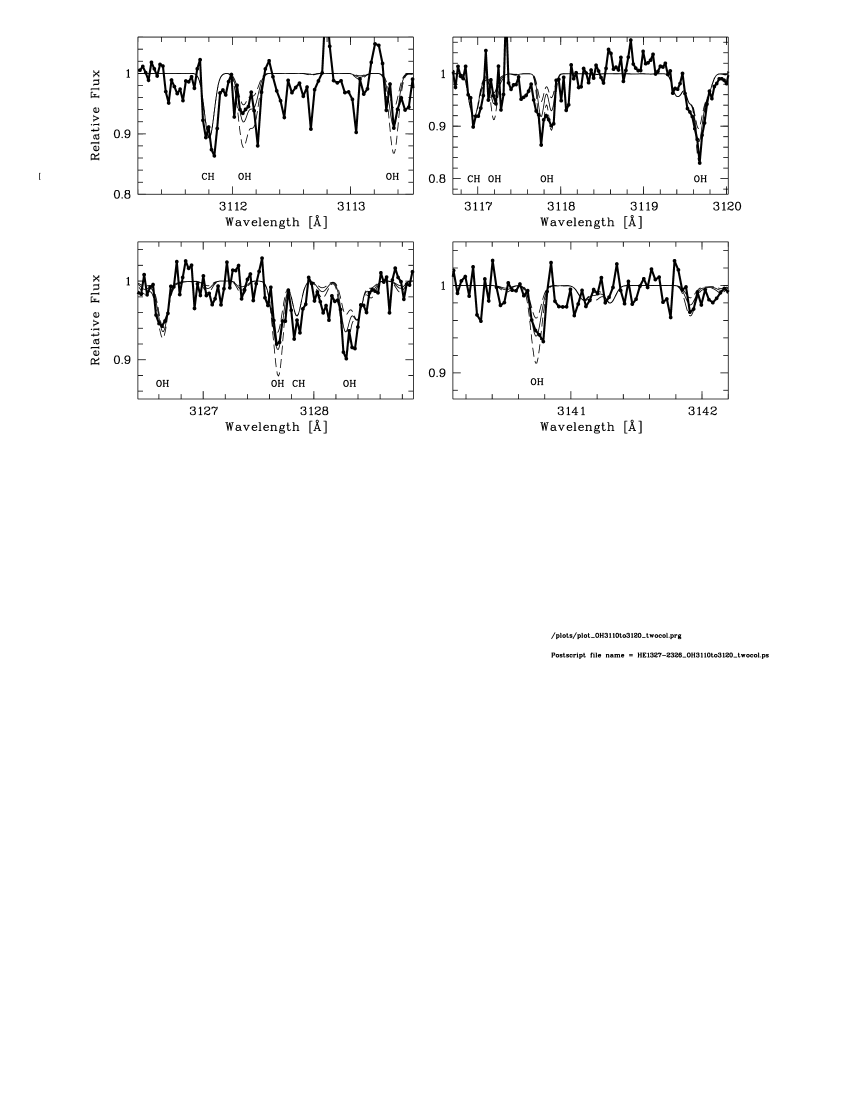
Molecular lines from the OH system in the ultraviolet range of our UVES spectrum are clearly detected. Examples are presented in Figure 1. A spectrum synthesis analysis of eight of the most prominent OH features between 3110 and 3142 Å was performed. We note that many CH lines are present over the entire UV spectral range. In this region, however, the strongest OH lines are visible and some are not strongly contaminated by CH features. Lines that are as free as possible from such contamination were used. The total number of OH features, however, is small and additionally they are in some instances very weak, so that this attempt was hampered in a few cases. To account for these contaminations we re-determined the C abundance from UV CH lines around Å (see Table 1). The newly derived values are consistent with our previous 1D LTE measurements presented in Frebel et al. (2005) and Aoki et al. (2006): (subgiant) and (dwarf) based on CH feature from the and system. A set of synthetic spectra was computed for a variety of O abundances with a C abundance set to our new value. Abundances were measured from several OH lines comparing the observed normalized spectrum with a set of synthetic spectra and minimizing the between the synthetic and observed spectrum. We adopt the average abundance as derived from the individual fits to the OH features as our final 1D LTE O abundance. The dispersion of the individual abundance measurements is 0.3 dex, and the standard error of the mean is 0.1 dex. However, systematic uncertainties could arise from continuum placement and, more significantly, from any error in the effective temperature and the gravity. Taking these uncertainties into account we estimate a total error of dex. Thus, (subgiant) and (dwarf) were adopted as the final averaged 1D LTE abundances. These values are consistent with the upper limit for O of reported in Frebel et al. (2005). For the solar O abundance we adopt (Asplund, Grevesse & Sauval 2005).
Considering the very high overabundance derived from the OH features one might anticipate a detection of the O I triplet lines at 7772, 7774 and 7775 Å. However, despite very high quality data ( at Å) none of the three lines was detected. Using the formula (where is the pixel width, the number of pixels across the line and per pixel; Bohlin et al. 1983) we calculate a upper limit ( mÅ) for the strongest triplet line (7772 Å). The abundance obtained from this equivalent width estimate is significantly lower than the abundance derived from OH (employing the 1D LTE analysis). Unfortunately, the upper limit (derived for a line strength limit Å) for the forbidden [O I] line at 6300 Å is quite large and therefore has little meaning. The abundances and upper limits can be found in Table 1.
3.3 Application of 3D and NLTE Corrections
From theoretical work which investigates beyond the “classical” 1D analysis it is known that the 1D LTE abundance derived from the OH features in metal-poor stars is significantly higher than the 3D counterpart (Asplund & García Pérez 2001). This is particularly the case for stars close to the turnoff. The O triplet lines in turn mostly suffer from 1D NLTE effects (e.g. Kiselman 1991). For forbidden lines (e.g. [O I]), the LTE assumption is valid and 3D LTE effects are expected to be relatively minor (Nissen et al. 2002). The observational discrepancy of O abundances derived from different indicators are eased with the application of such 3D and/or NLTE corrections (Asplund & García Pérez 2001). Unfortuntely, appropriate corrections are not always available. For the O I triplet lines we computed new NLTE corrections for HE 13272326 (without consideration of inelastic H collisions). The 1D NLTE abundance corrections are dex for both the subgiant and dwarf case. We note that 3D NLTE calculations for O I in metal-poor stars with parameters appropriate for HE 13272326 are not yet available but preliminary investigations for other halo stars reveal similar 3D NLTE effects as in 1D (Asplund 2005). See Table 1 for the corrected abundances.
Asplund & García Pérez (2001) investigated the difference of 3D LTE model compared to standard 1D LTE analysis using UV-OH lines. In their Table 2, they provide corrections for a small set of stars with different stellar parameters, one set of which is close to that of HE 13272326. For the two lines investigated the correction is dex for the abundance derived from the 3139.17 Å OH line and dex from the 3167.17 Å OH line. Since both lines are too weak to be detectable in HE 13272326, we simply adopt the average of the two corrections and apply a 1.0 dex 3D correction to our 1D LTE O abundance from OH. The abundances from UV-OH lines are thus lowered significantly and agree well with the upper limits derived from O triplet lines. NLTE effects on the abundance derived from the OH lines have not been studied in detail. We wish to caution here that since HE 13272326 has a much lower iron abundance than the 3D model from which we inferred the adopted 3D LTE corrections, it is possible that the real 3D correction might even be larger than the dex applied here. However, no calculations tailored for the specific abundances of HE 13272326 are currently available to further test this assumption.
The formation of molecular CH and NH features is likely to be very similar to those of OH. Asplund (2005) computed corrections for turnoff stars with of dex for the C abundance and dex for the N abundance. For completeness we thus apply the 3D corrections to the 1D abundances derived from CH and NH. See Table 1 for the 3D corrected abundances. However, any effects would tend to cancel out if the ratio of any of those elements is to be used. Similarly large 3D corrections have recently been computed (Collet, Asplund, & Trampedach 2005) for HE 01075240 (Christlieb et al. 2002).
4 DISCUSSION
4.1 Implications of a High Oxygen Abundance
In order to learn about the earliest stages of star formation in the Universe it is very important to identify the origin of the elements observed in HE 13272326. Oxygen is a key element in this quest because it provides strong constraints on the different origin scenarios previously invoked for the star. Of particular importance is whether HE 13272326 is an early Population II or a Population III star. Recently, Iwamoto et al. (2005) made an attempt to explain the abundance pattern of HE 13272326. They invoke a pre-enrichment scenario in which a faint Population III supernova undergoes a mixing and fallback process producing ejecta containing little iron and large amounts of CNO. Based on the 1D LTE abundances of HE 13272326 and constrained by the 1D LTE upper limit of oxygen (Frebel et al. 2005) they compute an O abundance of which is close to our 1D LTE abundance derived from OH lines. However, our adopted 3D abundance is significantly lower. It remains to be seen if their model could also reproduce our new CNO values since it might be difficult to simultaneously fit a lower O together with e.g. the high Mg abundance (potential 3D corrections for Mg are expected to be less severe than for OH).
Meynet, Ekström, & Maeder (2005) predict a similarly high oxygen abundance () based on their combined stellar wind and supernova ejecta of their rotating stellar models. This is in qualitative agreement with the observed excesses of O in HE 13272326 and other metal-poor stars.
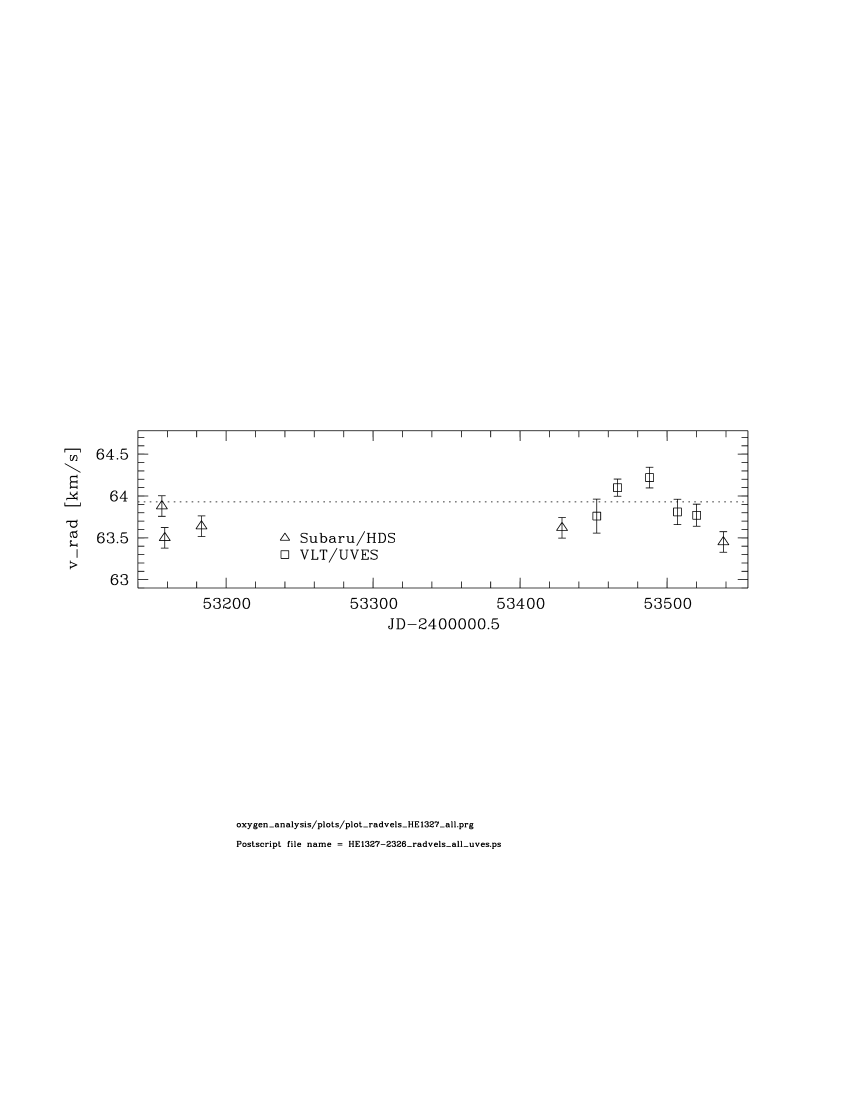
Following Suda et al. (2004), a Population III scenario might explain the origin of HE 13272326 in terms of a binary system. It would then have accreted its heavier elements from the interstellar medium and the lighter elements from an erstwhile AGB companion in a binary system. However, the absence of significant radial velocity variations (see Figure 2) over a period of just over one year does not support this idea. Within the overall error there is no change to report in the radial velocity so far. The slight offset between the Subaru and UVES data points in Figure 2 can be accounted to uncertainties in the wavelength calibrations. Further work is required to ascertain whether the O abundance of HE 13272326 can be explained in this manner.
Despite the uncertainties of the corrections to the 1D LTE analysis, it is clear that HE 13272326 belongs to the group of stars displaying very large CNO abundances. It appears that the majority of these objects have very low metallicities (i.e. ) and that HE 13272326 is the most extreme example of the group. However, HE 13272326 has a similar overall CNO abundance pattern compared to the only other known star having , HE 01075240 (Christlieb et al. 2002; Bessell, Christlieb & Gustafsson 2004). The unusually high excesses of O of these objects underline that there is no defined trend amongst the stellar O abundances at the lowest metallicities. This suggests that there might not be a simple explanation for the origin of O in the very earliest phases of the Galaxy.
4.2 Concluding Remarks
In summary, we adopt the final O abundance to be (subgiant) or (dwarf). These values are consistent with the upper limits derived from the O I triplet at Å and the [O I] line at 6300 Å. This would not be the case if the 1D LTE abundances derived from OH had been adopted. We note here that atomic diffusion might have modified the abundances of HE 13272326. According to theoretical calculations of Richard et al. (2002), the O/Fe ratio might originally have been higher. However, observational confirmation of their calculations is still pending. In any case HE 13272326 provides strong observational evidence that 3D LTE effects for the O abundances derived from OH lines using 1D LTE model atmospheres have to be taken into account, especially for hotter metal-poor stars. Where already available, such corrections should generally be applied when deriving O abundances for metal-poor stars. A systematic investigation of newly corrected O abundances with respect to metallicity is clearly desirable.
The newly derived O abundance provides additional constraints on the Population II models proposed for HE 13272326 and other metal-poor stars. Whether or not the new abundance can be reproduced by those models remains to be seen. Finally we wish to mention that the Iwamoto et al. (2005) model does not include neutron-capture elements. Thus it is not clear whether the high Sr abundance in HE 13272326 could be accounted for with their model. However, recent computations by Fröhlich et al. (2005) indicate that a Sr excess could be in agreement with the faint SN scenario of Iwamoto et al. We note too that the absence of Li lacks explanation. The Population III binary scenario might account for the low Li abundance (Frebel et al. 2005; Aoki et al. 2006), but radial velocity variations have not yet been detected. Hence, a longer time span is needed to monitor the star for such variations in order to draw a final conclusion. In the absence of such data we favor the Population II interpretation of HE 13272326.
References
- Aoki et al. (2006) Aoki, W., et al. 2006, ApJ, in press
- Asplund (2005) Asplund, M. 2005, ARA&A, 43, 481
- Asplund & García Pérez (2001) Asplund, M. & García Pérez, A. E. 2001, A&A, 372, 601
- Asplund, Grevesse & Sauval (2005) Asplund, M., Grevesse, N., & Sauval, A. J. 2005, in ASP Conf. Ser. 336: Cosmic Abundances as Records of Stellar Evolution and Nucleosynthesis, 25
- Bessell, Christlieb & Gustafsson (2004) Bessell, M. S., Christlieb, N., & Gustafsson, B. 2004, ApJ, 612, L61
- Boesgaard et al. (1999) Boesgaard, A. M., King, J. R., Deliyannis, C. P., & Vogt, S. S. 1999, AJ, 117, 492
- Bohlin et al. (1983) Bohlin, R. C., Jenkins, E. B., Spitzer, L., York, D. G., Hill, J. K., Savage, B. D., & Snow, T. P. 1983, ApJS, 51, 277
- Bromm & Loeb (2003) Bromm, V. & Loeb, A. 2003, Nature, 425, 812
- Christlieb et al. (2002) Christlieb, N., et al. 2002, Nature, 419, 904
- Collet, Asplund, & Trampedach (2005) Collet, R., Asplund, M., & Trampedach, R. 2005, IAU Symp. 228, proceedings, in press
- Dekker et al. (2000) Dekker, H., D’Odorico, S., Kaufer, A., Delabre, B., & Kotzlowski. 2000, in Optical and IR Telescope Instrumentation and Detectors, ed. M. Iye & A. F. Moorwood, Vol. 4008, 534–545
- Frebel et al. (2005) Frebel, A., et al. 2005, Nature, 434, 871
- Fröhlich et al. (2005) Fröhlich, C., Martínez-Pinedo, G., Liebendörfer, M., Thielemann, F. ., Bravo, E., Hix, W. R., Langanke, K., & Zinner, N. T. 2005, arXiv:astro-ph/0511376
- Gillis et al. (2001) Gillis, J. R., Goldman, A., Stark, G., & Rinsland, C. P. 2001, JQSRT, 68, 225
- Iwamoto et al. (2005) Iwamoto, N., Umeda, H., Tominaga, N., Nomoto, K., & Maeda, K. 2005, Science, 309, 451
- Kiselman (1991) Kiselman, D. 1991, A&A, 245, L9
- Meynet, Ekström, & Maeder (2005) Meynet, G., Ekström, S., & Maeder, A. 2005, arXiv:astro-ph/0510560
- Nissen et al. (2002) Nissen, P. E., Primas, F., Asplund, M., & Lambert, D. L. 2002, A&A, 390, 235
- Piskunov & Valenti (2002) Piskunov, N. E. & Valenti, J. A. 2002, A&A, 385, 1095
- Richard et al. (2002) Richard, O., Michaud, G., & Richer, J. 2002, ApJ, 580, 1100
- Storey & Zeippen (2000) Storey, P. J. & Zeippen, C. J. 2000, MNRAS, 312, 813
- Suda et al. (2004) Suda, T., Aikawa, M., Machida, M. N., Fujimoto, M. Y., & Iben, I. J. 2004, ApJ, 611, 476
- Umeda & Nomoto (2003) Umeda, H. & Nomoto, K. 2003, Nature, 422, 871
| Subgiant | Dwarf | ||||||
|---|---|---|---|---|---|---|---|
| Feature | [X/H] | [X/Fe]aaFor abundances [X/Fe] we consistently used the NLTE corrected Fe abundance. An error of dex was estimated for all abundances. | [X/H] | [X/Fe]aaFor abundances [X/Fe] we consistently used the NLTE corrected Fe abundance. An error of dex was estimated for all abundances. | |||
| Fe I LTE | 1.7 | 5.7 | 1.7 | 5.7 | |||
| Fe I NLTE | 1.9 | 5.5 | 1.9 | 5.5 | |||
| CH LTE (1D) | 6.9 | 1.5 | 4.0 | 6.6 | 1.8 | 3.7 | |
| CH LTE (3D) | 6.3 | 2.1 | 3.4 | 6.0 | 2.4 | 3.1 | |
| OH LTE (1D) | 6.8 | 1.8 | 3.7 | 6.5 | 2.1 | 3.4 | |
| OH LTE (3D) | 5.9 | 2.8 | 2.8 | 5.6 | 3.1 | 2.5 | |
| O I LTE | 6.2 | 2.5 | 3.1 | 6.5 | 2.2 | 3.3 | |
| O I NLTE | 5.9 | 2.7 | 2.8 | 6.2 | 2.5 | 3.0 | |
| [O I] | 8.0 | 0.7 | 4.9 | 8.3 | 0.4 | 5.1 | |
Note. — Correcting the 1D LTE nitrogen abundance of HE 13272326 (Aoki et al. 2006; (subgiant), (dwarf)) for 3D effects results in (subgiant) and (dwarf). See text for discussion.