email: laz@mao.kiev.ua 22institutetext: Astronomical Observatory of the Kyiv National University, Observatornaya 3, 04053 Kyiv-53, Ukraine
email: babenko@observ.univ.kiev.ua
The Kyiv Meridian Axial Circle Catalogue of stars in fields with extragalactic radio sources ††thanks: The catalogue is only available in electronic form at the CDS via anonymous ftp to cdsarc.u-strasbg.fr (130.79.128.5)
A catalogue of astrometric (positions, proper motions) and photometric (B, V, R, r′, J) data of stars in fields with ICRF objects has been compiled at the Observatory of the National Academy of Sciences of Ukraine and the Kyiv University Observatory. All fields are located in the declination zone from 0∘ to +30∘; the nominal field size is 46′(right ascension)x24′ (declination). The observational basis of this work is 1100 CCD scans down to V=17 mag which were obtained with the Kyiv meridian axial circle in 2001–2003. The catalogue is presented in two versions. The version KMAC1-T contains 159 fields (104 796 stars) and was obtained with reduction to the Tycho2 catalogue. For another 33 fields, due to a low sky density of Tycho2 stars, the reduction was found to be unreliable. Transformation to the ICRF system in the second version of the catalogue (KMAC1-CU) was performed using the UCAC2 and CMC13 catalogues as a reference; it contains 115 032 stars in 192 fields and is of slightly better accuracy. The external accuracy of one catalogue position is about 50–90 mas for V15 mag stars. The average error of photometry is better than 0.1 mag for stars down to 16 mag.
Key Words.:
astrometry – reference systems – catalogues1 Introduction
The Meridian Axial Circle (MAC, D=180 mm, F=2.3 m) in Kiev was recently modernized by installing a 1040x1160 CCD camera that can work in scan mode (Telnyuk-Adamchuk et al. aa2002 (2002); Karbovsky karb (2004)). The camera, designed at the Nikolaev Observatory (Ukraine), incorporates a glass filter to enable observations in the V band. With effective exposures of about 108 sec for equatorial stars, the magnitude limit is V=17 mag.
The instrument was used in two observational projects. The first long-term project was the astrometric survey of the sky in the equatorial zone to extend the Hipparcos-Tycho reference frame to fainter magnitudes. This programme is still in progress. The second project, now completed, concerns observations of star fields in the direction of 192 extragalactic ISRF objects, a list of which, for the declination zone from 0∘ to +30∘, was taken from Molotaj (Molotaj (2000)). This declination range was chosen to reduce CCD distortion effects (Vertypolokh et al. nik2001 (2001); Vertypolokh et al. journ (2003)).
The project was carried out in the framework of scientific problems: maintenance of the Hipparcos frame of reference and the linking of optical frames to the ICRF. This report describes the data reduction and compilation of the Kyiv meridian axial circle catalogue (KMAC1) of stars in fields of extragalactic radio reference frame sources.
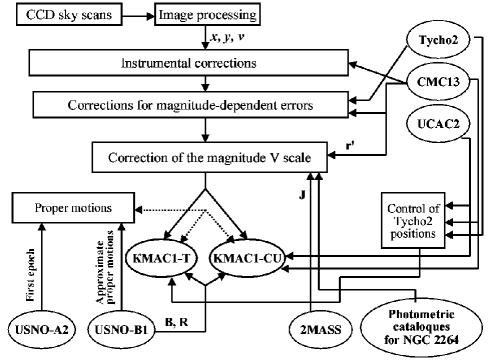
The most important data sources used for the compilation of the catalogue include the major catalogues Tycho2 (Hog et al. tycho (2000)); CMC13 (Evans et al. evans (2003)); UCAC2 (Zacharias et al. ucac (2004)); 2MASS (Cutri et al. 2mass (2003)); USNO-A2.0 (Monet et al. a20 (1998)) and USNO-B1.0 (Monet et al. b10 (2003)). Also, for calibration of the instrumental magnitude scale we used several photometric catalogues of NGC 2264 stars.
The astrometric reduction and source catalogues used for compilation of the KMAC1 are shown in Fig. 1. Compilation of the catalogue followed the following steps of data reduction: image processing (Sect. 2), calibration for instrumental and magnitude-dependent errors (Sect. 3) and correction of the magnitude scale (Sect. 4). Conversion to the ICRF was carried out with the two alternative types of referencing, using the space-based catalogue Tycho2 and the modern ground-based catalogues CMC13 and UCAC2. This resulted in the compilation of two catalogue versions: KMAC1-T and KMAC1-CU. The details of referencing to the ICRF system are discussed in Sect. 5 and the computation of proper motions in Sect. 6. The catalogue description, its properties and external verification are described in Sect. 7.
2 Image processing
The catalogue is based on 1100 CCD scans each of 46x24′ size in the sky (right ascension x declination) and centered on the observed ICRF object with an accuracy of about . Each of the 192 ICRF fields was scanned on at least 5 nights. The original scanned data were archived and stored in a CD-ROM database.
The first stage of data reduction began with a search and extraction of data files from the database archive. CCD images of stellar fields were then filtered of various instrumental and noise features that introduce an inhomogeneity in the sky level. The inhomogeneity pattern inherent to a scan mode is dominated by a 1D strip-like structure that changes only along the declination (DEC) direction (the -axis in the CCD), with a possible weak trend over right ascension (RA), the -axis of the CCD. The striped structures in the images are formed by increased noise from a few dozen bad bright pixels, which produce vertical pixel-width noisy strips. Images are also contaminated by a number of flares and tracks of radioactive particles of cosmic origin and from Chernobyl and which have coma or star-like shapes. Also, the sky level measured along the -axis has a large-scale component which under normal observing conditions does not exceed 5% of the total signal level. Some scans also show vertical variations in the sky level related to clouds or changing sky brightness.
All types of background variation were eliminated with a simple correction model that considered these variations to be caused by additive components. While this interpretation is reasonable for a vertical pixel width structure, large-scale variations along the -axis can also contain a multiplicative flat field component. To investigate this problem, we carried out a study illuminating the CCD with a light source placed at the telescope objective. Using bias information read from the outer calibration regions of the CCD, the flatfield pattern was computed and compared to the systematic trends in the preliminary differences of instrumental magnitudes and CMC13 photometry. Only a partial correlation was found, indicating a possible variation of the bias along the -axis (a similar conclusion was reached by Evans et al. (cmc (2002)) for observations at the Carlsberg meridian circle). Considering the small amplitude of variations, they were treated as additive components. However, possible inaccuracies due to omission of multiplicative components in the image analysis is compensated for by the method of calibration for errors dependent on instrumental parameters, in which any residual systematic trend along the -axis is eliminated using information from an external catalogue (Sect. 3.1).
Thus, scans were filtered by, first, subtracting the local sky large-scale changes in the two directions, and then subtracting a running average taken along each column of 1 pixel width.
Detection of objects in the noisy field was carried out by application of a smoothing filter whose shape approximately corresponded to the Point Spread Function, and by the elimination of bright 1x1 pixel flares. Detection consisted of a comparison of the pixel flux with a threshold defined as , where is the local sky noise. The second term in this expression ensures approximately constant, independent of and the sky star density, the number of false detections (from 300 to 500 per frame). For faint images, it was required that an object should fill at least two adjacent pixels. For bright images a special filtration was applied to avoid false multiple image detections.
Determination of the , positions and fluxes for each object was performed with the various approaches available for processing of CCD images. These are: 1) the modified Center of Gravity (CoG) method (Irwin irwin (1985)) and 2) a group of the full profile fitting methods based on the Gaussian linearized least squares method (e.g. Condon condon (1997); Viateau vit (1999)).
The modified CoG method used at the CMT (Evans et al. cmc (2002)) is based on theoretical considerations by Irwin (irwin (1985)) who demonstrated that its accuracy is almost equal to that obtained with a full profile fitting. The method, based on profile fitting, provids both for circular and elliptical Gaussians; in the second case, horizontal orientation of semi-axes was considered as adequate. The original non-smoothed scans were used for the image processing. Numerical procedures corrected for the undersampling effect that occurs when the pixel size is large and comparable to the FWHM (Viateau vit (1999)). In bright images, saturated pixels were not used for the fitting.
Centroiding was performed, trying the CoG method and the Gaussian circular and elliptic models in turn. When a solution was not achieved at any step of the computation, the image quality index was flagged as non-standard centroiding. This occured also when a final solution, with reference to the initial approximate position (found from the first CoG iteration) was shifted by more than 1.5 pixels. The image quality index thus marks images that are possibly multiple or of non-standard shape.
Computations made by different methods produced very similar results, which supports the conclusions of Irwin (irwin (1985)). Thus, the r.m.s. difference of coordinates computed by the CoG and Gaussian methods is about for V=15–16 mag stars and is negligibly small in comparison to the internal random error of one observation.
The most important feature of the profile fitting methods is the possibility to change their performance so as to minimize the influence of systematic errors typical of the CCD used at the MAC and which seriously degrade the accuracy of the DEC measurements (see discussion in the next Section). Preliminary processing showed that these errors appear as a systematic trend in declination with magnitude, which does not depend on whether computations are made by the CoG or profile centroiding methods. The largest effect occurs for bright magnitudes; thus for V=10 mag stars the systematic effect, measured with reference to V=14 mag stars, is . To reduce this effect, each pixel and the related equation of the linearized system of equations was weighted by a factor where is the flux received by the pixel from the star. This modification of the least squares procedure decreased the amplitude of the error to .
3 Astrometric calibrations
The main goal of the astrometric calibrations described in this Section is the refinement of the measured , positional and photometric data influenced by various bias sources that are particularly intricate for the CCD camera used for the observations. A problem arose from the inaccurate tuning of the electronics which produced a slight asymmetry of the star images. Based on visual inspection, we considered the effect to be acceptably small and so started observations. After a major part of the observations had been obtained, it became clear that the data is affected by large systematic errors caused, most likely, by the asymmetry of the images. Thus, refinement of the data required the use of special data processing technique.
3.1 Calibration of instrumental errors
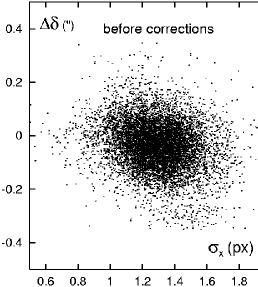
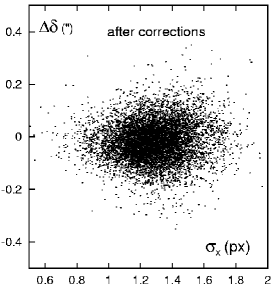
The dominant componets of the MAC instrumental errors are related to the following effects: oversaturnation of bright V mag images caused by use of a 12-bit AD convertor; a slight asymmetry of stellar profiles in the direction of the CCD declination -axis, along the direction of fast charge transfer to the reading register in the last row. Also, profiles of star images are elongated along the -coordinate. While the Gaussian image size parameter does not show any change with , the parameter progressively increases in this direction (Fig. 2), as does the image elongation. Only near the CCD reading register location, at its left edge (), are the images perfectly round (). This effect is similar to the charge transfer efficiency problem that occurs along the scan direction (Evans et al. cmc (2002)), but of different origin. No dependency of the image elongation on the background level is seen. The amplitude of each type of image distortion was found to depend on the star flux. Images are fairly symmetric along the drift scan direction, so degradation due to the above effects concerns mainly the DEC and photometry.


Image distortions, by affecting the positions of stars, cause a systematic bias in the DEC. Analysis of the KMAC1 positions, obtained with preliminary data reduction with reference to 12–14 mag CMC13 stars, revealed a correlation between differences KMAC1-CMC13 and . Fig. 3 shows the typical systematic trend in , which is different for different magnitudes and normally does not exceed –. The trend is quasi-linear with a slope that depends on but that cannot be approximated easily since a more complex cross-relation between , , and occures. In particular, stars imaged in the 50 px edge area most distant from the reading register escape this dependency.
To remove the dependence of on and , we considered a number of models and found that the best correction is to introduce directly to the measured values the factor:
| (1) |
where is a coefficient defined for each 1-mag bin of star magnitudes and is a constant model parameter valid for the whole data set. The function (1) adequately models the complex nature of image distortions inherent to the MAC, the model parameter is the value corresponding to non-distorted star images, such as those observed at the CCD reading register () and are of circular form . Thus model (1) calibrates the coordinates for the deviations from , irrespective of the star position in the CCD frame and the seeing. The use of a fixed constant value for any magnitudes implies that the reduction (1) calibrates the data to a fixed star brightness. More complicated versions of the reduction model that included the term or image elongation lead to no improvement.
The coefficients and were found based on a criterion of best convergence of star declinations computed for the nights when they were observed; the reduction procedure used the CMC13 catalogue as a reference. The numerical estimate of 1.11 px obtained for corresponds to the value typical for well-exposed images of mag stars measured near the CCD reading register ().
A similar calibration procedure, based on a formal reduction to the CMC13 photometry, was applied to instrumental magnitudes . The difference of photometric bands is of minor importance here since color residuals are not correlated with the image parameters measured at the MAC. The calibration has a form similar to (1):
| (2) |
Here the definition of as a free model parameter lead to the appearance of an extra systematic trend of with , therefore was taken to be equal to the expectation (an average) of at given and . The only model parameter (defined for each 1-mag bin in ) was determined similarly, from a condition of the best convergence of individual observations.
Another systematic effect was found considering preliminary differences KMAC1-CMC13 of positions and photometric values (formal in the last case) computed with calibrations (1) and (2). The differences were found to contain a small fluctuating component along the -axis, normally within in position and mag in photometry. However in the px area, the trend in DEC increased to . The origin of this trend is unclear and possibly can be due to the imperfect pixel geometry of the CCD. Using KMAC1-CMC13 differences, the trend was removed (only the variable part, so as not to incorporate possible systematic errors of the CMC13) and the reduction procedure, including determination of , and values, was iteratively repeated. In Fig. 4, the KMAC1-CMC13 residuals in DEC before and after calibration are shown. Along with a complete remove of the correlation, the random scatter of differences has been noticeably reduced.
The successful refinement of the measured data suffering from various instrumental errors was based on extensive use of the CMC13 as a tool for error calibration. Under the reasonable assumption of no correlation between instrumental errors of the two telescopes, the procedure is correct, and the accuracy of calibration depends on the accuracy of the data in the source catalogue.
3.2 Formation of equivalent scans
In drift scan mode, formation of star images is non-synchronous since the median moment of the image exposure depends on RA. For that reason, the atmospheric turbulent conditions under which the images are formed vary as a function of RA. The measured , , data are therefore affected by a time-dependent component of atmospheric refraction, causing an effect of image motion much larger than is inherent to the astrographic mode of observations. The induced temporal signal is difficult to trace and makes referencing of the observed data to the celestial system more difficult. A number of methods have been proposed to calibrate this effect, see e.g. Evans et al. (cmc (2002)); Viateau et al. (vit (1999)).
In the case of short scans obtained at the MAC, direct calibration of atmospheric fluctuations with use of the Tycho2 catalogue was found to give unreliable results since scans often contained few reference stars. We used a method which consists of substitution of all individual overlapping (normally to ) scans available for the particular ICRF field by a single specially-formed ”equivalent” scan. For this, each scan of the ICRF field was preprocessed with the Tycho2 catalogue so as to determine a zero point of CCD positions and magnitudes, and to approximately (to ) reduce the relative displacement of individual night scans. After cross-identification, a compiled list of field objects was formed with , , data averaged. This procedure is similar to the formation of subcatalogues adopted at the Valinhos meridian circle (Viateau et al. vit (1999)) but with no conversion to equatorial coordinates. The validity of this substitution is based on the linearity of the averaging operation. Thus, the averaging can be performed either prior to conversion to the celestial coordinates (that is, over the CCD measured data), or after this reduction (over equatorial positions), with equivalent results. A stringent linearity of the averaging is only achieved, however, when the star content of individual scans is identical. This is the case for the bright stars that are normally detected and measured in each nightly scan.
In the case of omitted (usually faint) object images, corrections allowing for the compensation for the scan system of the ”omitted” star observation should be applied to that object’s , , data in the equivalent scan. The information necessary to make this correction is found by obtaining the differences between each nightly scan and the correspondent equivalent scan. Since we consider the measured data, not transformed to celestial coordinates and magnitudes, the differences usually show systematic trends in both and directions and due to possible varying magnitude errors in . The systematic component of these differences was approximated with cubic spline functions.
Calibrations for omitted images started from consideration of major systematic trends along the temporal -axis. After corrections in the equivalent scan data (, , ), these trends were removed from the nightly scans. As a result, the differences between each nightly and ”equivalent” scan became noise-like in shape. Next, similar steps of calibration were applied to the differences of ”nightly scan” - ”equivalent scan” registered along the and data axes. To obtain convergence, the whole procedure was reprocessed twice, the outliers removed and all computations repeated again.
The resulting equivalent scans used for transformation to the ICRF are less subject to atmospheric differential image motion due to averaging over a subset of individual scans included in the output. The averaging effect is inversely proportional to the square root of the number of frames, which is 6 on average. The output nightly scans were of less importance since they were tightly reduced to the system of the corresponding equivalent scan by filtering out any systematic differences. The differences between these scans contained only a random noise component which provided valuable information on internal catalogue errors (Sect. 7.1).
An important restriction to the method discussed is that correct tracing of scan system changes is achieved only with completely overlapped and co-centered nightly scans. Displacement of individual scans by % of a scan length results in incorrect extrapolation of the offset scan system in edge areas and causes the problems discussed in Sect. 5.
3.3 Magnitude-dependent errors
For investigation of magnitude-dependent systematic errors in , and data we carried out a preliminary processing of equivalent scans with the Tycho2 catalogue. Direct inspection of the KMAC1-Tycho2 residuals clearly indicated the presence of errors dependent on magnitude. Systematic effects in positions were found to be within for the 9.5–13 magnitude range, sharply increasing to at mag. A much larger trend is seen in the KMAC1 photometry for bright mag stars where it exceeded 1.0 mag. Systematic components of KMAC1-Tycho2 residuals were treated as errors in the MAC data, therefore, , and values were corrected by subtracting systematic trends. Calibration was applied only to stars in the Tycho2 magnitude range V mag.
It was considered that initial estimates of KMAC1-Tycho2 residuals are somewhat biased due to redistribution of magnitude-dependent errors between reference stars in the field. Therefore, to extract better estimates of the magnitude-related errors from the KMAC1-Tycho2 residuals, calculations were refined in an iterative manner.
After calibration, the residual trend in corrected positions, estimated using the CMC13, does not exceed for the entire magnitude range.
3.4 Seasonal variations of magnitude-related errors
More explicit analysis revealed a variation of the magnitude error in declination with season. For the study we used differences KMAC1-CMC13 obtained with a preliminary data processing based on the CMC13 as a reference. Fig. 5 shows the systematic trend of the differences for 10 groups of star fields with a numbering that corresponds to their arrangement in RA, or season. Variations with season are especially strong at bright magnitudes; the difference between ”winter” (numbers 1–6) and ”summer” fields (7–10) is about for mag stars and is small at mag. Note that an attempt to resolve this seasonal effect, referring the MAC data directly to Tycho2 and then using the KMAC1-Tycho2 differences, lead to inconclusive results due to the narrow magnitude range, insufficient statistics, and, especially, the filtering effect produced by the reduction procedure.


Considering that the picture shown in Fig. 5 may originate from errors in the CMC13, we used this information indirectly, to assume a possibility of a specific error in the MAC declinations (or in values), and to define a function
| (3) |
that models the bias in . Model parameters and were found as those whose use yielded the least square values of KMAC1-Tycho2 differences in the DEC. The function (3) is defined only for bright mag stars; the positions of fainter stars cannot be corrected. Calculations yielded a solution mag, mag with an uncertainty of mag in each parameter.
The effect of calibrations based on the Tycho2 catalogue is seen in Fig. 5 where the KMAC1-CMC13 differences after correction are shown in the bottom panel; the residual variations of the magnitude-related errors in DEC are shown to be reduced to or less at mag.
4 Calibration of the magnitude scale
Star magnitudes V of the KMAC1 have been computed using measured values corrected for instrumental and magnitude-dependent errors as described above. The zero point of the V magnitude scale was determined using the Tycho2 photometry of bright V mag stars. The problem consisted of verification of the magnitude scale linearity at its faint end, which cannot be directly controlled due to the absence of faint all-sky standards in the V band. The study and the following calibration used indirect methods relied upon red and infrared J data taken from the CMC13 and 2MASS global catalogues respectively. The UCAC2 catalogue, as an alternative -like data source, was not utilized since its magnitudes are only approximate and not calibrated. Our attempt to take advantage of this catalogue photometry resulted in a similar but slightly less accurate calibration compared to that provided using the CMC13.
The development of the calibration model and its velidation was based on a photometric study of the open cluster NGC 2264 scans obtained at the MAC, specially for this purpose.
4.1 The open cluster NGC 2264
For this study we compared KMAC1 V values computed for stars of the open cluster NGC 2264 with those given in several high-accuracy photometric catalogues. As photometric Vst standards, we used data provided by Sung et al. (sung (2003)) for 329 identified stars; Kuznetsov et al. (Kuzn (2003)) identified 40 stars ; and the WEBDA Internet database of UBV CCD observations in open clusters provided 523 stars (Mermilliod webda (2000)). First, we verified that there are no systematic dependences of V=V–Vst residuals either on B-V color or the star CCD position.


Examination of V residuals, however, revealed a large 0.6 mag systematic bias of measured data for faint V mag stars, shown in Fig. 6a. Interpretation of this plot should take into account that images of stars brighter than 12 mag are oversaturated and their fluxes determined by the centroiding procedure can be systematically biased. The resulting effect in magnitude is however opposite because the zero point of the V scale is referred to bright Tycho2 stars. Another important feature of the plot is the linearity of magnitude scales in either bright V mag and faint V mag segments of the V-axis, however, with different zero points.
We tried to simulate this systematic effect using two-color VV–J diagrams that were built for NGC 2264 (Fig. 7a) and for a complete list of the KMAC1 stars (Fig. 7b). Star distributions in both plots are clearly separated depending on V, bright stars being shifted systematically upward relative to faint stars. The shift does not depend on V–J color, so we refer it entirely to magnitude-dependent errors in MAC photometry. A number of other two-color diagrams were also tested, including those that incorporate H and K infrared data from the 2MASS catalogue; it is the VV–J diagram that ensures the best separation of stars in V.

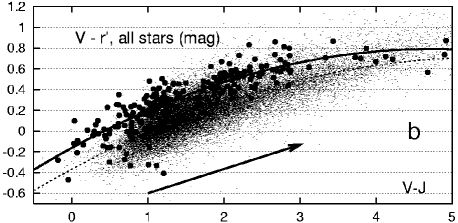
The differences V for bright KMAC1 stars are approximated by a function (solid line in Fig. 7b)
| (4) |
A small residual scatter of mag suggests that the distribution is uniform and the dependency (4) is valid for any field. In particular, the function matches reasonably well the bright star distribution for NGC 2264 (solid line in Fig. 7a). Note that the function (4) represents a zero-point of the V scale since the bright stars, for the most part, are the Tycho2 stars used as a reference for photometry. The dashed line refers to all stars. The position of faint V mag stars are shifted downwards and the fitted dashed line is almost parallel to in the most populated 0.5–2.0 area of V–J colors. This leads to the very important conclusion that errors in MAC photometry do not depend on the color, which is consistent with previous results based on the use of photometric standards; rather, they are a function of V.
The calibration of faint star photometry to the instrumental magnitude system defined by bright stars is based on the use of the fitting curve (4) as reference. Consider the two-color diagram where the unbiased star location A is a point V,VJ in the fitting curve (Fig. 7a). The star’s measured position, B, is shifted by in both directions, to V,VJ. This geometry allows us to express the point B distance to the fitting curve (4) in two ways, as V and as where is the derivative. Hence we derive an estimate
| (5) |
of the bias. In the first approximation (when ), it is equal to the vertical distance between the measured star location B in the diagram and the fitting color curve .
4.2 Galactic extinction
The above analysis does not take into account interstellar extinction, which requires special considerations. With respect to bright stars we may however assume that for the most part they are nearby objects not affected by extinction. The distribution of bright stars in Fig. 7a therefore is expected to follow a natural temperature reddening, at least for V-J mag. Considering that the interstellar reddening is inversely proportional to wavelength (Whitford whitford (1958)), we find a direction along which faint stars may move in the color diagrams (arrows in Fig.-s 7a and b). The inclination of the reddening line 0.234 was computed using the median wavelengths 0.54, 0.623 and 1.25 nm of V, and J filters respectively, with no allowence for spectral class. It is seen that the temperature and Galactic reddening are indistinguishable since the corresponding curves are almost parallel. Thus, both the function (4) and the reddening curve have equal inclination at V-J=2.0. The differential shift of faint stars off the temperature line is therefore small and for most stars with V-J ranging from +1 to +2 is, on average, less than 0.05 mag, supposing that the extinction in V does not exceed 1.5 mag (1.0 mag color excess in V-J). Since further computations are performed by averaging over the total star sample, the expected error in the photometric calibration is even smaller.
4.3 Calibration of individual fields
The point estimates of Eq. (5) thus form the basis for the calibration of the magnitude scale in isolated fields with the use of external color information from CMC13 and 2MASS. Taking into account the insufficient statistics and the complicated shape of the bias to be removed, we introduced for each field a simple one-parameter model that represents the systematic dependence of as a function of V. The form of this function was chosen considering the distribution of values computed with Eq. (5) for all stars with known and J values (Fig. 8). The overall distribution of is like that shown in Fig. 6a for NGC 2264, except with more shallow knee, and is fitted with the function
| (6) |
where the single parameter is the bias magnitude at V=12.65 mag. The fit obtained with is shown by the solid line.
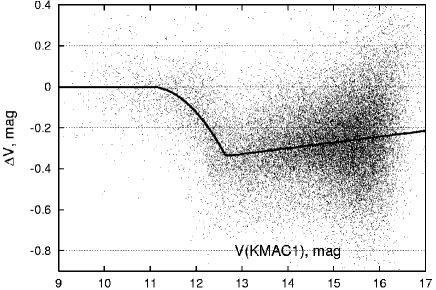
Further analysis has shown that the value is to be determined for each star field individually, by fitting estimates (5) with the model (6). The calibration of magnitudes therefore was performed with individual values that varied from -0.63 to -0.14 (-0.58 for NGC 2264). The scatter of values, in particular, is the cause of the large mag dispersion of points in Fig. 8.
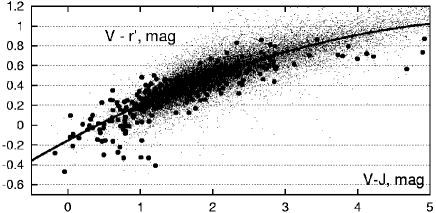
The efficiency of corrections is seen from the two-color VV–J diagram built with final calibrated V values (Fig. 9). The relative shift of bright to faint stars like that shown in Fig. 7b was eliminated; also, the standard deviation of points from the fitting curve
| (7) |
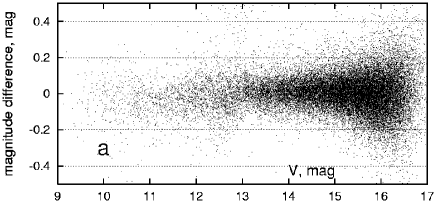
was improved from mag to mag. The scatter of V residuals from the fitting curve (7), plotted in Fig. 10a as a function of V, includes errors in values and indicates the upper limit of KMAC1 magnitude errors. This plot also shows a good elimination of systematic errors.
Fig. 10b shows a comparison of the KMAC1 and Valinhos meridian circle photometry (Camargo et al. camargo (2001)) for 1190 stars in 13 stellar fields. The residuals contain no large systematic trend; the standard deviation of data points is mag. Consideration of local fields, however, indicates local systematic discrepancies in magnitudes sometimes reaching mag, with a random scatter of residuals of about mag. Considering the accuracy of the Valinhos photometry, which is about mag (Viateau et al. vit (1999)), we estimate that the KMAC1 data is of the same or better accuracy.

In conclusion, we give a relation between V and the CMC13 values using J colors:
| (8) |
5 Reduction to the ICRF
Compilation of KMAC1 started from astrometric calibration of the measured data as described in the previous Sections. Conversion of corrected CCD , positions to equatorial coordinates originally was intended to be performed using the Tycho2 catalogue which is the best optical representation of the ICRF. Prior to this conversion we performed a tentative study to determine how well the positions of the Tycho2 catalogue match the modern catalogues CMC13, UCAC2 and our observations. For this purpose we selected Tycho2 stars that:
-
•
are located in the fields observed;
-
•
are listed at least in either the CMC13 or UCAC2;
-
•
have preliminary KMAC1 positions that do not differ from those in either the CMC13 or UCAC2 by more than ;
-
•
have proper motions and not exceeding /year.
Fig. 11 presents individual Tycho2-CMC13 and Tycho2-UCAC2 differences plotted versus Tycho2-KMAC1 preliminary differences for 1843 Tycho2 stars that meet the above conditions. The almost diagonal location of data points testifies to the good agreement between the ground-based catalogues, which provide positions normally consistent to —. Very large deviations, , usually seen for faint stars V12 mag, seem to originate from errors in the Tycho2 positions. For 1.4 percent of stars, positional errors of Tycho2 exceed , and in about 12% they are larger than . The r.m.s. of the difference of ”Tycho2 - CCD catalogue” in RA is 204, 166 and 210 mas, respectively, for the CMC13, UCAC2 and KMAC1. In DEC these estimates are 148, 123 and 170 mas. Somewhat minor deviations, 149 mas in RA and 129 mas in DEC, were found by Camargo et al. (camargo (2001)) from the analysis of the Valinhos transit circle observations. Of course, the values cited include comparison catalogue errors which are usually not large.
The above analysis establishes the degradation of the Tycho2 data at the epoch of KMAC1 observations, probably due to uncertanties in proper motions. This problem is often allowed for in different ways when referring CCD observations to equatorial coordinates. Thus, at the Flagstaff Astrometric Scanning Telescope reductions are made by applying weights to the Tycho2 stars depending on their brightness (Stone et al. fasst (2003)).
 |
 |
 |
 |
This discussion suggests that a reliable reduction to the ICRF using the Tycho2 catalogue requires the use of a sufficiently large number of reference stars which are to be first filtered or weighted to eliminate problem stars. This is especially important in our case since, due to the rather short scan length, some fields in sky areas with a low star density are represented only by 6–8 Tycho2 stars. Also, the accuracy of the reduction is affected by inhomogeneity in the sky distribution of reference stars whose images, in addition, are oversaturated and poorly measured. At the first stage of referencing we therefore detected and removed all Tycho2 problem stars whose positions deviated from the CMC13, UCAC2 and preliminary KMAC1 data by more than . This greatly improved the reliability of the conversion to equatorial coordinates and was found to be more efficient than the usual search for outliers based on an iterative approach to the least-squares solution. With a truncation limit of , reliable results were obtained, however, for 106 fields only. For another 53 fields, a good transformation to the ICRF required a further rejection of reference stars with Tycho2-CMC13 and Tycho2-UCAC2 differences in the range from to . For the 33 remaining fields with a low reference star density, the reduction was found to give quite unstable and ambiguous solutions highly sensitive to any changes in the reference star set.
A further comparison with the CMC13 and UCAC2 positions has shown that large systematic deviations are present at the edges of some fields. This concerns those fields that at some nights were observed with incorrect telescope pointings (made by hand since the MAC is not automatic); in a few cases the relative displacement of sky strips exceeds in RA. Individual scans thus were not exactly overlapped as was assumed at the phase of equivalent scan formation. To eliminate this fault, the offset regions were truncated.
A rigorous conversion to the ICRF using the Tycho2 catalogue was achieved for 159 sky fields, most of which had a high star density. Conversion for the complete data array (192 sky fields) required the use of the CMC13 and UCAC2 catalogues which are known to be in the ICRF system. The reduction was performed with well-measured stars not fainter than 14.5 mag and by limiting their number to 170. Reference catalogues were used in a combined form, with equal weights. No truncation of offset scan edges was applied since the large number of reference stars ensured very tight referencing using spline fitting.
Thus, the catalogue KMAC1 exists in the two versions: with reduction to the Tycho2 (KMAC1-T) and to the CMC13 and UCAC2 catalogues (KMAC1-CU). No rejection of stars with large deviations from comparison catalogues was applied. V magnitudes given in both catalogues are identical and based on the Tycho2 photometry with the corrections described in Sect. 4.
6 Proper motions
The first epoch positional data used for the computation of proper motions was taken from the USNO-A2.0 catalogue. However the epoch difference of about 50 years prevented direct identification of stars with large proper motions. To improve the reliability of identification, the USNO-B1.0 catalogue proper motions were used and were applied to reduce displacement of star positions due to the difference in epochs. For stars not found in the USNO-B1.0, the identification was performed with no proper motion information applied. In this case, a window used for identification was set from to depending on the star magnitude. Stars with proper motions larger than about 40 mas/year therefore cannot be found in the USNO-A2.0 with no proper motion information from the USNO-B1.0.
The percentage of KMAC1 stars supplemented with proper motions varies from 53 to 97, and on average is 90%. The highest ratio of 93% is obtained in the magnitude range from 13 to 17 mag, dropping to 47% for V12 mag stars and to 74% for V17 mag.
Considering the approximate precision of mas, the mean epoch 1954 of the USNO-A2.0 and the internal positional precision of the KMAC1 (Table 1), we find a formal estimate of proper motion errors of 5–6 mas/year.
7 Characteristics of the catalogue
7.1 Description of the catalogue
The catalogue KMAC1, as explained above, was released in the two versions and can be obtained in electronic form from the CDS or via anonymous ftp://ftp.mao.kiev.ua/pub/users/astro/kmac1. The KMAC1-CU catalogue contains 115 032 stars in 192 sky fields and is referred to the CMC13 and UCAC2; the KMAC1-T contains 104 796 stars (91% of the total star number) in 159 fields and is referred to the Tycho2 catalogue. The location of KMAC-CU fields in the sky is shown in Fig. 12. All fields are located in a declination zone from 0∘ to 30∘; the mean epoch of observations is 2002.33. The main characteristics of the catalogue are given in Table 1.

| Catalogue version | KMAC1-T | KMAC1-CU |
|---|---|---|
| Reference catalogues | Tycho2 | CMC13, UCAC2 |
| Number of fields | 159 | 192 |
| Declination zone | 0∘ to +30∘ | 0∘ to +30∘ |
| Number of stars | 104796 | 115032 |
| Precision of positions | ||
| V mag: | 30–50 mas∗ | 30–50 mas∗ |
| 50–80 mas∗∗ | 30–70 mas∗∗ | |
| V=16 mag: | 170 mas∗ | 170 mas∗ |
| 180 mas∗∗ | 170 mas∗∗ | |
| Formal precision of | ||
| proper motions: | 5–6 mas/year | 5–6 mas/year |
| Precision of photometry | ||
| V mag: | 0.02–0.04 mag∗ | 0.02–0.04 mag∗ |
| 0.06–0.08 mag∗∗ | 0.06–0.08 mag∗∗ |
| ∗) internal errors; ∗∗) external errors |
| Astronomical data included: , , , , B, V, R, r′, J |
Besides the original positions given at the epoch of observations, proper motions and original V values, the KMAC1 catalogue contains B, R values from the USNO-B1.0 for 83% of the stars identified; r′ values are taken from the CMC13 for 67% of stars and J values from the 2MASS catalogue available for 94% of stars. Usual supplementary information, including internal error estimates, the number and epoch of observations, the image quality index, image size for extended objects and cross-identification to the USNO-B1.0 is also given.
Note that the flagged image quality index (see Sect. 2) may indicate centroiding problems of various origins (e.g. binary or unresolved stars); the catalogue positions therefore are probably biased. The unequal number of observations for RA and DEC data means that a rejection of bad measurements was applied which also may indicate certain problems with image quality not marked in the image quality index. These stars should not be used when very high accuracy of positions is required.
The list of sky strips, the IAU designations of the central ICRF object and star numbers and containing, respectively, in the KMAC1-T and KMAC1-CU for each strip, are given in Table 2. Note that is often lower than due to a truncation of sky strip edges applied to some fields (Sect. 5). The star number distribution over fields is highly inhomogeneous and depends on the Galactic latitude. This distribution as a function of RA is shown in Fig. 13.
| Identifier | Identifier | Identifier | Identifier | ||||||||
|---|---|---|---|---|---|---|---|---|---|---|---|
| 001031.0+105829 | 274 | 258 | 044907.6+112128 | 462 | 462 | 105829.6+013358 | 179 | – | 164125.2+225704 | 591 | 591 |
| 001033.9+172418 | 243 | 232 | 045952.0+022931 | 602 | 602 | 111358.6+144226 | 164 | – | 165259.3+022358 | 798 | 798 |
| 002232.4+060804 | 190 | 190 | 050145.2+135607 | 366 | 366 | 111857.3+123441 | 162 | 162 | 165809.0+074127 | 701 | 701 |
| 002225.4+001456 | 127 | – | 050523.1+045942 | 621 | 602 | 112027.8+142054 | 139 | – | 165833.4+051516 | 685 | 675 |
| 004204.5+232001 | 308 | 308 | 050927.4+101144 | 715 | 715 | 112553.7+261019 | 219 | 219 | 170734.4+014845 | 1105 | 1105 |
| 005905.5+000651 | 183 | – | 051002.3+180041 | 939 | 903 | 113320.0+004052 | 222 | – | 171521.2+214531 | 734 | 734 |
| 010838.7+013500 | 167 | 167 | 051601.9+245830 | 985 | 985 | 114505.0+193622 | 220 | 220 | 171913.0+174506 | 776 | 763 |
| 011205.8+224438 | 239 | 222 | 052109.8+163822 | 984 | 984 | 115019.2+241753 | 193 | – | 172824.9+042704 | 1483 | 1483 |
| 011343.1+022217 | 171 | 171 | 053056.4+133155 | 583 | 568 | 115825.7+245017 | 145 | – | 174535.2+172001 | 1130 | 1087 |
| 012141.5+114950 | 196 | 194 | 053238.9+073243 | 741 | 741 | 115931.8+291443 | 131 | 131 | 175132.8+093900 | 1305 | 1290 |
| 012156.8+042224 | 170 | 159 | 053942.3+143345 | 1376 | 1338 | 121923.2+054929 | 213 | 213 | 175342.4+284804 | 936 | 936 |
| 012642.7+255901 | 303 | 303 | 054734.1+272156 | 1402 | 1375 | 122006.8+291650 | 115 | – | 175559.7+182021 | 1256 | 1153 |
| 013027.6+084246 | 223 | 223 | 055704.7+241355 | 1998 | 1927 | 122503.7+125313 | 192 | 192 | 182402.8+104423 | 2426 | 2426 |
| 014922.3+055553 | 188 | 182 | 055932.0+235353 | 925 | – | 122906.6+020308 | 198 | – | 183250.1+283335 | 1419 | 1419 |
| 015127.1+274441 | 360 | 327 | 060309.1+174216 | 768 | 768 | 123049.4+122328 | 180 | 180 | 185802.3+031316 | 301 | 301 |
| 015218.0+220707 | 257 | 257 | 060351.5+215937 | 1911 | 1776 | 123924.5+073017 | 197 | 197 | 191306.8+013423 | 3941 | 3941 |
| 020346.6+113445 | 192 | 192 | 061350.1+260436 | 2077 | 1836 | 125438.2+114105 | 164 | 164 | 191254.2+051800 | 1600 | 1600 |
| 020434.7+090349 | 176 | 176 | 061357.6+130645 | 2128 | 2128 | 130020.9+141718 | 184 | 147 | 192218.6+084157 | 2755 | 2755 |
| 020450.4+151411 | 195 | 195 | 064524.0+212151 | 1488 | 1488 | 130933.9+115424 | 189 | – | 192559.6+210626 | 1755 | 1755 |
| 021748.9+014449 | 247 | 159 | 070001.5+170921 | 1723 | 1723 | 132700.8+221050 | 180 | 180 | 192840.8+084848 | 2682 | 2682 |
| 022428.4+065923 | 148 | – | 072516.8+142513 | 1121 | 1121 | 133037.6+250910 | 150 | – | 193124.9+224331 | 1701 | 1701 |
| 023145.8+132254 | 268 | 192 | 073807.3+174218 | 782 | 782 | 134733.3+121724 | 202 | 202 | 193435.0+104340 | 5024 | 5024 |
| 023752.4+284808 | 372 | 350 | 073918.0+013704 | 1216 | 1175 | 135704.4+191907 | 227 | 227 | 193648.0+205136 | 1405 | 1405 |
| 023838.9+163659 | 199 | – | 074533.0+101112 | 840 | 840 | 140501.1+041535 | 280 | 280 | 194606.2+230004 | 2414 | 2414 |
| 024229.1+110100 | 258 | – | 074625.8+254902 | 578 | 559 | 140700.3+282714 | 365 | – | 195005.5+080713 | 2668 | 2668 |
| 025927.0+074739 | 201 | 188 | 075052.0+123104 | 759 | 756 | 141154.8+213423 | 318 | 249 | 203154.9+121941 | 1739 | 1700 |
| 030230.5+121856 | 166 | – | 075706.6+095634 | 708 | 708 | 141558.8+132023 | 170 | 170 | 210138.8+034131 | 608 | 608 |
| 030826.2+040639 | 189 | 172 | 080757.5+043234 | 672 | 513 | 141908.1+062834 | 295 | 291 | 210841.0+143027 | 846 | 779 |
| 030903.6+102916 | 202 | 202 | 081126.7+014652 | 724 | 717 | 141959.2+270625 | 204 | 184 | 211529.4+293338 | 1858 | 1793 |
| 031951.2+190131 | 349 | 287 | 082550.3+030924 | 431 | 431 | 142440.5+263730 | 193 | 193 | 212313.3+100754 | 604 | 604 |
| 032153.1+122113 | 177 | – | 083052.0+241059 | 343 | 303 | 142700.3+234800 | 193 | 174 | 212344.5+053522 | 622 | 622 |
| 032536.8+222400 | 293 | 293 | 083148.8+042939 | 451 | 447 | 143439.7+195200 | 209 | 196 | 213032.8+050217 | 478 | 478 |
| 032635.3+284255 | 361 | 361 | 084205.0+183540 | 364 | 282 | 144516.4+095836 | 283 | 283 | 213638.5+004154 | 464 | 438 |
| 032957.6+275615 | 525 | 494 | 085448.8+200630 | 349 | 244 | 150424.9+102939 | 267 | 259 | 213901.3+142335 | 607 | 607 |
| 033409.9+022609 | 182 | 182 | 090910.0+012135 | 312 | – | 150506.4+032630 | 239 | 239 | 214710.1+092946 | 433 | 433 |
| 033647.2+003516 | 252 | – | 091437.9+024559 | 307 | – | 151340.1+233835 | 271 | 254 | 214805.4+065738 | 448 | 448 |
| 033717.1+013722 | 241 | 241 | 091552.4+293324 | 223 | 196 | 151656.7+193212 | 272 | 272 | 215137.8+055212 | 330 | 330 |
| 034328.8+045802 | 211 | 211 | 095456.8+174331 | 217 | – | 153452.4+013104 | 496 | 496 | 221205.9+235540 | 734 | 696 |
| 034423.1+155943 | 219 | – | 095649.8+251516 | 177 | 177 | 154049.4+144745 | 310 | 293 | 223236.4+114350 | 348 | 348 |
| 034506.4+145349 | 251 | – | 100741.4+135629 | 218 | 218 | 154929.4+023701 | 448 | 448 | 223622.4+282857 | 601 | 581 |
| 040305.5+260001 | 717 | 717 | 101353.4+244916 | 192 | – | 155035.2+052710 | 302 | – | 225307.3+194234 | 395 | 395 |
| 040922.0+121739 | 256 | – | 101447.0+230116 | 156 | 156 | 155930.9+030448 | 383 | 374 | 225357.7+160853 | 278 | 241 |
| 041243.6+230505 | 473 | 418 | 102010.0+104001 | 148 | 148 | 160332.0+171155 | 297 | 297 | 225717.5+024317 | 202 | – |
| 042446.8+003606 | 375 | 375 | 102444.8+191220 | 168 | 165 | 160846.2+102907 | 412 | 412 | 232044.8+051349 | 290 | 266 |
| 042655.7+232739 | 397 | 388 | 103334.0+071126 | 168 | 168 | 160913.3+264129 | 336 | 336 | 232159.8+273246 | 450 | 422 |
| 042952.9+272437 | 189 | 189 | 104117.1+061016 | 163 | – | 161637.5+045932 | 461 | 369 | 233040.8+110018 | 328 | 323 |
| 043103.7+203734 | 428 | – | 104244.6+120331 | 166 | 166 | 161903.6+061302 | 538 | 538 | 234029.0+264156 | 469 | 422 |
| 043337.8+290555 | 681 | 681 | 105148.7+211952 | 205 | – | 162439.0+234512 | 399 | 399 | 234636.8+093045 | 262 | – |

The distribution of stars by magnitude (Fig. 14) shows that the catalogue limiting magnitude is near V=17.0 mag. Note that beyond this limit, some of the faint V17 mag objects in the catalogue may be artifacts appearing due to the low detection threshold. A substantial ratio of very faint stars were not identified with any of the 2MASS, USNO-A2.0 or UNSO-B1.0 objects, which could be related to either variability of stars or false detection. Thus, while 99.3% of stars to 16 mag were found in one of the major catalogues, this ratio drops to 77% for V mag stars, and for yet fainter V mag stars the ratio decreases to 56%. Nevertheless, faint stars were not excluded from the catalogue because of the very low probability of false detections since each star was observed in at least two CCD scans. A very powerful indicator of the detection feasibility is the number of times the star was observed. Thus, among V mag stars observed at least 3 times, the ratio of identifications with external catalogues is 98.3%.

The internal precision of the catalogue was estimated in a somewhat unconventional way, by comparing CCD positions and instrumental magnitudes of stars in those nights when they were observed. The comparison was made with nightly scans transformed to the equivalent scan system (Sect. 3.2). Note that an important feature of this transformation procedure is a scan to scan fitting that works as a filter which completely removes any systematic differences between scans, leaving only random components. This is the reason why the internal precision can be estimated in the way discussed with no use of equatorial positions and V magnitudes computed for each night (this data was never computed). Results presented in Fig. 15 show the equal accuracy of RA and DEC positions.

7.2 External verification of the catalogue
External verification of the KMAC1 positional accuracy was performed using the CMC13 and UCAC2 which are the only all-sky sources of present epoch positions available for faint stars. We computed the r.m.s. differences of KMAC1 positions with the CMC13 and UCAC2 (Fig. 16). The plots that refer to catalogue versions ”T” and ”CU” are very similar. The increase of errors at the bright V12 mag end is caused by oversaturation of images and affects primarily declinations. For fainter magnitudes, the precision of RA and DEC is the same, which is evidence of the good efficiency of various calibrations applied to improve declination data.
Plots shown in Fig. 16 include errors of comparison catalogues and so mark the upper limit of KMAC1 errors. More correct estimation of KMAC1 errors requires use of information on the quality of the comparison catalogues. The data on the external accuracy of the CMC13 is given by Evans et al. (evans (2003)) and formal (internal) errors of the UCAC2 are given by Zacharias et al. (ucac (2004)). With this information, we estimated external KMAC1 positional errors (Fig. 17) separately for the ”T” and ”CU” catalogue versions. The worse quality of the KMAC1-T catalogue is due to problems with reduction to the ICRF system in short CCD scans containing a limited sample of Tycho2 reference stars. Note that external and internal (Fig. 15) errors of the KMAC1-CU are almost equal, which indicates a very good referencing of instrumental positions to the equatorial system.


We were not able to perform a direct external verification of the KMAC1 magnitudes because of the lack of all-sky referencing available for faint stars in the V band. Comparison to the Valinhos photometry (Camargo et al. camargo (2001)) was performed for a 1% subset of catalogue stars and yielded about a 0.1 mag error estimate (see Sect.4).
External photometric errors (Fig. 17) were found considering the dispersion of points in Fig. 10, which are the deviations of V-r′ residuals from the color calibration curve (7). No subtraction of CMC13 photometric errors was applied since for magnitudes fainter than V=16 these errors were found to exceed the r.m.s. KMAC1-CMC13 differences. Thus, at V=16.4 mag (16.0 mag in the r′ band) the r.m.s. KMAC1-CMC13 differences are equal to 0.12 mag while the CMC13 external error is 0.17 mag. Probably, the quality of the CMC13 photometry is better than cited.
Magnitude-dependent systematic errors of KMAC1-CU and KMAC1-T do not exceed mas and mas respectively (Fig. 18.). No clear dependency on magnitude is seen except for a positive hump of plots at V16 mag, and a negative downtrend for the version KMAC1-T in DEC at the bright V11 end.


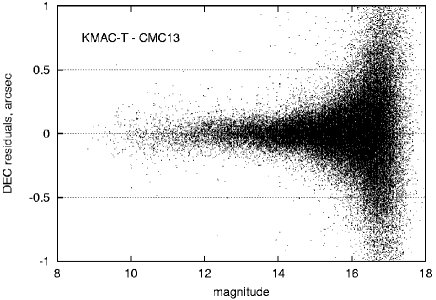
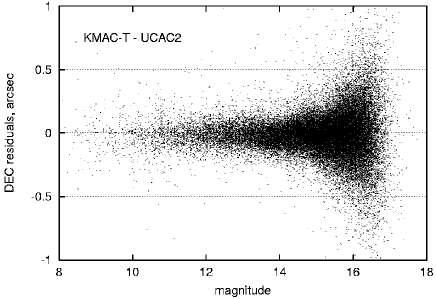
Individual differences between the KMAC1-T star positions and positions in the comparison catalogues CMC13 and UCAC2 are shown in Fig. 19. We present the worst comparison in DEC and the ”T” catalogue version; slightly better plots can be obtained for RA and the KMAC1-CU catalogue version. No systematic trend of individual differences in magnitude is observed.
 |
 |
8 Conclusion
The aim of this work was to obtain a catalogue of faint stars in sky areas with ICRF objects whose declinations are optimal for observations with the MAC. The catalogue contains positions of faint V17 mag objects referred to the optical Hipparcos-Tycho reference frame and thus presents an extension of the ICRF to the optical domain.
The catalogue described in this Paper is the first catalogue obtained with the Kyiv meridian axial circle after it was refurbished with a CCD camera. Realization of this project involved development of special software for image processing, astrometric calibration for instrumental errors etc. A quite unexpected finding was that the measured data (especially the DEC component) is strongly affected by systematic errors even when star images have a relatively good shape. A solution to this problem was found in extensive use of external astrometric catalogues for calibrations.
Another difficulty arose from underestimation of the Tycho2 errors at the present epoch and from the inhomogeneous sky distribution of the catalogue stars. As a result, scan lengths appeared to be too short to allow rigorous reduction to the ICRF and forced us to use other catalogues (CMC13 and UCAC2) for referencing. The use of the Tycho2 catalogue for astrometric work in small fields of about 0.5x0.5∘ or less is thus problematic, and feasible only in some sky areas.
Acknowledgements.
We acknowledge Dr. D.W.Evans important observation concerning photometric calibrations, V.Andruk for his suggestions on the CCD raw data filtering and image processing, and Dr. A.Yatsenko for valuable remarks about proper motion determination. Technical development of the CCD micrometer was carried out by O.Kovalchuk (Nikolaev Astronomical Observatory, Ukraine). This publication makes use of data products from the Two Micron All Sky Survey, which is a joint project of the University of Massachusetts and the Infrared Processing and Analysis Center/California Institute of Technology, funded by the National Aeronautics and Space Administration and the National Science Foundation; the VIZIER database, operated at CDS, Strasbourg, France; the WEBDA database for open cluster; and NASA’s Astrophysical Data System Abstract Service.References
- (1) Camargo, J.I., Teixeira, R., Benevides-Soares, P., & Ducourant, C. 2001, A&A, 375, 308
- (2) Condon, J.J. 1997, PASP, 109, 166
- (3) Cutri, R.M., Skrutskie, M.F., Van Dyk, S. et al. 2003, The 2MASS All-Sky Catalog of Point Sources, IPAC/California Institute of Technology, Massachusetts, http://www.ipac.caltech.edu/2mass
- (4) Evans, D.W., Irwin, M.J., & Helmer, L. 2002, A&A, 395, 347, astro-ph/0209184
- (5) Evans, D.W. et al. 2003, Carlsberg meridian catalogue Number 13, Copenhagen, Cambridge, San Fernando
- (6) Hog, E., Fabricius, C., Makarov, V.V., et al. 2000, A&A, 355, L27
- (7) Irwin, M.J. 1985, MNRAS, 214, 575
- (8) Karbovsky, V.L. 2004, Kinemat. Phys. Celest. Bodies, Suppl., (to be published)
- (9) Kuznetsov, V., Buscombe, W., Boutenko, G., et al. 2003, Kinemat. Phys. Celest. Bodies, Suppl., 4, 165
- (10) Mermilliod, J.C. 2000, WEBDA: a site devoted to stellar clusters, Lausanne, Switzerland, http://obswww.unigue.ch/webda
- (11) Molotaj, O. 2000, in IVS 2000 General Meeting (Koetzting), ed. N. Vandenberg, & K. Baver, NASA, Hanover, 338
- (12) Monet, D., Bird, A., Canzian, B., et al. 1998, A Catalog of Astrometric Standards USNO–A V2.0, U.S. Naval Observatory, Flagstaff, CD-ROM distribution
- (13) Monet, D.G., Levine, S.E., Casian, B., et al. 2003, AJ, 125, 984, astro-ph/0210694
- (14) Stone, R.C., Monet, D.G., Monet, A., et al. 2003, AJ, 126, 2060
- (15) Sung, H., Bessel, M.S. & Lee, S.-W. 1997, AJ, 114, 2644
- (16) Telnyuk-Adamchuk, V., Babenko, Yu., Lazorenko, P., et al. 2002, A&A, 386, 1153
- (17) Vertypolokh, O., Telnyuk-Adamchuk, V., Babenko, Yu., & Lazorenko, P. 2001, ”Extension and Connection of Reference Frames using CCD ground-based Technique”, International astronomical conference, Nikolaev, Ukraine, 247
- (18) Vertypolokh, O., Babenko, Yu., & Lazorenko, P. 2003, in ”Astrometry from ground and from space” (Journees 2002), ed. N. Capitaine, & M. Stavinschi, Bucharest, 231
- (19) Viateau, B., Requieme, Y., Le Campion, J.F., et al. 1999, A&AS, 134, 173
- (20) Whitford, A.E., 1958, AJ, 63, 201
- (21) Zacharias, N., Urban, S.E., Zacharias, M., et al. 2003, AJ, 127, 3043, astro-ph/0403060