11email: demartino@na.astro.it 22institutetext: Service d’Astrophysique, DSM/DAPNIA/SAp, CE Saclay, F-91191 Gif sur Yvette Cedex, France
22email: bonnetbidaud@cea.fr 33institutetext: APC, UMR 7164, University Denis Diderot, 2 place Jussieu, F-75005 and LUTH, Observatoire de Paris, Section de Meudon, F-92190 Meudon, France
33email: martine.mouchet@obspm.fr 44institutetext: Department of Physics, University of Warwick, Coventry CV4 7AL, UK
44email: boris.gaensicke@warwick.ac.uk 55institutetext: Max-Planck-Institüt für Extraterrestrische Physik, Giessenbachstraße, Postfach 1312, 85741 Garching, Germany
55email: fwh@mpe.mpg.de 66institutetext: Observatoire Astronomique, UA 1280 CNRS, 11 rue de l’Université, 67000 Strasbourg, France
66email: motch@astro.u-strasbg.fr
The long period Intermediate Polar 1RXS J154814.5-452845††thanks: Based on observations collected at the European Southern Observatory, La Silla, Chile. Program: 71.D-0195
We present the first time resolved medium resolution optical spectroscopy of the recently identified peculiar Intermediate Polar (IP) 1RXS J154814.5-452845, which allows us to precisely determine the binary orbital period (0.03 hr) and the white dwarf spin period (0.06 s). This system is then the third just outside the purported 6-10 hr IP orbital period gap and the fifth of the small group of long period IPs, which has a relatively high degree of asynchronism. From the presence of weak red absorption features, we identify the secondary star with a spectral type K22 V, which appears to have evolved on the nuclear timescale. From the orbital radial velocities of emission and the red absorption lines a mass ratio is found. The masses of the components are estimated to be and and the binary inclination . A distance between 540-840 pc is estimated. At this distance, the presence of peculiar absorption features surrounding Balmer emissions cannot be due to the contribution of the white dwarf photosphere and their spin modulation suggests an origin in the magnetically confined accretion flow. The white dwarf is also not accreting at a particularly high rate (), for its orbital period. The spin-to-orbit period ratio =0.02 and the low mass accretion rate suggest that this system is far from spin equilibrium. The magnetic moment of the accreting white dwarf is found to be G cm3, indicating a low magnetic field system.
Key Words.:
stars:binaries:close – stars:individual:1RXS J154814.5-452845 – stars:novae, cataclysmic variables1 Introduction
Intermediate Polars (IP) are magnetic
Cataclysmic Variables (mCVs) characterized by strong and hard
( 15 keV) X-ray pulses usually
at the rotational period of the accreting white dwarf (WD)
(). The X-ray
pulsations indicate
that the accretion flow is magnetically channelled towards the WD polar
regions. However, the lack of detectable optical-IR circular polarization
in most of these systems prevents the measure of the WD magnetic
field. It
indicates that the magnetic field of the accreting WD is lower
(B5-10 MG) than that detected in the strongly magnetized
(B10-230 MG) synchronous () polar
systems
(see Warner Warner95 (1995) for a comprehensive review of mCVs).
The orbital periods of IPs are generally long (4 hr), with
only three systems confirmed to be IPs by X-rays
below the so-called 2-3 hr orbital period gap,
whilst the polars are typically found at shorter (4 hr) orbital
periods,
with most systems below the period gap.
The different location of the two subclasses in the orbital
period distribution of mCVs suggests that IPs
will synchronize in their evolution path towards short orbital
periods and hence they might be progenitors of polar systems (Norton et
al. norton04 (2004)). However, the difference in the
magnetic field strengths was the prime reason
for rejecting the hypothesis of IPs evolving into polars, although recent
works on magnetic field evolution in accreting WD might explain the
discrepancy (Cumming Cumming02 (2002)).
The large variety of observational properties found in the
40 or so systems known to date, still need to
be understood in terms of accretion and evolutionary state. In particular
a wide range of asynchronism seems to characterize this class
(Woudt & Warner woudtwarner (2004)). Such a wide range was recently
discussed by Norton et al.
(norton04 (2004)) in terms of spin equilibrium for magnetic accretion,
which can take place on a wide variety of ways ranging from
magnetized accretion
streams to extended accretion discs. Also, in a few systems the presence of a
”soft X-ray” emission component, similar to that observed in the polars
(Buckley Buckley (2000)) raised the evolutionary question of
whether these soft X-ray IPs are the true progenitors of the
polars. Furthermore the apparent lack of IPs in the range of orbital periods
6-10 hr (the so-called ”IP period gap”) was only recently noticed
(Schenker et al. schenker (2004)), with only one recently
discovered system at 7.2 hr
(Bonnet-Bidaud et al. bonnet-bidaud05 (2005)) and
with a handful of long period IPs (Buckley Buckley (2000);
Gänsicke et al. gaensicke05 (2005)), being the most peculiar ever known.
Hence, our understanding of
the evolutionary relationships among mCVs and in particular of IPs
is still very
poor and the addition of new systems and the study of their
properties has a great potential to alleviate this problem.
The X-ray source 1RXS J154814.5-452845 (henceforth RX J1548) was identified as an Intermediate Polar (IP) by Haberl et al. (Haberl02 (2002)) using optical and X-ray observations. The 693 s WD rotational period was identified in both optical and X-ray light curves, whilst sparse optical spectroscopy and photometric data did not allow an unambiguous identification of the orbital period. The two possible values of 9.370.69 hr or 6.720.32 hr, would add RX J1548 to the small group of IPs with long orbital periods, both periods locating it in the IP period gap. Furthermore, RX J1548 possesses a highly absorbed hot black-body soft X-ray component similar to that observed in the IP V2400 Oph, but different from that found in the soft IPs (PQ Gem, V405 Aur) (de Martino et al. demartino04 (2004)) which instead do not suffer from strong absorption. RXJ 1548 is also peculiar in that its optical spectrum, showing broad absorption features underneath Balmer emissions, is similar to those observed in IP V 709 Cas (Bonnet-Bidaud et al Bonnet-Bidaud01 (2001)), which might suggest the contribution of the underlying accreting WD atmosphere (Haberl et al. Haberl02 (2002)).
In this work we present extensive high temporal resolution optical spectroscopy aiming to determine the true orbital period, to elucidate the nature of the peculiar absorption features and that of the stellar components of this binary.
| Date | Start | Spectral Range | N. Spectra | |
|---|---|---|---|---|
| UT | UT | sec | ||
| May 27, 2003 | 01:38:32 | 4038 - 7020 | 90 | 92 |
| May 27, 2003 | 02:38:26 | 5900 - 8600 | 200 | 4 |
| May 28, 2003 | 00:10:56 | 4038 - 7020 | 90 | 160 |
| May 28, 2003 | 01:26:21 | 5900 - 8600 | 200 | 7 |
2 The observations
RX J1548 was observed at the NTT (ESO) telescope on May 27-28, 2003 equipped with the ESO Multi-Mode Instrument (EMMI) in low dispersion mode (RILD). Long slit spectra were acquired in sequences of typically 20 exposures each of 90 s with Grism 5 (4038-7020 ; FWHM resolution: 5.8), alternating red spectra acquired with Grism 6 (5900 - 8600; FWHM resolution: 6.0) with exposure time of 200 s after each sequence. A slit width of 1.5” was used for both grisms. A total of 11 red and 252 blue spectra were obtained. He-Ar lamps were acquired several times before and after each sequence to allow a check of wavelength calibration. The seeing during both nights was rather variable between 0.8” and 1.5” and cirrus was present during the first half of the first night. A few late type template stars in the range between K2V to M4V were also observed with Grism 6.
Standard reduction was performed using the ESO-MIDAS package, including cosmic ray removal, bias subtraction, flat-field correction and wavelength calibration. The wavelength calibration was found to be accurate to 0.2 and 0.1 in the blue and red ranges respectively. Heliocentric corrections were applied to all radial velocities and times of mid-exposure. Furthermore flux calibration was performed using the spectrophotometric standard EG 274. The log of the observations is reported in Table 1.

| Line | EWabs | FWHMabs | FWZIabs | EWem | FWHMem | FWZIem |
|---|---|---|---|---|---|---|
| km s-1 | km s-1 | |||||
| Hδ | 5.7(3) | 36(3) | 5200 | 5.0(2) | 11(1) | 1540 |
| Hγ | 5.9(4) | 67(7) | 5400 | 4.5(3) | 12(1) | 2800 |
| Hβ | 3.8(2) | 53(8) | 5600 | 5.8(2) | 10(1) | 2700 |
| Hα | 11.4(4) | 13 (2) | 2200 | |||
| He II 4686 | 4.6(3) | 14(2) | 2200 | |||
| He I 4471 | 0.5(1) | 8(1) | 1700 | |||
| He I 5875 | 1.9(2) | 11(1) | 1500 |
3 The mean optical spectrum
The average optical spectrum from 4038 to 8600, in Fig. 1 shows the typical emission lines of Balmer, He I ( 7065, 6678, 5875, 5016, 4921 and 4471), He II ( 4686 and 5411) as well as the C III/N III blend ( 4640-4650) and the Ca II triplet ( 8498, 8542 and 8662). The average flux level (V15 mag) was 0.4 mag fainter than when observed in 1998 by Haberl et al. (Haberl02 (2002)). The previously noticed broad absorption features around Balmer emissions have decreasing depth from Hδ to Hβ and are absent around Hα and Helium lines. This could suggest a contribution from the underlying WD atmosphere. In Table 2 we report the measured parameters of the main lines obtained by Gaussian fits. For the Balmer lines we used two Gaussians to account for the absorption and emission components. The FWHMs of absorptions range between 35-70 . When compared to those measured from DA WD model atmospheres (Koester et al. koester (1979)), they do not provide useful constraint on temperature and gravity especially those of Hδ and Hβ lines which have distorted profiles, possibly due to close-by weak emissions. Also, WD model atmosphere fits even for the more symmetric Hγ absorption profile (once the emission component is removed), the WD atmosphere models give a very poor match especially in the line wings, thus making the WD identification unsecure. As it will be shown in sect. 4.2 and discussed in sect. 5.1, a WD origin is furthermore ruled out. Hence, an alternative origin in the accretion flow close to the WD surface is proposed in sect. 5.1.
The red portion of the spectrum presents weak absorptions identified as Ca I ( 5270 and 6162), Na I ( 5889) Mg b at 5170 and metallic lines at 6497 . TiO bands and CaH at 6386 are absent and the Na I near-infrared doublet (( 8183, 8195) is weak and consistent with telluric absorption as well as other strong absorptions in this part of the spectrum (Fig. 1). Following Torres-Dodgen & Weaver (torresdodgen (1993)) classification, these characteristics indicate a main sequence K type star but earlier than K6, and the absence of Ca I ( 6122) is typical of K0-K3 stars.

4 Timing analysis
In order to inspect emission line variability a Gaussian fit was performed to the Balmer and Helium emission lines of each blue spectrum. The measured radial velocities and equivalent widths (EWs) show a clear short term and long term variability. These were then Fourier analysed (excluding 26 spectra at the beginning of the second night as discussed in sect. 4.1) and their DFTs (Discrete Fourier Transforms) are shown in Fig. 2 and Fig. 3. We have furthermore used the CLEAN algorithm (Roberts et al. robertsetal (1987)) to remove the windowing effects in the data which are also visible in the spectral window shown in Fig. 4. The radial velocity power spectrum, once cleaned from windowing, clearly reveals two peaks at =124.6 d-1 and at =2.43 d-1 (Fig. 2). The absence of the beat = 122.17 d-1 signal confirms the former as the rotational frequency of the white dwarf and the latter as the binary orbital frequency. A trend in amplitudes is observed in the Balmer lines, Hα has the strongest peak at the orbital frequency and the weakest peak at the spin frequency, whilst Hδ has the strongest peak at the spin and the weakest at the orbital frequency. He II ( 4686) is also strongly modulated at the spin frequency while He I lines, at 4471 (not shown in Fig. 2) and 5875, show the strongest modulation at the orbital period, similarly to Hα, suggesting a common line forming region. EWs of the same lines were also Fourier analysed and are shown in Fig. 3 together with their CLEANED spectra. The power spectra are much noiser, but reveal that the spin frequency is present in Hα and Hδ and weakly present in Hβ and Hγ, these latter instead show a much stronger signal at the beat frequency. On the other hand the spin and beat modulations are absent in He II, while He I behaves similarly to Hα as also seen in the radial velocities. The orbital modulation is clearly present in the EWs of He II line but not in He I, whilst in Balmer lines an excess of power is present at low frequencies. While the CLEANED spectra might suggest a variability of the EWs of Balmer emission lines at the fundamental and first harmonic of the orbital frequency with a possible anti-correlated behaviour in their strengths moving from Hα to Hδ, the significance of the peaks in the low frequency region is below the 3.
To study the periodic variability in the Balmer absorption components, we also performed a fit to the Balmer lines using two Gaussians in order to reproduce the emission and the absorption components in each blue spectrum. Due to the low signal-to-noise of the individual spectra the fitting procedure failed to reproduce the absorption in of the cases, thus preventing us to detect a periodic signal in the power spectra of both radial velocities and EWs of the absorption components. However, as it will be shown below, the spin and orbital variability can be instead detected once the spectra are binned and phased at these periods.
The continuum was also inspected for periodic variability by performing Fourier analysis on the flux light curve of line-free regions of the spectrum between 4040 and 6800 (Fig. 4). In contrast to the photometric results by Haberl et al. (Haberl02 (2002)), neither the spin nor the beat modulations are detected. The orbital variability appears instead in the CLEANED spectrum, though other peaks in the low frequency portion are present. Similar power spectra are obtained using the whole 4038-7020 range without excluding emission lines. Since only part of the observed signal in the low frequency portion is due to the spectral window (shown in Fig. 4) and as seen in the light curve the spectrophotometry might be affected by the variable seeing which might introduce spurious low frequency behaviour, we limit ourselves to report on the absence of high frequency variations in the continuum with an upper limit of for the spin modulation.
4.1 Radial velocities of emission lines
The radial velocity curves of emission lines were then fitted with a composite two-frequency sinusoidal function plus a constant to account for the orbital and rotational variabilities and velocity respectively. Their best fit sinusoidal functions are shown in Fig. 5. We note that at the beginning of the second night the radial velocities of all emission lines show a blue-to-red excursion (not included in the timing analysis). This is not observed on the first night where a small overlap of orbital phases occurs (i.e. between 0.84-0.89). We checked on O I ( 5677) sky-line the stability of wavelength calibration of the blue spectra in the time interval of the observed drift. The changes amount to 10 km s-1, too small compared to the large excursion of 300 km s-1. Since the red (Grism 6) spectra overlap the Hα region, we also measured the radial velocity of this line on the first red spectrum acquired on that night which shows a consistent excursion as measured on the blue spectra. This measure is marked as an arrow in Fig. 5. Hence, the observed blue-to-red excursion of radial velocities appears to be real. However, given the very small overlap in orbital phases between the first and second night which does not cover the extreme red excursions in the radial velocities, it remains unclear whether this behaviour is due to a transient event or it is related to a regular occurrence at these orbital phases. Remarkably, the line and the continuum fluxes are not affected. Indeed, differently from the radial velocities, neither the EWs nor FWHMs of the same lines as well as the continuum show any anomalous behaviour.
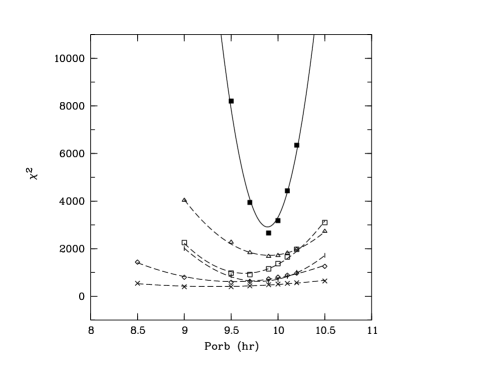
The sinusoidal fits to the radial velocities of emission lines give consistent spin periods within error bars for all lines. We then quote for the spin period the following ephemeris for the time of the maximum redshift: =2452787.33751(1)+0.0080209(7) E, as derived from He II line which displays the largest spin modulation and provides the best fit. The derived spin period = 693.01 0.06 s greatly refines the X-ray and optical values obtained by Haberl et al. (Haberl02 (2002)). In order to derive the orbital ephemeris we have detrended the spin variability from the radial velocities and performed a search in the same emission lines. The most accurate determination is obtained for the strongest Hα line, which also shows the largest modulation, the other lines showing shallower minima (see Fig. 6). The minimum corresponds to a period of 9.87 0.03 hr which gives the following orbital ephemeris for the time of maximum redshift: =2 452786.7561(8)+0.411(1) E.
With the above ephemerides we folded the radial velocities at the two periods in 20 phase bins as shown in the right panels of Fig. 5, previously prewhitening them from the spin and orbital variations respectively. As seen in the Fourier analysis, the largest amplitude of the spin modulation is observed in He II and in Hδ, while the smallest spin variation is observed in Hα, and vice versa for the orbital variation (i.e. the amplitude increases with wavelength). The emission line radial velocity amplitudes, velocities and phases, as derived from the two-sine fits are reported in Table 3.
4.2 Radial velocities of Balmer absorption lines
To search for velocity modulations of the Balmer absorption components, we also folded the spectra at the spin and orbital periods, again excluding those affected by the above mentioned blue-to-red excursion, and fitted the Balmer lines except Hα with two Gaussians to account for the absorption and emission components. The radial velocity curves were then fitted with a sinusoid plus a constant accounting for the velocity. As far as the orbital radial velocity curve is concerned, only the absorption component of Hγ gives a similar amplitude and velocity as observed in the emission component but the phase of maximum redshift occurs before that of the emission (see Table 3). Hβ gives an unacceptable large velocity though a similar amplitude as the emission component. Hδ does not show any orbital radial velocity modulation possibly reflecting the behaviour (smaller amplitude with respect to the other Balmer lines) seen in the orbital radial velocity of the emission component in this line. As for the spin radial velocity curve, Hγ absorption component has a similar velocity as the emission, but it is anti-phased, i.e. the maximum redshift occurs at the maximum blue-shift of the emission component. Again, the velocites of Hδ and Hβ absorption components are unacceptable, but their amplitudes and phases are similar to that of Hγ, and similarly 180 degrees out of phase with the emission radial velocities. The radial velocities of the absorption components are also shown in Fig. 5. A word of caution is needed for the velocities, since these result from the combination of the systemic velocity and the velocity of the spin emitting region (probably different for the different lines) which cannot be separated in our sinusoidal fits. This might be even more crucial for the absorption components, which give a large discrepancy in the velocity values, if they originate in a further different region with respect to that of emission lines. Hence we refrain from interpreting these results.
| Line | K | Phase | K | Phase | ||
|---|---|---|---|---|---|---|
| km s-1 | km s-1 | km s-1 | km s-1 | |||
| Orbital Period | ||||||
| Hδ | -58(4) | 54(4) | 0.031(2) | - | - | - |
| Hγ | -60(2) | 67(3) | 0.025(2) | -58(13) | 118(19) | -0.07(2) |
| Hβ | -63(2) | 80(3) | 0.014(1) | -540(14) | 62(20) | -0.19(5) |
| Hα | -49(4) | 103(2) | 0.000(1) | |||
| He II 4686 | -58(2) | 58(3) | 0.046(3) | |||
| He I 5875 | -50(2) | 102(3) | -0.027(2) | |||
| Spin Period | ||||||
| Hδ | 66(4) | 0.025(2) | 200(25) | 190(33) | -0.45(3) | |
| Hγ | 51(3) | 0.030(2) | -64(11) | 89(17) | -0.51(2) | |
| Hβ | 30(3) | 0.050(2) | -545(14) | 100(18) | -0.41(2) | |
| Hα | 12(1) | 0.002(4) | ||||
| He II 4686 | 95(3) | 0.000(1) | ||||
| He I 5875 | 22(3) | -0.043(5) |
⋆ Radial velocity curve parameters of emission lines as derived from fitting with a composite two-sine (orbital and spin) plus a constant function the radial velocities on the individual spectra.
⋆⋆: Radial velocity curve parameters of absorption components as derived from fitting with a single sine plus a constant function the radial velocities on the phase folded spectra at the spin and orbital periods respectively.
Phase of maximum redshift using the orbital and spin ephemerides quoted in the text.
4.3 Radial velocities of the secondary star
The red spectra containing several weak absorption features ascribed to the donor star were used to determine radial velocity variations. We used the range 5910-6520 , free from emission lines and masking the telluric line at 6280 and cross-correlated with a set of late type star template spectra covering spectral types between G9 and K5 and luminosity class V and III. Since the few template stars observed with Grism 6 do not cover the whole range of spectral types and luminosity class, we used further spectra taken from the Jacoby library (Jacoby et al. jacobyetal84 (1984)). The cross-correlation functions were then used to obtain the radial velocity curves shown in Fig. 7. These curves were fitted with a sinusoid and the results are reported in Table 4. Similar quality fits are found for a K4III (=1.01), for a K2V (=1.05) and for a K5V star (= 1.07). Amplitudes in these fits are consistent within their 1- errors. The values are not reported since Jacoby library spectra have unknown epoch of observations. Worth noticing is the phasing of maximum redshift, which precedes the emission line maximum blue shift by 0.1, but it is in phase with the maximum blueshift of Hγ absorption. We also performed similar cross-correlation on the same range in the blue spectra binned in 10 orbital phases and found similar results. Hence, the radial velocities derived from cross-correlation unambiguously map the donor star orbital motion with amplitude in the range 100-143 km s-1, though these do not provide strong constraints on its spectral type. Roche geometry and Kepler’s law for a binary orbital period of 9.87 hr gives a secondary mean density of 0.78, much larger than that of giants (Schmidt-Kaler schmidtkaler (1982)) and subgiants (Dworak dworak (1985)) and hence a main sequence star is adopted (but see Sect. 5).
| Sp. Type | Ksec | Phase1 | |
|---|---|---|---|
| km s-1 | |||
| G9 V | 12715 | 0.44(3) | 3.10 |
| K0 V | 12716 | 0.44(2) | 2.85 |
| K2 V | 1337 | 0.41(1) | 1.05 |
| K4 V | 10216 | 0.46(5) | 2.07 |
| K5 V | 1439 | 0.41(1) | 1.07 |
| G9 III | 12410 | 0.43(2) | 2.34 |
| KO III | 10713 | 0.41(3) | 1.70 |
| K4 III | 1339 | 0.41(1) | 1.01 |
1: Phase of maximum redshift using the orbital ephemeris quoted in the text.

5 Discussion
Our new spectroscopy on RX J1548 allows us to precisely determine the orbital period of this binary, =9.870.03 hr, which locates it at the far end of the observed orbital periods of IPs. RX J1548 thus joins V 1062 Tau (9.95 hr), AE Aqr (9.88 hr) as a third system just outside the claimed IP period gap, with only RX J2133.7+5107 (Bonnet-Bidaud et al. bonnet-bidaud05 (2005)) inside it, and as a fifth member of the long period IP group when including the old nova GK Per (47.9 hr) and the recently discovered IP RX J173021.5-0559 (15.4 hr) (Gänsicke et al. gaensicke05 (2005)). While the previously known long period IPs show strong variability (low states, outbursts or flares), RX J1548 and RX J173021.5-0559 are not known yet to show peculiar behaviour. For RX J1548 we can only quote a possibly transient variability in the emission line radial velocities and a long term change in the flux level of 0.4 mag on a five years timescale. Clearly long term monitoring of this southern system is needed to characterize its long-term behaviour.
The 693 s modulation is detected in the radial velocities of emission lines thus greatly refining (0.06 s) the previously detected X-ray and optical photometric periods and confirming it as the spin period of the accreting WD. Though the data might be partially affected by slit losses a strong spin variability does not seem to be present in the continuum during our observing run in 2003, contrary to the photometric observations of Haberl et al.(Haberl02 (2002)). The presence of the spin period in the radial velocities and the absence of any beat modulation confirms that the WD accretes via a disc.
EWs of Balmer and He I emission lines show weak indication of spin modulation which is absent in the EWs of He II line. On the other hand the amplitudes of the spin radial velocity curves are largest for He II and smallest for Hα. All this might indicate that the emission lines originate in an optically thin region of the accretion flow onto the WD, with He II forming in a more localized region. The lack of spectral coverage of the Balmer jump hampers an estimate of the optical thickness of the spin modulated line forming region.
5.1 The stellar components and system parameters
The donor star in RX J1548 is detected from red absorption features in its spectrum and their identification suggests a spectral type between K0-K3 V. Using the empirical CV period-spectral type relation of Smith & Dhillon (smithdhillon (1998)), for an orbital period of 9.87 hr a G9 is expected, consistent with our findings. We then adopt for secondary star in RX J1548 a K22 V type. From the ratio of EWs of absorption lines at 6162 and at 6490 and those of K0-K4 type standards, the contribution of the stellar flux to the total observed flux at 6100 continuum is estimated to be 203. For a K22 V star the absolute magnitude is in the range =5.9-7.0 mag. This yields a distance in the range 770-1200 pc. X-ray data give an hydrogen column density , which provides an upper limit to the interstellar extinction in the direction of the source. Haberl et al. (Haberl02 (2002)) estimate then thus lowering the distance to 540-840 pc. This estimate of the distance can be used to provide a constraint on the WD flux contribution. For distances in the range 770-1200 pc, the WD flux is only 1-4 of the observed flux at Hγ continuum. This amounts to 3-4 when distance is 540-840 pc, taking into account the extinction. This implies that the Balmer absorption features cannot be safely ascribed to the WD atmosphere. The orbital radial velocity curve of Hγ absorption is out of phase by most exactly 180o with that of the secondary star, thus indicating that the absorption line forming region is located very close to the WD surface. This conclusion is also consistent with the fact that the Hγ absorption curve is also closely in phase with the emission line orbital radial velocities, but preceding them by 0.1 in phase. Moreover, its spin radial velocity curve is anti-phased with respect to that of emission lines, suggesting an optically thick region offset by 180o from the main accreting pole where the emission lines are formed. This region could be the accretion flow onto the opposite pole. However, this possibility does not explain the larger widths of the Balmer absorption components with respect to the emission components. An origin in the WD atmosphere is difficult not only because the estimated WD contribution to the total observed flux is negligible, but also because no radial velocity motion at the WD rotational period is expected. Though an origin in the disc cannot be excluded, as this would produce an orbital radial velocity curve with similar amplitudes and phases as observed in the emission lines (especially taking into account that the system has a very long period and probably it is a low inclination binary (see below)), a spin radial velocity curve cannot be accounted by a disc and the system is not accreting at a high mass rate (see sect. 5.2), needed to produce optically thick absorption lines. A further alternative possibility is that the Balmer absorption components originate in an accretion halo similarly to what observed in some Polar systems like V834 Cen, MR Ser and EF Eri (Achilleos et al. Achilleos92 (1992), Schwope et al. Schwope93 (1993), Wickramasinghe & Ferrario Wickra00 (2000)). In these Polars broad Zeeman-shifted absorption components of Balmer lines are seen during high mass accretion states and during the bright cyclotron-dominated phases and arise from a cool halo of unshocked gas surrounding the accretion shock close to the WD surface. The magnetic accretion halo scenario could account for the large widths of absorption components in RX J1548 since the FWHMs of Hβ and Hγ absorptions, if interpreted as unresolved and Zeeman components, would imply a magnetic field strength 2-4 MG. However, at these magnetic field strengths these components should be clearly resolved in Hα line. If the accretion halo is optically thick, as seen in higher Balmer lines, the absorption in Hα should be stronger because the ratio of the oscillator strengths of the components of Hα and Hβ is 8 (Wickramasinghe et al. Wickram87 (1987)). But no absorption features are observed close to Hα in either the average spectrum or the spin phase-resolved spectra. The FWZI of Hα emission line instead would imply a magnetic field lower than 1 MG, to mask the Zeeman absorption components. Furthermore, phase-dependent redshifts of these components were observed in some of these Polars (maximum redshift when viewing along the magnetic field lines) due to Doppler effect in the free-falling accretion flow and/or by variations in the effective field strength. An anti-phased spin behaviour of the absorption features with respect to the emission lines as detected in RX J1548 would then imply a complex accretion halo structure at the secondary pole. Finally, if an accretion halo is present in RX J1548, this system should reveal a relatively strong polarized emission. Hence, while different scenarios could be envisaged, they do not simultaneously explain the observed Balmer absorption characteristics and a satisfactorly explanation should await future spectropolarimetric observations.
Though caution has to be taken to ascribe emission line radial velocities as tracers of the WD orbital motion, as they can originate in different regions within the binary system, the fact that the Balmer absorption amplitudes are, to within error, consistent with the emission lines gives support to their use in the radial velocity solutions for mass determination. We then adopt conservatively the wide range = 54-102 km s-1. For the K22 V secondary we adopt: =102-133 km s-1 and then the mass ratio is =0.53-0.77. This ratio limits the WD and secondary star masses in the mass-inclination plane, giving = 0.210.10 M⊙ and = 0.140.09 M⊙, as depicted in Fig. 8. The condition that the WD cannot be larger than the Chandrasekhar value implies that and since no eclipses are observed, . Although the dynamical solution gives a wide secondary mass range, the secondary spectral type (K0 to K4), adopting the main sequence mass-spectral type relation (Schmidt-Kaler schmidtkaler (1982)), is used to define the two horizontal lines in Fig. 8. These limit the component masses to and and restricts the inclination in the range . From the mass ratio, the secondary star Roche lobe dimension can be determined (/), giving =, where is the binary separation. For the inclination under consideration and using the secondary star radial velocity amplitude, this gives . A comparison with the mass-radius relation for low mass main sequence stars (Baraffe et al. baraffe (1998)), indicates that the secondary star on average has a radius larger than that of a main sequence star of comparable mass. As discussed by Beuermann et al. (Beuermannetal (1998)), donor stars in the long period CVs are typically cooler than ZAMS stars with the same mass and their position in the spectral type-orbital period plane (cf. their Fig. 5) indicates evolved secondaries. The derived orbital period and the secondary spectral type locate RX J1548 in that diagram close to evolved models of stars at the end of core hydrogen burning, thus suggesting that the donor has undergone substantial nuclear evolution. Furthermore, Kolb et al. (kolbetal01 (2001)) demonstrated that the mass of a ZAMS star with the same spectral type as the donor should be considered as an upper limit, while the lower limit depends on the still uncertain mixing length parameter. For spectral types earlier than K6, however, a lower limit can be set, which decreases the ZAMS mass by 0.3 for a spectral type between K0 and K4. Hence, because RX J1548 appears to host an evolved secondary, we conservatively adopt and then and .

5.2 Magnetic accretion
With our period determination, the spin-orbit ratio of 0.02 indicates a high degree of asynchronism. For comparison, the other IPs with similar orbital periods have very different degrees of asynchronism: AE Aqr with the extreme =0.00093 and V1062 Tau with the typical value found in most IPs =0.10) (see also King & Lasota kinglasota (1991)). RX J1548 is thus an intermediate system among the two, whose rotational equilibirum needs to be investigated. We thus evalute the corotation radius at which the magnetic field rotates at the same rate as the Keplerian frequency . For a WD with and =693 s, cm. The condition for accretion will require where cm, where is the WD radius (in units of cm), is the luminosity (in units of ) and is the magnetic moment (in units of G cm3). Haberl et al. (Haberl02 (2002)) derive an unabsorbed flux of 3.3 for the optically thin emission component, and a bolometric blackbody flux of which allow to estimate the accretion luminosity erg s-1, where is the distance in units of 100 pc. The condition for accretion at spin equilibrium, using the above WD mass range, then requires a magnetic moment G cm3. For a spin-to-orbit period ratio of 0.02 and an orbital period of 9.87 hr the magnetic model of spin equilibria by Norton et al. (norton04 (2004)) predicts a magnetic moment , for , which, is larger than what estimated above even allowing a 40 variation of magnetic moment for . For such high magnetic moment the condition of spin equilibrium would imply an accretion rate . However, from the luminosity obtained from X-rays, we estimate a mass accretion rate , which is also much lower than the secular value for a CV with a 9.87 hr orbital period (Norton et al. norton04 (2004)). Hence RX J1548 is probably far from equilibrium and the WD appears to possess a weak magnetic field strength. This was also noticed independently by Haberl et al. (Haberl02 (2002)) as this IP possess a soft X-ray component with a moderate ratio (46) of blackbody-to-hard X-ray luminosity when compared to other soft X-ray/high magnetic field IPs (de Martino et al. demartino04 (2004)).
6 Conclusions
Our optical spectroscopy of RX J1548 has allowed to refine the orbital and WD spin periods detected by Haberl et al. (Haberl02 (2002)) and to derive information on this binary as follows:
-
•
The orbital period of 9.87 hr locates RX J1548 just outside the IP period gap, thus joining other four long period systems (AE Aqr, V1062 Tau, RX J173021.5-0559 and GK Per). Because of lack of long term monitoring, we are unable to assess whether RX J1548 also shows a peculiar optical behaviour as observed in the well monitored AE Aqr, V1062 Tau and GK Per. We only detect a strong variability in the radial velocities of emission lines and a long term luminosity variation on a five years timescale.
-
•
The 693 s spin period is detected in the radial velocities of emission lines and of the absorption of Balmer lines. Though not truly spectrophotometric, our data do not reveal a strong spin or beat periodicity in the continuum contrary to previous photometric observations.
-
•
From weak absorption features in the red portion of the spectrum we identify the spectral type of the secondary star as a K22 V. The orbital period and the spectral type suggest that the donor star in RX J1548 has undergone nuclear evolution as also found in other long period CVs.
-
•
The amplitude of the orbital radial velocites of emission and weak absorption lines allows us to determine the mass ratio . From the secondary star spectral type, allowing for uncertainties in the mass-spectral type relation for CV donors, we find and and a binary inclination .
-
•
We estimate the distance in the range 540-840 pc which limits to only 3-4 the contribution of the WD to the observed flux at Hγ continuum and to 20-25 the contribution of the secondary star at 6100 . This implies that the observed absorption features underneath Balmer emissions are not due to the WD atmosphere. RX J1548 is not accreting at a high rate which does not favour an optically thick disc as instead observed in high transfer rate systems such as dwarf novae during outbursts or in SW Sex stars. The observed orbital and spin radial velocities of Hγ absorption instead suggest an origin in the accretion flow close to the WD surface which needs further investigation via spectropolarimetric observations.
-
•
The spin-to-orbit period ratio =0.02 suggests that this system is probably far from equilibrium. Also, the WD appears to be weakly magnetized with 2 MG, much lower than typical values found in the other known soft X-ray/highly polarized IPs. Polarimetric observations are then needed to clarify whether this system really contains a low field WD.
Acknowledgements.
DdM acknowledges financial support by the Italian Ministry of University and Research (MIUR). BTG was supported by a PPARC Advanced Fellowship.References
- (1) Achilleos, N., Wickramasinghe, D.T.& Wu, K. 1992, MNRAS 256, 80.
- (2) Baraffe, I., Chabrier, G., Allard, D., & Hauschildt, P.H. 1998, A&A 337, 403.
- (3) Beuermann, K., Baraffe, I., Kolb, U. & Weichhold, M. 1998, A&A 339, 518.
- (4) Bonnet-Bidaud, J.-M., Mouchet, M., de Martino, D., Matt, G. & Motch, C. 2001, A&A, 374, 1003.
- (5) Bonnet-Bidaud, J.-M., Mouchet, M., de Martino, D., Silvotti, R. & Motch, C. 2005, A&A, in press.
- (6) Buckley, D.A.H. 2000, New AR, 44, 63.
- (7) Cumming, A. 2002, MNRAS, 333, 589.
- (8) de Martino, D., Matt, G., Belloni, T., et al. 2004, A&A, 415, 1009.
- (9) Dworak, T.Z. 1985, AcA, 35, 109.
- (10) Haberl, F., Motch, C., & Zickgraf, F.-J. 2002, A&A, 387, 201.
- (11) Gänsicke, B.T., Marsh, T.R., Edge, A., et al. 2005, MNRAS 361, 141.
- (12) Jacoby, G.H., Hunter, D.A., & Christian, C. 1984, ApJS, 56, 257.
- (13) King, A.R., & Lasota, J.-P. 1991, ApJ, 378, 674.
- (14) Koester, D., Weidemann, V., & Schulz, H., 1979, A&A, 76, 262.
- (15) Kolb, U., King, A.R., & Baraffe, I. 2001, MNRAS 324, 544.
- (16) Norton, A.J., Wynn, G.A., & Somerscales, R.V. 2004, A&A, 614, 349.
- (17) Roberts, D.H., Lehar, J. & Dreher, J.W. 1987, AJ, 93, 968
- (18) Schenker, K., Wynn, G.A., & Speith, R. 2004, in ASP Conf. Ser. 315, Magnetic Cataclysmic Variables, ed. S. Vrielmann & M. Cropper (IAU Coll.190; San Francisco: ASP), 8.
- (19) Schmidt-Kaler, Th. 1982, in Landolt & Börnstein, Vol. 2, p.1.
- (20) Schwope, A., Beuermann, K., Jordan, S., & Thomas, H.-C. 1993, A&A 278, 487.
- (21) Smith, D.A., & Dhillon, V.S. 1998, MNRAS, 301, 767.
- (22) Torres-Dodgen, A.V., & Weaver, W.B. 1993, PASP, 105, 720.
- (23) Warner, B. 1995, Cataclsymic Variables, (Cambridge University Press, Cambridge).
- (24) Woudt, P.A., & Warner, B. 2004, in ASP Conf. Ser. 315, Magnetic Cataclysmic Variables, ed. S. Vrielmann & M. Cropper (IAU Coll.190; San Francisco: ASP), 39.
- (25) Wickramasinghe, D.T., Tuohy, I.R., & Visvanathan, N. 1987, ApJ 318, 326.
- (26) Wickramasinghe, D.T., & Ferrario, L. 2000, PASP 112, 873.