An observational survey of molecular emission ahead of Herbig-Haro objects
Abstract
Context. A molecular survey recently performed ahead of HH 2 supports the idea that the observed molecular enhancement is due to UV radiation from the HH object.
Aims. The aim of the present work is to determine whether all HH objects with enhanced HCO+ emission ahead of them also exhibit the same enhanced chemistry as HH 2. We thus observed several molecular lines at several positions ahead of five Herbig-Haro objects where enhanced HCO+ emission was previously observed.
Methods. We mapped the five Herbig-Haro objects using the IRAM-30 m. For each position we searched for more than one molecular species, and where possible for more than one transition per species. We then estimated the averaged beam column densities for all species observed and also performed LVG analyses to constrain the physical properties of the gas.
Results. The chemically richest quiescent gas is found ahead of the HH 7-11 complex, in particular at the HH 7-11 A position. In some regions we also detected a high velocity gas component. We find that the gas densities are always higher than those typical of a molecular cloud while the derived temperatures are always quite low, ranging from 10 to 25 K. The emission of most species seems to be enhanced with respect to that of a typical dense clump, probably due to the exposure to a high UV radiation from the HH objects. Chemical differentiation among the positions is also observed. We attempt a very simple chemical analysis to explain such differentiation.
Key Words.:
ISM: Herbig-Haro objects — ISM: abundances — ISM: clouds — ISM: molecules — Radio lines: ISM — Stars: formation1 Introduction
Herbig-Haro (HH) objects are regions where protostellar jets interact hydro-dynamically with the surrounding molecular cloud, resulting in strong atomic line emission characteristic of shocks. There is now ample and increasing evidence that HH objects also have a less direct but very diverse chemical influence on nearby molecular clumps which have not yet been reached completely by the flow itself. In fact, the radiation generated in the HH objects, as well as the shocks produced by the HH objects alter the chemical composition of the molecular gas surrounding them in a very complex way. An example of the complex interaction of the HH object with its surroundings, and the most studied one, is the HH 2 region (e.g. Girart et al. (2002); Dent et al. (2003); Lefloch et al. (2005); Girart et al. (2005)). Some of the gas ahead of the HH object seems to be altered solely by the UV radiation: in the last decade or so quiescent, cold, molecular condensations have been found ahead of several HH objects. These cool condensations were found in enhanced emission of HCO+ and NH3, which are tracers of high density gas (e.g. Rudolph et al. (1988); Torrelles et al. (1992); Girart et al. (1994)). These emissions probably arose because the UV radiation generated in the HH shock evaporated the icy mantles on dust grains in small density enhancements in the cloud near to the head of the jet (Girart et al. (1994)). Theoretical and further observational studies (Viti & Williams (1999), hereafter VW99; Viti et al. (2003) and Girart et al. (2005)) confirmed this picture and showed that, because of the quiescent nature of such clumps (clear from the linewidths of the emission as well as the derived kinetic temperature of the gas), the high abundances of HCO+ and other species could not be due to shock chemistry.
In this paper, we are particularly interested in these anomalous, quiescent enhanced molecular emissions from localized regions in the vicinity of the HH objects. The VW99 models succeeded in explaining the known enhancements of HCO+ and NH3 relative to CS, predicted the amount by which these species should be increased, but also indicated other species which should be enhanced (by factors of 10–200 with respect to dark molecular clouds e.g L1554), in particular CH3OH, H2S, SO, SO2, H2CO, C3H4, H2CS. Such predictions were confirmed by recent observations and further modelling of HH 2 (Girart et al. (2002), Viti et al. (2003); Girart et al. (2005)). It is important to note however that while single dish observations (Girart et al. (2002), Viti et al. (2003)) show that the chemistry of the illuminated clumps ahead of the HH 2 object is essentially consistent with the UV field from the HH 2 front releasing the grain mantles and hence enhancing the gas chemistry, BIMA maps of such region in several molecules expected to be enhanced (Girart et al. (2005)) have shown how the HH 2 object affects the chemistry and dynamic of the surrounding environment in different degrees. In summary, although Girart et al. (2005) concluded that a very complex morphological kinematical and chemical structure of the molecular gas is present ahead of the HH 2 object, they also confirmed that there is indeed an apparently quiescent molecular component that is more exposed to the UV radiation from the HH 2 front; the analysis of observational molecular lines from this region can be explained by UV radiation from the HH shock lifting the ice mantles from grains of a multi-density component clump and the consequent chemistry that arises is as complex and varied as indicated in the VW99 models.
The question we attempt to answer in this paper is the following: is the rich photochemistry characteristic of UV illumination peculiar to the HH 2 or is it common to all HH objects? The simplest and most direct way to answer such question is to perform a survey of molecular species predicted to be enhanced by the VW99, ahead of several HH objects where enhanced quiescent HCO+ and/or NH3 have already been detected. We have now performed such a survey with the IRAM 30-meter and we report the observational results in this paper. The main aims of this paper are: 1) determine whether other HH objects exhibit the same peculiar enhanced chemistry of HH 2 as predicted by VW99 and 2) assuming the HH object to be the source of the UV radiation, look for correlations between the enhanced molecular emission and the distance of such emission to the HH object.
We report our observations in § 2; in § 3 we present our results and the derivation of beam averaged column densities. In § 4 we analyse our data by means of radiative transfer modelling. In § 5 we briefly discuss the chemical characteristics of the gas and in § 6 we summarize our findings.
2 Observations
The observations were carried out with the IRAM 30 m radio telescope on Pico Veleta in November 2000. Our sample consisted of five Herbig Haro regions; for most of them we took several positions where enhanced HCO+ was previously detected (see individual subsections and Table 1). For each position we searched for several molecular emissions; when possible we searched for more than one transition of the same species (see Table 2). The molecular species chosen are those which were expected from VW99 models to be enhanced (with respect to dark molecular clouds) by reasonably large factors, along with tracers of the underlying column density in the cloud (CS and CO isotopes) and tracers of the ionization (the ratio DCO+/HCO+; Caselli et al. (1998)). Due to time constraints, we could not attempt to detect all the species predicted by the VW99 at every position. Our criteria varied from object to object but in general if HCO+ emission was weak we did not attempt a detection in other species. We also prioritized species easier to observe, so for example, although both SO and SO2 are predicted by the models to be enhanced we concentrated on SO as its lines are usually stronger and also it has a higher predicted abundance. All the transitions were observed in the frequency bands of 100, 150, 230 and 270 GHz (see Table 2 for line frequencies). Integration times were typically 2-12 minutes (position switched), with longer attempts at detecting weak lines (e.g. NS: 30 mins). The spectral resolution was 40 kHz (100/150 GHz bands) or 80 kHz (230/270 GHz bands) resulting in a velocity resolution typically of 0.05 km/s and at most 0.13 km/s. The bandwidth was at least 20 MHz (100/150 GHz bands) or 40 MHz (230/270 GHz bands). Conditions were generally poor and variable for winter nights with 1–6mm PWV (precipitable water vapour). Resulting system temperatures were T, 200–460, 200–300 and 400-700 K for the 100, 150, 230 and 270 GHz bands respectively, depending on frequency and weather. Pointing was good to within 4. Spectra were corrected for the beam efficiencies , 0.69, 0.51, and 0.42 in the 100, 150, 230, and 270 GHz bands respectively. The 30m beam FWHM ranges as from at 86 GHz down to at 230 GHz. See on-line Tables 6 to 10 for details of the molecular transitions observed.
| Object | RA | DEC | VLSR |
|---|---|---|---|
| J2000 | J2000 | kms-1 | |
| HH 7–11 A | 03:29:06.5 | 31:15:35.5 | +8.0 |
| HH 7–11 B | 03:29:06.9 | 31:15:47.4 | +8.0 |
| HH 7–11 X | 03:29:05.7 | 31:15:30.5 | +8.0 |
| HH 1 | 05:36:20.2 | 06:45:01.3 | +9.0 |
| HH 34 A | 05:35:34.3 | 06:29:07.0 | +8.5 |
| HH 34 C | 05:35:32.2 | 06:29:04.9 | +8.5 |
| HH 34 D | 05:35:32.0 | 06:29:23.9 | +8.5 |
| HH 34 E | 05:35:30.6 | 06:29:03.8 | +8.5 |
| JMG 99 G1 | 06:41:04.5 | 09:56:02.0 | +4.6 |
| JMG 99 G2 | 06:41:07.1 | 09:56:07.0 | +4.0 |
The choice of our sample of objects was made by selecting all the HH objects with known HCO+ emission enhancements. For some objects, we detected two velocity components in several species: a high velocity one, probably coming from the closest part to the HH object where the gas has already been dynamically affected; and an ambient one. In this paper we will mainly concentrate on the latter.
|
||||||||||||||||||||||||||||||||||||||||||||||||||||||||||||||||||||||||||||||||||||||||||||||||||||||||||||||||||||||||||||||||||||||||||||||||||||||||||||||||||||||||||||||||||||||||||||||||||||||||||||||||||||||||||||||||||||||||||||||||||||||||||||||||||||||||||||||||||||||||||||||||||||||||||||||||||||||||||||||||||||||||||||||||||||||||||||||||||||||||||||||||||||||||||||||||||||||||||||||||||||||||||||||||||||||||||||||||||||||||||||||||||||
-
a
Abbreviation of NGC 2264G JMG1 and JMG2
-
b
20–10 A+ transition.
-
c
30–20 A+ transition.
-
d
50–40 A+ transition.
| MOL. | 7-11A | 7-11X | 7-11B | HH34 A | HH34 E | HH34 C | HH34 D | HH 1 | JMG 99 G2 | HH 2 |
| COa | 2.6(18) | 2.3(18) | 2.1(18) | 1.9(18) | 1.4(18) | 1.3(18) | 1.2(18) | 3.5(18) | 3.7(17) | 3.3(17) |
| 13CO | 4.6(16) | 4.0(16) | 3.7(16) | 3.0(16) | 2.2(16) | 2.0(16) | 1.9(16) | 5.5(16) | 6.5(15) | – |
| CH3OH | 3.5(14) | 4.1(14) | — | 2.9(13) | 4.9(13) | — | — | 5.6(13) | 9.8(13) | 6.2(13) |
| HCO+b | 2.0(14) | 1.6(14) | 2.2(14) | 1.2(13) | 3.3(13) | 1.7(13) | 9.7(12) | 2.1(13) | 5.0(12) | 4.0(13) |
| H13CO+ | 2.3(12) | 1.8(12) | 2.5(12) | 1.5(12) | 4.2(12) | — | — | 2.6(12) | 6.0(11) | – |
| SO | 8.5(13) | 8.6(13) | — | 8.2(12) | 1.7(13) | — | — | 1.7(13) | 1.6(13) | 1.7(13) |
| H2COc | 9.3(13) | 9.6(13) | — | 1.0(13) | 1.1(13) | — | — | 1.6(13) | — | 9.0(13) |
| CS | 6.0(13) | 6.2(13) | 5.9(13) | 6.8(12) | 8.2(12) | 6.2(12) | 5.6(12) | 1.0(13) | 1.1(13) | 2.0(12) |
| H2S | 5.0(13) | 4.7(13) | 4.5(13) | — | — | — | — | 1.2(13) | 6.0(12) | – |
| C3H4 | 5.7(13) | — | — | — | 2(13) | — | — | — | — | – |
| HCN | 2.3(13) | 1.6(13) | — | 6(11) | 6(11) | — | — | 1.8(12) | 7.8(12) | 2.8(12) |
| OCS | 2.1(13) | — | — | — | — | — | — | — | — | – |
| H2CS | 1.1(13) | — | — | — | 2(12) | — | — | — | — | – |
| C3H2 | 8.9(12) | 8.4(12) | — | — | 8.5(11) | — | — | — | — | – |
| NS | 7.8(12) | — | — | — | 5(12) | — | — | — | — | – |
| DCO+ | 5.0(12) | 3.6(12) | — | 3.8(11) | 2.9(11) | — | — | 1.9(11) | 2.2(11) | 7.8(11) |
| HCS+ | 2(12) | — | — | — | — | — | — | — | — | – |
-
a
Optical depth of HH 7–11 B adopted from HH 7–11 X, and of HH 34 C and HH 34 D adopted from HH 34 E.
-
b
Optical depth of HH 34 C and HH 34 D adopted from HH 34 E.
-
c
Adopted an ortho/para ratio of 1.5
2.1 Brief description of the sources
2.1.1 HH 7–11
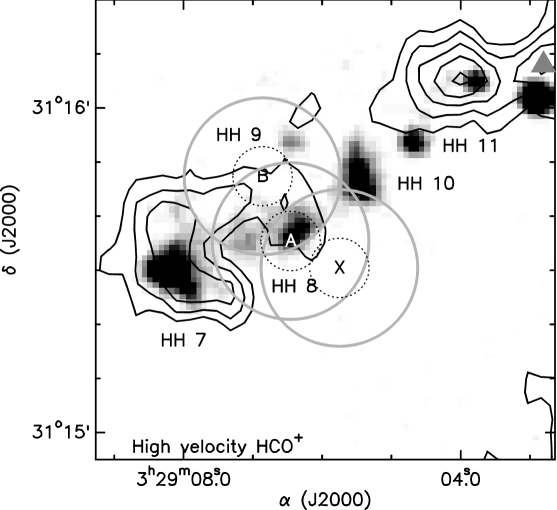
The HH 7-11 system (d 220 pc: Cernis (1990)) consists of fairly low excitation HH objects, with HH 7 being at the far end of the outflow (Solf et al. (1987)). However, the region surrounding HH 7–11 is very rich in young stellar objects (e.g. Rodríguez et al. 1999), hence the total radiation impinging on the surroundings is unknown. Enhanced HCO+ 1–0 emission has been previously observed just ahead of HH 8–10 objects in the form of small clumps with 7′′ sizes (1500 AU, Rudolph et al. (1988)). CS and NH3 (Rudolph et al. (2001)) are also reported towards these clumps. Submillimeter observations in the region reveal a dust source, HH 7–11 MMS 4, that engulfs the HCO+ clumps (Chini et al. (2001)). From the dust observations Chini et al. (2001) derive that the total mass of the quiescent gas around HH 8–10 is 4.0 M⊙. From the study of the HCO+ 3–2 emission, Dent et al. (1993) suggest that the dense molecular gas and dust around HH 8–11 is the densest, slowest component of the outflow. This is somewhat similar to the picture of the molecular gas ahead of HH 2 (Girart et al. (2005)).
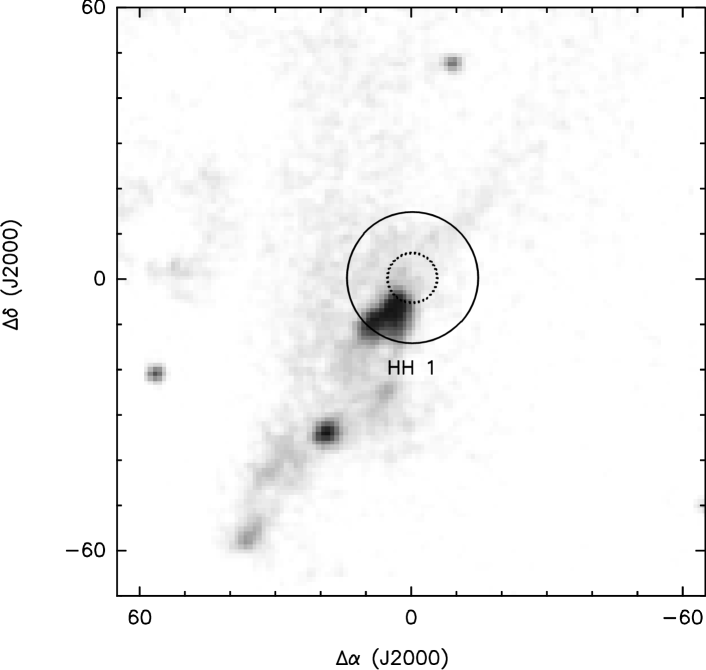
2.1.2 HH 1
The HH 1–2 system (d 450 pc) is one of the most intensely studied HH object system to date. The proper motions of HH 1 and HH 2 show that they are moving in opposite directions (Herbig & Jones (1981)). Their powering source is probably the embedded luminous young star known as HH 1–2 VLA 1 (Pravdo et al. (1985)). Infrared and optical images show very complex structures, quite randomly positioned in the case of HH 2 and more like a set of bow shock features in HH 1. Clumpy molecular emission ahead of HH 2 has been the subject of an extensive recent study (Girart et al. (2005)). Enhanced HCO+ and NH3 have also being previously observed ahead of HH 1 (Davis et al. (1990); Torrelles et al. (1993)). No dust is detected towards the NH3 clumps (Chini et al. (2001)) up to 0.22 Jy beam-1 (3-) at 850 m. Note that the dust peak emission ahead of HH 2 is 0.20 Jy (Dent et al. (2003)). Our IRAM 30 m observations pointed toward the NH3 (1,1) ammonia peak ahead of HH 1 (see Figure 2). We did a search for the most abundant species towards this region.
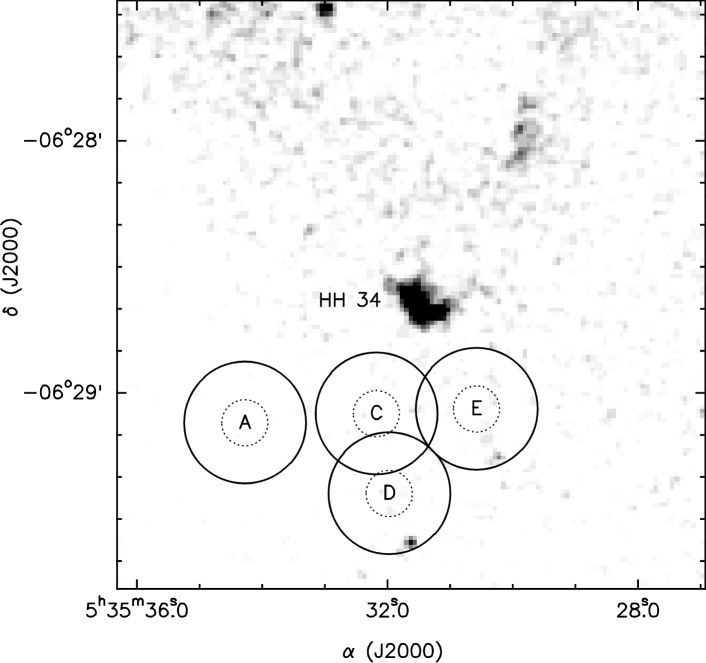
2.1.3 HH 34
The HH 34 is a high excitation large bow shock (Reipurth et al. (2002)), which is part of a parsec scale HH system located in the molecular cloud L1641 in Orion (d480 pc). Its source may be a faint star at 46,000 AU away. Enhanced, and quiescent, HCO+ 1–0 emission was detected from five clumps with sizes of about 15′′ or 7000 AU (Rudolph et al. (1992)). The clumps are located south of HH 34 at a distance to the HH object of 0.04-0.09 pc, corresponding to 8000–18000 AU. We have searched for the predicted set of molecules at four positions which coincide with the peak HCO+ emission of four of the detected clumps, A, E, C and D, by Rudolph et al. (1992; see Figure 3), although for these two last positions only 13CO, HCO+ and CS were observed.
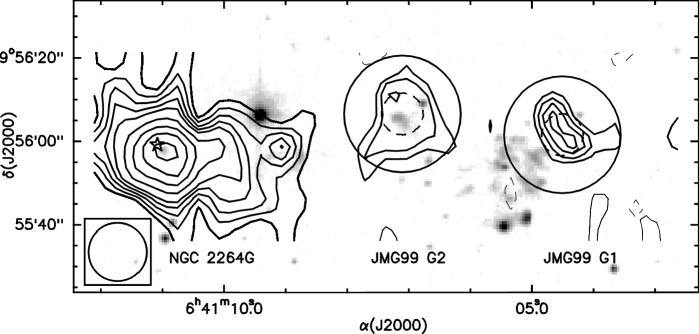
2.1.4 NGC 2264G
NGC 2264G is associated with a spectacular CO outflow driven by a Class 0 protostar (Lada et al. (1996); Gómez et al. (1994); Ward-Thompson et al. (1995)). Girart et al. (2000) found two small clumps (sizes of ) of apparently quiescent HCO+ 4–3 emission, JMG 99 G1 and JMG 99 G2, west of the protostar and just ahead from shock-excited near-IR emission. Recent observations shows that these clumps are also associated with strong high velocity SiO and CH3OH emission (Garay et al. (2002)). We observed these two clumps.
3 Results
Figure 5 shows examples of the spectra of the molecular transitions for which emission was detected, for HH 7–11 A and HH 34 E. HH 7–11 is the region where molecular lines are brighter so position HH 7–11 A was selected to carry out the most complete survey. Apart from HCS+, all the molecular species predicted by the VW99 to be enhanced were detected toward this position. All the positions observed but JMG 99 G1 shows that the emission is dominated by relatively narrow lines (mostly between 0.4 and 1.5 km s-1), typical of quiescent emission, although line width can vary from region to region or between different species (see on-line Tables 6, 7, 8, 9 and 10). HH 1 shows the largest differences between line widths for different species, ranging from km s-1 for DCO+ to 2.4 km s-1 for CH3OH. These large variations are also observed in the HH 2 molecular clumps (Girart et al. (2002)). For HH 7–11 positions and JMG 99 G2 most line widths are in the 0.8 to 1.4 km s-1 range. Interestingly, for these positions the HCN 3–2 line emission is significantly broader than the averaged line width (roughly by a factor 2). 13CO lines are in most positions either clearly non-Gaussian or have several components, which can be explained from contribution from lower density components along the line of sight. In these cases, in order to estimate the integrated line intensity, we selected the velocity range where the higher density tracer showed up. Strong absorption is observed at the center of the HCO+ 1–0 line in the HH 7-11 and specially in the NGC 2264G region, which is due to the presence of a low density molecular gas in the foreground (Girart et al. (2000)).
Some of the observed positions show high velocity wings in the HCO+ 1–0 line (the three positions in HH 7–11, HH 1, HH 34 E and JMG 99 G2). This is more clearly seen in HH 7-11 A (see Fig. 5), where other strong lines also show wings: 13CO, H2CO, CS, CH3OH.
The properties of the molecular emission toward JMG 99 G1 is quite different from the other regions. Some of the molecular transitions have emission at the systemic velocity of the cloud (e.g. C18O 2–1, HCO+ 4–3, CS 3–2) but the strongest emission arises from a broad, km s-1, blueshifted component. This component is also observed in SiO (Garay et al. (2002)). All these features indicate that most of the molecular emission in JMG 99 G1 comes from shocked outflow material (see Section 5.3).

4 Analysis
The excitation temperature and the optical depth for the HCO+ can be derived from the line ratio of the different HCO+ and H13CO+ observed transitions. From this analysis we found that 6–8 K and (HCO+3–2)3–11. Therefore HCO+ beam averaged column density is derived adopting an excitation temperature of 7 K and correcting for the optical depth. For species which also have a high dipole moment (e.g. HCN, H2CO) the column densities are estimated assuming and adopting K but also assuming that the emission is optically thin. For the other species we adopt K. Column densities of CO and isotopes are corrected for optical depth. For a non detection we report the 3– upper limit. Table 3 shows the derived beam averaged column densities for the quiescent emission (i.e. excluding the high velocity component) for all the positions but JMG 99 G1. For reference, we also include the column densities in the SO2 clump ahead of HH 2 taken from Girart et al. (2005). Note that Girart et al. obtained column densities for several positions along the slice in the SO2 clump (see their Table A.2); we chose to present only one of them (position I3, Tex = 13 2 K). Most of the lines observed toward JMG 99 G1 show emission that is more characteristic of strongly perturbed gas. In addition we used the LVG and RADEX codes to carry out a more detailed analysis for the molecules with several transitions observed (see Table 4).
For the high velocity emission toward HH 7-11 and JMG 1 we also estimated the column densities assuming and adopting K. In these cases, we computed the column density in different velocity intervals along the velocity range here the high velocity is detected (see §5.3).
4.1 LVG and RADEX analysis
In this section we estimate, to a first approximation, some of the physical and chemical characteristics of most clumps, such as the density and the temperature by means of large velocity gradient (LVG) and RADEX modelling.
We observed multitransition observations of HCO+ and H13CO+ for HH 7–11 A, HH 7–11 B and HH 7–11 X, HH 1, HH 34 A and HH 34 E. We therefore carried out radiative transfer calculations using the LVG model approximation. The main goal of the modelling is to constrain the range of densities and temperatures of the clumps, as well as the HCO+ true column densities. LVG modelling is performed varying three parameters: the column density of HCO+ , the temperature, and the volume density of the gas; one parameter is provided as an input, and the aim is to obtain a set of LVG solutions in the other two parameters plane. For HCO+, we ran the LVG code with the HCO+ column density as input parameter and we stopped when a set of reasonable solutions was obtained. To constrain the set of solutions we used all the observed line intensity as well as the observed line temperature ratios ([H12CO+ 3–2]/[H13CO+ 3–2] and [H13CO+ 2-1]/[H13CO+ 3–2]). To account for the difference in beam sizes between the different transitions, we multiplied our intensities and temperature ratios by the appropriate filling factor (assuming that the size of the emission is the same for all the transitions and that the emission has a Gaussian shape). We initially used the HCO+ size derived from previous observations (see following subsections), although we also explored different values around the reported values to check if the LVG fits improved. The solutions were searched in the – plane for different HCO+ column densities ranging from 11013 to 11015 cm-2 (the HCO+ beam averaged column densities for the clumps where we perform the LVG analysis are in the 2–2 cm-2 range). The results are summarized in Table 4. The range of values of the derived densities and temperatures from the HCO+ LVG analysis was used to perform the same analysis with CS for HH 7–11 and HH 34 E, using as completely free parameters only the CS column density and the size of its emission.
SO and C3H2 are the only other species for which, for some objects, we observed multiple transitions and collisional rates are available. For the SO (HH 7–11 A and HH 7–11 B) and C3H2 (HH 7–11 A) observed transitions we used RADEX, a non–LTE molecular radiative transfer code which assumes an isothermal homogeneous medium (Schöier et al. (2005)). To find the possible set of solutions for the SO and C3H2 we used the three observed transitions as well as their line ratios with the line intensities corrected by the filling factor. The set of best solutions are shown in Table 4.
| HCO+ | ||||
|---|---|---|---|---|
| Object | Size | (HCO+) (cm | (cm | (K) |
| HH 7–11 A | 20′′ | 5(14)-1(15) | 8(4)-3(5) | 15-24 |
| HH 7–11 B | 20′′ | 5(14)-1(15) | 9(4)-4(5) | 15-24 |
| HH 7–11 X | 20′′ | 5(14)-1(15) | 3(5)-2(6) | 7-11 |
| HH 1 | 10′′ | 5(14)-1(15) | 4(5)-1(6) | 8-11 |
| HH 34 A | 10-15′′ | 5(14)-1(15) | 3–4(5) | 7-11 |
| HH 34 E | 10-12′′ | 5(14)-1(15) | 1.5-9(5) | 8–12 |
| CS | ||||
| Object | Size | (CS) (cm | (cm | (K) |
| HH 7–11 A | 30′′ | 5(14)-1(15) | 1(5)-3(5) | 15 |
| HH 34 E | 30′′ | 3(13)–1(14) | 3(5)-9(5) | 10-12 |
| SO | ||||
| Object | Size | (SO) (cm-2) | ( cm-3) | (K) |
| HH 7–11 A | 20′′ | 3(14)-1(15) | 3(4)-4(5) | 10 |
| HH 7–11 X | 20′′ | 3(14)-1(15) | 2(4)-2(5) | 10 |
| Object | Size | (C3H2) (cm-2) | ( cm-3) | (K) |
| HH 7-11 A | 20′′ | 3(13)-1(14) | 4(4)-2(5) | 10 |
4.1.1 HH 7–11
For all the clumps we find good fits for HCO+ column densities ranging from 5 to 1 cm-2. As an example of the LVG modelling, Figure 6 (top) shows a set of LVG solutions in the - plane for HH 7–11 A. The best fit is obtained for a gas density of 8104–3105 cm-3, a of 15–24 K and a source size of ; while for HH 7–11 B we find similar solutions, for HH 7–11 X we obtain a higher gas density range and definitely a lower kinetic temperature. Although HH 7–11 X seems close to HH 8, the low temperature may be an indication that this clump is further away from the highest excitation HH object. Also note that we do not know the line-of-sight component of the distance between clump and HH object. The derived source size is larger than the estimated size from Rudolph & Welch (1988) maps. This may be due to the clumps being very close to each other causing their emission to be ‘contaminated’, yielding to an apparently bigger size.
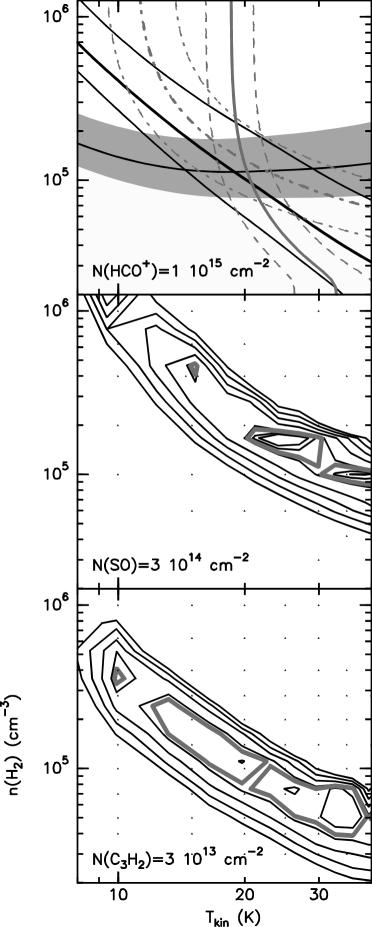
There are two CS transitions detected toward HH 7–11 A, so the LVG analysis have been performed by using as a constrain the lower limit of the kinetic temperature derived from the LVG HCO+ analysis, 15 K. Interestingly, we do not find any solution for a emitting size less than 30′′, suggesting that the CS emission is more extended than the HCO+ one. Adopting a size of 30′′, the set of possible solutions spread out over a large range of volume and column densities. Table 4 shows the CS column density assuming a volume density similar to the value derived from the HCO+.
For HH 7–11 A and X we also performed RADEX analysis of SO and, for HH 7–11 A, of C3H2. As for the other molecules we find that the best SO column density fits are reached for values higher than the beam averaged ones. From SO and C3H2 we were not able to constrain the temperature of the gas but we notice that it has to be higher than 10 K (see Figure 6, central and bottom panel). The derived gas densities are slightly lower than those derived from the HCO+ analysis.
4.1.2 HH 1
We did not detect the H13CO+ 3–2 line, hence we had to adopt a 3– upper limit for it as well as for the [H12CO]/[H13CO] and [H13CO]/[H13CO] line ratios. We find that, unlike for HH 7–11 clumps, the best fits are obtained for a source size of 10′′ consistent with the size found in the literature (Torrelles et al. (1994)). This may support the idea that the apparent larger size of the HH 7–11 clumps is merely a consequence of contamination. While the HCO+ column and gas density of the HH 1 clump are similar to those for HH 7–11, its temperature is certainly lower and somewhat better constrained.
4.1.3 HH 34
We find a remarkably small range of solutions for the kinetic temperature, at 7-11 K for HH 34A and 8–11 K for HH 34 E. As for HH 1, we find that the best solutions are obtained for 10′′–15′′ sizes, consistent with those found in the literature (Rudolph et al. (1992)). The HCO+ column densities range from 5 to 1 cm-2. For HH 34A we derive slightly higher gas densities than for HH 34 E. For HH 34 E we also have the two CS transitions, hence we attempted an LVG analysis by fixing the temperature to 10 and 15 K. As in the case of HH 7–11 there are no solutions for emitting sizes smaller than and the CS column density is derived assuming a volume density similar to the value derived from the HCO+.
4.1.4 Summary of LVG analysis
In summary, the LVG analysis leads to the following preliminary conclusions: The gas densities of the clumps are always higher than those typical of a molecular cloud ( 104 cm-3); HCO+ (and CS for HH 7–11 and HH 34 E) column densities derived from LVG are larger than the beam averaged ones, consistent with the fact that the size of the clumps is smaller than the beam sizes, although in the case of the HH 7–11 clumps the picture is somewhat more complicated due to the close vicinity of the clumps; The emitting sizes derived from the LVG analysis of CS seem to be larger than those derived from the HCO+ analysis, indicating that the two species possibly arise from different gas components, a result already found by Girart et al. (2005) in their extensive study of the molecular gas ahead of HH 2. The temperatures are always well constrained and for all the clumps lower than 25 K, with HH7-11 being the warmest. Note that at low temperatures there is no clear pathway for the enhancement of HCO+: we show in VW99 that for HCO+ to reach column densities of 1014 cm-2 grain surface reactions and subsequent evaporation of the icy mantles must have occurred, as the main route of formation for HCO+ is via the ion-neutral reaction of C+ with H2O. If the temperature is 100 K, mantle evaporation can only have occurred via photoevaporation. An alternative way might have been if the gas had been shocked in the past reaching higher temperatures and then cooled down. However during the time the gas cools back down to 10–20 K, HCO+ should be destroyed again. Moreover, we show in VW99 that an enhanced UV radiation is in any case needed in order to ionize the gas enough to produce large abundances of C+.
5 Discussion
As explained in Section 2, our main criterion for extending the survey to other molecular species was the strength of HCO+. Table 3 shows that most clumps that exhibit HCO+enhancement also show a rich chemistry, as predicted by the VW99: methanol, when observed, seems to be at least one order of magnitude more abundant than what typically is found in dark molecular clouds or prestellar cores (see Table 5). Of the sulphur species, CS is ubiquitously detected but note however that CS is abundant in dark clouds and hence some of the emission may arise from the surrounding medium rather than the clumps, overall for those clumps with a size much smaller than our beam size. SO and H2S seem to be present in the majority of the clumps where HCO+ is enhanced. Of the other sulphur bearing species, OCS, H2CS, and NS were only observed in HH 7–11 A. We will now analyse our results and look for a possible correlation between the chemical ‘richness’ of a clump, its vicinity to the HH shock and the strength of the radiation field impinging on the clump.
In this section we attempt a simple analysis of the molecular species detected in our sample. In 5.1 we summarize the general physical and chemical properties of all the clumps. In 5.2 we discuss the effects of distance on the chemical processing ahead of HH objects by looking at the chemistry of different clumps ahead of the same object. However, it is important to note that the abundance of each molecular species will depend on the gas density; the radiation field ; the distance to the source of radiation; the size of the clump, the age and, to a lesser extent, the kinetic temperature of the gas. Some of these physical parameters have similar effects on the chemistry (e.g. the size and the gas density). Due to such degeneracy it is often difficult to disentangle the effects on the chemistry due to the different parameters. So, for example, for clumps ahead of the same object, where the radiation field is constant, different abundances may not be due solely to the different positioning of the clumps as it may be that the condensations differ in density, size and age. In 5.3 we briefly discuss the properties of the high velocity gas.
5.1 Physical and chemical properties of clumps ahead of HH objects
The physical and chemical properties of the gas ahead of the HH objects are different from those observed in prestellar cores or dark molecular clouds: they are denser than the latter but their small size and the high abundances of certain species, such as HCO+ and methanol, make them unlikely candidates for pre-stellar cores. In Table 5, we compare the typical abundances of a pre-stellar core, L1544, with those derived for the HH 7–11 A clump. The abundances of L1544 are taken from Jørgensen et al. (2002), while the HH 7–11 A abundances were derived by dividing the averaged beam column densities by the H2 column density from the dust observations (Hatchell et al. (2005)) by assuming a dust temperature of 23 K (Chini et al. (2001)). There are of course uncertainties associated with the derivation of the H2 column densities (and hence of fractional abundances), such as i) the error bars associated with the integrated emission (see Table 10) and ii) the assumption of LTE which affects the molecular abundances estimate. While the first one only leads to a 30% uncertainty, assuming LTE may lead to a larger uncertainty. The latter is still below the enhancement factor found (i.e 1 order of magnitude), although, for some species, the propagation of both errors may become relevant. Although the abundances ahead of HH 7–11 A are clearly enhanced with respect to those in L1544, the low abundance of CO is puzzling: while freeze out on the grains is clearly responsible for its depletion in L1544, in the case of HH 7–11 A the UV radiation should have photoevaporated all the ices so no significant amount of CO should be left on the dust unless it remains trapped in a multilayered ice. An alternative possibility is that the condensations we observe are transient and young: if the UV radiation photoevaporated the mantle while depletion was still occurring, there may have been not enough time to form CO. Viti et al. (2003) already observed that, in fact, to match the observations ahead of HH 2 the condensations had to be young ( 1000 yrs) and in one of the best matching models, B10, CO has a gas phase abundance of 210-5 at an AV of 3.5 mags after evaporation. On the other hand it is also possible that the dust column density is overestimated: some of the material may not be associated with the dense clumps and we may be overestimating the amount of dust responsible for the emission, perhaps because we have a too low an opacity. In short, it is hard to know what the absolute abundance of CO is and no strong conclusion should be drawn from Table 5 beside the fact that clearly some species are enhanced with respect to those in L1544.
An enhancement of species such as HCO+, CH3OH and SO, in absence of shocks, can indeed be an indication of active photochemistry. Jørgensen et al. (2002) do not give a fractional abundance for CH3OH for L1544 but HCO+ and SO are both less abundant by a factor of 5–10, although species such as CS have similar abundances. Interestingly DCO+ also seems to be slightly enhanced in HH 7–11 A with respect to the value found in L1544, although the DCO+/HCO+ ratio is consistent with those expected in a dense, low temperature gas (Roberts et al. (2000)). In fact a comparison between starless cores and clumps ahead of HH objects may be misleading in that the anomaly of our clumps is that they are denser than a molecular cloud but much smaller than starless cores. They in fact show similarity with clumps detected by recent high resolution BIMA observations in L673 (Morata et al. (2005)) in that they are of similar sizes and they seem to have structures on scales of 10′′ or so but they have different chemistry because they are illuminated by the HH radiation.
We are unable to compare clumps ahead of other regions with starless cores as we do not know their H2 column density but we compare the column densities across our clumps in Table 3 and Figure 7.
| HH 7–11 | |||
|---|---|---|---|
| Molecule | A | X | L1544 |
| CO | 3.7(-5) | 5.5(-5) | 4.9(-6) |
| CH3OH | 5.0(-9) | 9.8(-9) | – |
| HCO+ | 2.9(-9) | 3.8(-9) | 3.9(-10) |
| H2CO | 1.3(-9) | 2.3(-9) | – |
| SO | 1.2(-9) | 2.0(-9) | 4.8(-10) |
| CS | 8.6(-10) | 1.5(-9) | 8.6(-10) |
| H2S | 7.1(-10) | 1.1(-9) | – |
| HCN | 3.3(-10) | 3.8(-10) | 4(-10) |
| OCS | 3.0(-10) | – | – |
| H2CS | 1.6(-10) | – | – |
| DCO+ | 7.1(-11) | 8.6(-11) | 2.1(-11) |
Before attempting such comparison, it is important to note that, as discussed in Section 3 and as shown from our LVG analysis, we are uncertain about the size of all our clumps; hence for some objects, the beam size may be larger than the source size and for species such as HCO+ (enhanced only in dense clumps subjected to the radiation) their averaged beam column densities may be a lower limit; however for species that are abundant also in the surrounding medium, such as CS and CO, their beam averaged column densities may be an overestimate of the emission from the clump.
From Table 3 it is clear that all the clumps, except possibly JMG 99 G2, exhibit a similar chemistry: in order to eliminate the uncertainties due to the sizes, let us compare ratios rather than absolute column densities (see Figure 7); for example, HCO+/CH3OH is remarkably constant within a factor of 2 for all objects, except for G2, where it is lower by one order of magnitude. Other ratios, such as HCO+/SO or SO/H2S also show remarkable consistency among the clumps although in G2 the column densities of species characteristic of photochemistry are not as enhanced. In fact, chemically, it appears that while the clumps ahead of HH 7–11, HH 34 and HH 1 are of the same nature (confirmed also by the column densities derived from the LVG analysis), JMG 99 G1 and G2 have undergone different processing.
Although we do not have an estimate for the temperature of JMG 99 G1 and G2, from our LVG analysis we note that HH 7–11 A clumps have a higher temperature than HH 34 and HH 1 clumps, therefore HH 34 and HH 1 clumps seem to be the most quiescent, maybe because so far they only have been affected by the UV radiation. Indeed, the line widths of HH 34 are significantly smaller than those of HH 7-11 ( and 1.2 km s-1 for HH 34 and HH 7–11, respectively). HH 7–11 clumps, on the other hand, show sign of dynamical interaction with the HH objects, but such interaction seems not to have affected the chemical nature of the gas yet: the increase in temperature caused by the dynamical interaction is in fact still not sufficient to produce any shock chemistry and hence the chemical properties of HH 7–11 are very similar to those of HH 34 and HH 1 clumps.
Note that, as also explained in Viti et al. (2004), the density enhancements we see ahead of HH 7–11 could not be produced by wind compression as the timescales would be too short for substantial freeze out to have occurred; as described in VW99 and Viti et al. (2003) depletion and subsequent hydrogenation on the grains must have occurred during the formation of the density enhancements, before the arrival of the HH object, in order for species such as HCO+ and CH3OH to have formed.
It is tempting to draw an evolutionary scenario around these three different situations with HH 34 and HH 1 clumps being the youngest and JMG 99 G1 and G2 being the oldest clumps. However, it is impossible to disentangle the effects of age, distance from the HH objects, and radiation, as discussed further in the next section.
Despite the similar chemistry of most of the clumps and the uncertainties with the emission sizes, the (albeit small) differences in column densities (Table 3) may be significant. The three clumps ahead of HH 7–11 may be affected by several HH objects (Figure 1), hence it is impossible to determine which clump is the most irradiated; however, irradiation from several HH objects is consistent with the fact that HH 7–11 clumps show a richer chemistry than others.
Although we do not here attempt any modelling of these clumps, it is interesting to compare the abundances of our clumps with the models computed in Viti et al. (2003). Note that these were detailed models of a particular clump ahead of HH 2 hence we are not looking here for a perfect match. Viti et al. (2003) computed a large grid of models where both the radiation field and densities were varied. Although from the column densities in Table 3 it seems that HCO+ is higher ahead of HH 7–11 than ahead of HH 34 and NGC2264, from our LVG analysis it seems that the densities ahead of HH 7–11 are either lower or the same as those ahead of HH 34 and HH 1. Hence we may expect either that the radiation field from HH 7–11 is higher, or that clumps ahead of HH 7–11 are younger. Figures 3 to 7 in Viti et al. (2003) show the column densities for HCO+, CH3OH , SO and H2CO as a function of time for an AV 3 mags. We compare the column densities in these figures with those derived from our observations here for HH 7–11 and find that the best fitting models for HCO+, CH3OH and SO are B7 and B8 which have a high radiation field of 1000 Habing and a density of 3105 cm-3. The abundances of HCO+, CH3OH and SO may be less ahead of HH 34 by as much as 1 order of magnitude: although not shown in Viti et al. (2003) we compared two models from their grid where the density (3 cm-3), age ( 100 yrs) and visual extinctions ( 3 mags) were the same but the radiation field varied from 20 to 1000 Habing and we found that HCO+went from 7 to 5 cm-2, SO from 5 to 2 and CH3OH from 1 to 6 cm-2. However, at much later ages, a higher radiation field implies in fact a lower abundances of these species as the radiation field enhances but also destroys the gas: as explained in VW99 the effect of the irradiation is in fact to create a ‘wave’ of molecular formation where the abundances rise to enhanced values with respect to standard dark cloud chemistry but then fall again as photodissociation begins to dominate. It is difficult therefore to disentangle the effects of radiation, from those of age.
Finally, it is interesting to note that in HH 7–11 A, the abundance of HCS+ is at least one order of magnitude lower than that of H2CS. Again, from the Viti et al. (2003) models we find that, as long as the density is greater than 105 cm-3then H2CS/HCS+ is always 10; but lower radiation fields ( 20 Habing) yield to very high ratios (100-1000) while if 1000 Habing the ratio is 10-50.
5.2 Effects of distance on chemical processing ahead of HH objects
In this section we attempt to single out the effect of the distance from other parameters under the assumption that the rich chemistry is mainly due to the UV impinging on the clumps. We therefore compare column densities among clumps belonging to the region, where not only the radiation field from the HH shock is constant, but also where we assumed that the size of each clump is the same. In particular HH 34 may be the best region for this analysis as i) the four clumps show some chemical diversity and ii) unlike the HH 7–11 region there seems to be only one HH object impinging on the clumps.
In the HH 34 region HH 34 C and E are the closest clumps to the HH object, with A and D 1.6 and 2 times further away (in the plane of the sky; the true distances from the HH object are of course unknown). From Table 3, HH 34 C and E clearly show higher HCO+ column densities than A and D, although the CO and CS column densities are similar, consistent with exposure to a higher UV field. Of C and E, E has the larger HCO+ column density, possibly because it has the higher derived gas density derived from the LVG analysis. Moreover, from Table 3, SO and methanol from HH 34 E have higher column densities than the more distant HH 34 A. From this object, we also detect C3H2, not usually detected in quiescent dense clumps. This increase in chemical activity where the UV radiation field would be expected to be strongest is consistent with the UV chemistry, though a variation in density or age of the clumps cannot be ruled out as an alternative cause.

5.3 The High Velocity component
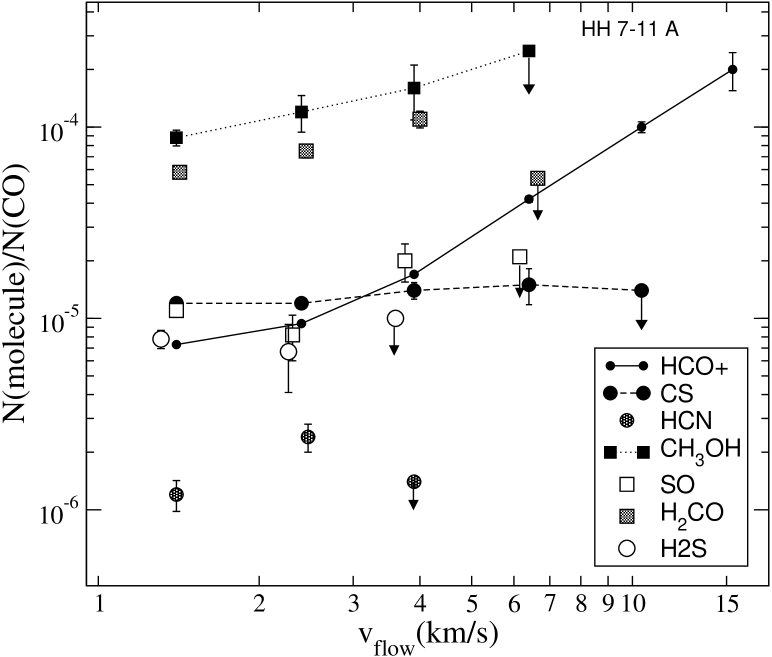
HH 7–11 A and JMG 99 G1 are the positions where the high velocity emission is brighter. We calculated the column density ratio with CO for several species (from the 13CO spectra), i.e., the molecular fractional abundances with respect to the CO (see §4). Figure 8 shows the fractional abundances with respect to the CO for several molecules as a function of the outflow velocity.
From Figure 8, it is clear that the HCO+ relative abundance of the HH 7–11 high velocity component toward increases by more than an order of magnitude (a factor of ) between the slowest and fastest outflow components. This enhancement is also seen in H2CO and CH3OH for outflow velocities lower than km s-1 with respect to the systemic velocity. On the other hand, CS does not change its relative abundance. The HCO+ abundance enhancement at higher outflow velocities was first reported by Girart et al. (1999) towards the NGC 2071 molecular outflow. Recently, Dent et al. (2003) has found the same behaviour for the HCO+ towards the high velocity gas around HH 2. However, HCO+ is the only high density molecular tracer detected in the high velocity HH 2 component and this case could be a different scenario from NGC 2071 or HH 7–11, since in HH 2 the lack of other molecular high velocity gas other than HCO+ can be explained by the presence of strong UV field. In any case the clear enhancement of the HCO+ abundance with respect to other molecular tracers with increasing high velocity indicates that it traces the molecular outflow well at higher velocities, whatever causes its enhancement.
JMG 99 G1 not only has a spectral feature quite different from the high velocity wings seen in HH 7–11 A but the chemical properties are also very different. In JMG 99 G1 the CH3OH is by far the more abundant high density molecular tracer with a X[CH3OH]/X[CO]2–4. This abundance is also found in strongly shock molecular clumps such those in L1157 (Bachiller et al. (2001)), and IRAS 21391+5802 (Beltrán et al. (2002)). The HCO+on the other hand is almost one order of magnitude lower than in HH 7–11, although its abundance also increases with the outflow velocity. Even the spectral shape of the molecular emission in G1 is similar to the spectral shape of the lines detected in the L1157 clumps: Most of the lines shown are blueshifted (by 2–3 km s-1 with respect to the cloud velocity) and are significantly broader ( 4–5 km s-1) than the lines from the other positions. Such emission may in fact come from clumps similar to those seen along the L1157 and CB3 outflows (Bachiller et al. (2001); Codella et al. (1999)): Viti et al. (2004) found that such clumpiness may be a consequence of a pre-existing density enhancement and of its interaction with the outflow.
6 Conclusions
We have performed a survey of molecular species ahead of several HH objects, where enhanced HCO+ emission was previously observed. Recent modelling have supported the idea that such enhancement is due to UV radiation from the HH object lifting the ice mantles from the grains in the clumpy medium ahead of the jet, which then would drive a photochemistry. If this model is correct then other molecular species (such as CH3OH, SO etc) should also be enhanced. A recent molecular survey of the gas ahead of HH 2 seems to support such model (Girart et al. (2005)). The aims of this present survey were to investigate: 1) whether the rich chemistry observed ahead of HH 2, and predicted by the VW99 model, was indeed characteristic of the gas ahead of Herbig-Haro objects; 2) the chemical differentiation that may arise among clumps ahead of different objects, which may differ in radiation field strengths.
We have selected 4 HH objects regions: in some of these regions enhanced HCO+ emission had been detected from several clumps. Hence, in total we observed ten positions. For each position we searched for more than one species and, if possible, for more than one transition per species. We find that, chemically, the richest gas was that ahead of the HH 7–11 complex, in particular at the HH 7–11 A position. In some regions we also detected a high velocity gas component. Beside estimating the averaged beam column densities for all the species observed, we have performed, where possible, LVG analyses to constrain the physical properties of the gas. The main conclusions from our LVG analysis are:
-
1.
The gas densities of all the clumps observed are always higher than those typical of molecular clouds by at least a factor of 5, but probably higher.
-
2.
The derived gas temperatures are alway quite low ( 15 K) apart for the clumps ahead of HH 7–11 where the maximum temperature does not in any case exceed 25 K.
-
3.
HCO+, SO and CS column densities derived from our LVG and RADEX analyses are higher than the beam averaged ones. This indicates that the size of the emitting region is smaller than the beam size.
-
4.
The emitting size derived from the LVG analysis of CS are larger than those estimated from the HCO+ analysis. It may be that these two species arise from different gas components, consistent with previous studies (Girart et al. (2005)). In addition, the HCO+ abundance is enhanced with respect to the starless core in L1544, whereas the CS has similar abundances. All this suggests that at least a fraction of the CS emission may arise from a cloud component or clumps not illuminated by he HH objects.
By comparing column densities among the several clumps we also attempt a very simple chemical analysis in light of the photochemical model. We find that the abundances of the observed species ahead of the surveyed HH objects are higher than those found in a typical starless core and that by comparing the column densities among the different clumps we find that the clumps ahead of HH 7–11, HH 34 and HH 1 are of the same chemical nature, supporting the idea that the gas ahead of all HH objects exhibit a rich chemistry.
Acknowledgements.
SV and JH both acknowledge individual financial support from a PPARC Advanced Fellowship. JMG acknowledges support by SEUI grant AYA2002-00205. SV and JMG acknowledge support by a joined RS and CSIC travel grant. We thank the staff of the IRAM 30 m telescope for help with the observations.References
- Bachiller et al. (2001) Bachiller R., Pérez Gutiérrez M., Kumar M. S. N., Tafalla M., 2001, A&A, 372
- Beltrán et al. (2002) Beltrán, M.T., Girart, J.M., Estalella, R., Ho, P.T.P.& Palau, A. 2002, ApJ, 573, 246
- Caselli et al. (1998) Caselli, P., Walmsley, C. M., Terzieva, R., Herbst, E., 1998, ApJ, 499, 234
- Cernis (1990) Cernis, K. 1990, Ap&SS, 166, 315
- Chini et al. (2001) Chini, R., Ward-Thompson, D., Kirk, J. M., Nielbock, M., Reipurth, B., & Sievers, A. 2001, A&A, 369, 155
- Codella et al. (1999) Codella, C., Bachiller, R., 1999, A&A, 350, 659
- Davis et al. (1990) Davis, C. J., Dent, W. R. F., & Burnell, S. J. B. 1990, MNRAS, 244, 173
- Dent et al. (2003) Dent, W. R. F., Furuya, R. S., & Davis, C. J. 2003, MNRAS, 339, 633
- Dent et al. (1993) Dent, W. R. F., Cunningham, C., Hayward, R. et al. 1993, MNRAS, 262, 13L
- Evans et al. (2001) Evans, N. J. II, Rawlings, J. C. M., Shirley, Y. L., Mundy, L. G., 2001, ApJ, 557, 193
- Herbig & Jones (1981) Herbig, G. H., Jones, B. F., 1981, AJ, 86, 1232
- Garay et al. (2002) Garay, G., Mardones, D., Rodríguez, L.F., Caselli, P. & Bourke, T.L. 2002, ApJ, 567 980
- Girart et al. (2005) Girart, J. M., Viti, S., Estalella, R., Williams, D. A., 2005, A&A, 439, 601
- Girart et al. (2002) Girart, J. M., Viti, S., Williams, D. A., Estalella, R., & Ho, P. T. P. 2002, A&A, 388, 1004
- Girart et al. (2000) Girart, J. M., Estalella, R., Ho, P. T. P., & Rudolph, A. L. 2000, ApJ, 539, 763
- Girart et al. (1999) Girart, J. M., Ho, P. T. P., Rudolph, A. L., Estalella, R., Wilner, D. J., & Chernin, L. M. 1999, ApJ, 522, 921
- Girart et al. (1994) Girart, J. M., Rodriguez, L. F., Anglada, G., et al. 1994, ApJ, 435, L145
- Gómez et al. (1994) Gómez, J. F., Curiel, S., Torrelles, J. M., Rodriguez, L. F., Anglada, G., & Girart, J. M. 1994, ApJ, 436, 749
- Hatchell et al. (2005) Hatchell, J., Richer, J., Fuller, G.A., Qualtrough, C.J., Ladd, E.F., Chandler, C.J., 2005, A&A 440, 151
- Jørgensen et al. (2002) Jørgensen, J. K., Schöier, F. L.,, van Dishoeck, E. F., 2002, A&A, 389, 908
- Lada et al. (1996) Lada, C. J., & Fich, M. 1996, ApJ, 459, 638
- Lefloch et al. (2005) Lefloch, B., Cernicharo, J., Cabrit, S., & Cesarsky, D. 2005, A&A, 433, 217
- Mehringer (1996) Mehringer, D. M. 1996, ApJ, 462, 355
- Morata et al. (2005) Morata, O, Girart, J. M., Estalella, R., 2005, A&A, 435, 113
- Pravdo et al. (1985) Pravdo, S. H., Rodriguez, L. F., Curiel, S. et al., 1985, ApJ, 293, L35.
- Reipurth et al. (2002) Reipurth, B., Heathcote, S., Morse, J., Hartigan, P., & Bally, J. 2002, AJ, 123, 362
- Roberts et al. (2000) Roberts, H., Millar, T. J., 2000, A&A, 361, 388
- Rodríguez et al. (1999) Rodríguez, L. F., Anglada, G., & Curiel, S. 1999, ApJS, 125, 427
- Rudolph et al. (2001) Rudolph, A. L., Bachiller, R., Rieu, N. Q., Van Trung, D., Palmer, P., & Welch, W. J. 2001, ApJ, 558, 204
- Rudolph et al. (1992) Rudolph, A., & Welch, W. J. 1992, ApJ, 395, 488
- Rudolph et al. (1988) Rudolph, A., & Welch, W. J. 1988, ApJ, 326, L31
- Schöier et al. (2005) Schöier, F. L., van der Tak, F. F. S., van Dishoeck, E. F., Black, J. H., 2005, A&A, 432, 369
- Solf et al. (1987) Solf, J. & Boehm, K. H. 1987, AJ, 93, 1172
- Torrelles et al. (1994) Torrelles, J. M., Gomez, J. F., Ho, P. T. P., Rodriguez, L. F.,, Anglada, G., & Canto, J. 1994, ApJ, 435, 290
- Torrelles et al. (1993) Torrelles, J. M., Gomez, J. F., Ho, P. T. P., Anglada, G., Rodriguez, L. F., & Canto, J. 1993, ApJ, 417, 655
- Torrelles et al. (1992) Torrelles, J. M., Rodriguez, L. F., Canto, J., et al. 1992, ApJ, 396, L95
- Viti et al. (2004) Viti, S., Codella, C., Benedettini, M., Bachiller, R., 2004, MNRAS, 350, 1029
- Viti et al. (2003) Viti, S., Girart, J. M., Garrod, R., Williams, D. A., & Estalella, R. 2003, A&A, 399, 187
- Viti & Williams (1999) Viti, S. & Williams, D. A. 1999, MNRAS, 310, 517 (VW99)
- Ward-Thompson et al. (1995) Ward-Thompson D., Eiroa C., Casali M. M., 1995, MNRAS, 273, L25
| HH 7–11 A | HH 7–11 X | HH 7–11 B | ||||||||||||
| Molecular | ||||||||||||||
| Transition | (K) | (K km s-1) | (km s-1) | (km s-1) | (K) | (K km s-1) | (km s-1) | (km s-1) | (K) | (K km s-1) | (km s-1) | (km s-1) | ||
| 13CO 2–1a | 15.8(2) | 23.8(1) | 7.8(1) | 1.5(2) | 18.6(3) | 26.3(1) | 7.7(1) | 1.7(2) | 16.3(4) | 24.5(2) | 7.8(1) | 1.4(2) | ||
| C18O 2–1a | 4.86(6) | 6.9(1) | 7.8(1) | 1.4(2) | 4.8(2) | 6.76(7) | 7.8(1) | 1.5(2) | ||||||
| HCO+ 1–0a | 6.51(8) | 10.37(3) | 7.80(5) | 1.69(8) | 6.33(14) | 11.51(6) | 7.8(1) | 1.4(2) | 6.36(14) | 10.0(1) | 7.9(1) | 1.4(2) | ||
| HCO+ 3–2 | 9.5(3) | 18.08(18) | 7.87(1) | 1.80(2) | 8.5(6) | 17.7(4 ) | 7.92(2) | 1.94(5) | 10.0(6) | 18.1(4) | 7.8(1) | 1.6(2) | ||
| H13CO+ 1–0 | 1.91(3) | 2.43(2) | 7.92(1) | 1.20(1) | 1.71(5) | 2.21(3) | 7.89(1) | 1.21(2) | 1.92(6) | 2.44(4) | 7.97(1) | 1.20(2) | ||
| H13CO+ 3–2 | 1.0(2) | 1.08(8) | 8.03(4) | 1.03(9) | 0.71(18) | 0.95(9) | 8.11(6) | 1.26(12) | 1.1(3) | 1.3(2) | 8.21(8) | 1.2(2) | ||
| DCO+ 2–1 | 5.00(14) | 5.42(6) | 7.86(2) | 1.02(1) | 3.7(2) | 3.78(8) | 7.73(1) | 0.97(2) | ||||||
| DCO+ 3–2 | 3.5(2) | 3.45(8) | 7.84(1) | 0.91(2) | 2.1(3) | 2.48(15) | 7.75(3) | 1.10(7) | ||||||
| HCN 3–2 | 2.2(4) | 7.25(31) | 7.82(7) | 3.2(2) | 2.0(4) | 5.1(5) | 8.00(9) | 2.4(3) | ||||||
| H2CO 20,2–10,1 | 4.2(2) | 7.06(7) | 7.68(1) | 1.59(2) | 3.51(18) | 7.23(12) | 7.71(2) | 1.93(4) | ||||||
| H2CO 31,3–21,2 | 4.2(1) | 6.42(3) | 7.86(1) | 1.42(1) | ||||||||||
| CH3OH 20–10 A+ | 2.62(5) | 3.60(3) | 7.83(1) | 1.29(1) | 2.38(7) | 3.53(4) | 7.84(1) | 1.40(1) | ||||||
| CH3OH 2-1–1-1 E | 1.93(5) | 2.67(3) | fixed | fixed | 1.74(7) | 2.60(4) | fixed | fixed | ||||||
| CH3OH 20–10 E | 0.36(5) | 0.49(3) | fixed | fixed | 0.29(7) | 0.44(4) | fixed | fixed | ||||||
| CH3OH 21–11 E | 0.11(5) | 0.16(3) | fixed | fixed | 0.09(7) | 0.12(4) | fixed | fixed | ||||||
| CH3OH 30–20 A+ | 3.13(10) | 4.33(7) | 7.86(1) | 1.30(1) | 2.91(11) | 5.08(9) | 7.96(1) | 1.59(2) | ||||||
| CH3OH 3-1–2-1 E | 2.53(10) | 3.50(7) | fixed | fixed | 2.59(11) | 4.54(9) | fixed | fixed | ||||||
| CH3OH 30–20 E | 0.25(10) | 0.35(6) | fixed | fixed | 0.53(11) | 0.99(8) | fixed | fixed | ||||||
| CH3OH 50–40 A+ | 1.01(16) | 1.42(14) | 7.82(5) | 1.33(7) | 1.5(3) | 2.3(2) | 8.02(6) | 1.39(9) | ||||||
| CH3OH 5-1–4-1 E | 0.96(16) | 1.35(12) | fixed | fixed | 1.3(3) | 1.8(2) | fixed | fixed | ||||||
| C3H4 50–40 | 0.14(4) | 0.13(1) | 7.87(3) | 0.85(4) | ||||||||||
| C3H4 51–41 | 0.14(4) | 0.13(1) | fixed | fixed | ||||||||||
| C3H4 52–42 | 0.08(4) | 0.07(1) | fixed | fixed | ||||||||||
| C3H2 21,2–10,1 | 1.43(12) | 1.33(3) | 8.10(1) | 0.86(2) | ||||||||||
| C3H2 31,2–22,1 | 0.53(10) | 0.69(8) | 7.87(1) | 1.21(10) | 0.50(11) | 0.65(8) | 7.96(1) | 1.21(11) | ||||||
| C3H2 41,4–30,3 | 1.17(11) | 0.91(4) | 8.10(2) | 0.73(4) | ||||||||||
| CS 3–2 | 6.5(2) | 12.10(9) | 7.73(1) | 1.72(2) | 6.2(3) | 12.6(2) | 7.70(2) | 1.93(4) | 6.3(3) | 12.0(2) | 7.84(1) | 1.77(1) | ||
| CS 5–4 | 2.9(1) | 4.00(4) | 7.90(1) | 1.26(1) | ||||||||||
| SO 32–21 | 5.43(9) | 7.23(4) | 7.80(1) | 1.25(1) | 5.04(8) | 6.73(4) | 7.78(1) | 1.26(1) | ||||||
| SO 65–54 | 2.7(2) | 3.06(9) | 7.73(1) | 1.05(3) | 2.0(2) | 3.09(12) | 7.93(3) | 1.39(7) | ||||||
| SO 76–65 | 1.1(3) | 1.7(2) | 7.61(8) | 1.4(2) | 0.8(3) | 1.1(2) | 7.8(1) | 1.2(4) | ||||||
| H2S 11,0–00,1 | 2.8(2) | 4.17(11) | 7.73(2) | 1.41(4) | 2.1(3) | 3.9(2) | 7.77(5) | 1.75(11) | 2.2(3) | 3.5(2) | 7.92(5) | 1.50(9) | ||
| H2CS 40,4–30,3 | 0.49(9) | 0.48(5) | 7.61(5) | 0.90(9) | ||||||||||
| NS 7/2–5/2 161.297 | 0.16(7) | 0.18(3) | 7.94(7) | 1.05(8) | ||||||||||
| NS 7/2–5/2 161.298 | 0.14(7) | 0.15(7) | fixed | fixed | ||||||||||
| NS 7/2–5/2 161.302 | 0.14(7) | 0.16(3) | fixed | fixed | ||||||||||
| OCS 7–6 | 0.25(7) | 0.21(2) | 7.76(5) | 0.79(9) | ||||||||||
| HCS+ 5–4 | ||||||||||||||
-
a
The 13CO 1-0, C18O 1-0, HCO+ 1-0 lines are clearly non-Gaussian (self absorption for the HCO+ and strong high velocity emission for all of them). Line parameters derived from the zero (integrated intensity), first (line velocity) and second (line width) order moments of the emission in the 6.9-8.9 vLSR range (the velocity range of the H13CO+ emission).
|
||||||||||||||||||||||||||||||||||||||||||||||||||||||||||||||||||||||||||||||||||||||||||||||||||||||||||||||||||||||||||||||||||||||||||||||||||||||||||||||||||||||||||||||||||||||||||||||||||||||||||||||||||||||||||||||||||||||||||||||||||||||||||||||||||||||||||||||||||||||||||
-
a
The 13CO 1-0 is non-Gaussian. Line parameters derived from the zero (integrated intensity), first (line velocity) and second (line width) order moments of the emission in the 8.30-9.20 vLSR range (the velocity range of C18O emission).
-
b
Weak line: fixed line width with the value of the DCO+ 2-1 line.
|
||||||||||||||||||||||||||||||||||||||||||||||||||||||||||||||||||||||||
-
a
The 13CO 1-0 is non-Gaussian. Line parameters derived from the zero (integrated intensity), first (line velocity) and second (line width) order moments of the emission in the 8.0-9.0 vLSR range (the velocity range of HCO+ emission).
|
-
a
The 13CO 1-0, C18O 1- lines are non-Gaussian. Line parameters derived from the zero (integrated intensity), first (line velocity) and second (line width) order moments of the emission in the 8.10-10.30 vLSR range (the velocity range of HCO+ emission).
|
||||||||||||||||||||||||||||||||||||||||||||||||||||||||||||||||||||||||||||||||||||||||||||||||||||||||||||||||||||||||||||||||||||||||||||||||||||||||||||||||||||||||||||||||||||||||||||||||||||||||||||||||||||||||||||||||||||||||||||||||||||||||||||||||||||||||||||||||||||||||||
-
0
The 13CO 1-0 is fitted with three Gaussian components. One is forced to have the same velocity peak and line width as the C18O emission.
-
a
At the ambient velocity ( km s-1) the emission is missing. Computed the moments for the broader component using the CS velocity range (–4.8 km s-1)
-
b
Used two components fits as in CS 3–2.
-
d
Very marginal detection.
-
c
Marginal detection, so we used the -2.2 to 5.2 km s-1 velocity range to derive the integrated line intensities, velocity and line width.