An XMM-Newton observation of the young open cluster NGC 2547: coronal activity at 30 Myr
Abstract
We report on XMM-Newton observations of the young open cluster NGC 2547 which allow us to characterise coronal activity in solar-type stars, and stars of lower mass, at an age of 30 Myr. X-ray emission is seen from stars at all spectral types, peaking among G-stars at luminosities (0.3–3 keV) of erg s-1 and declining to eg s-1 among M-stars with masses . Coronal spectra show evidence for multi-temperature differential emission measures and low coronal metal abundances of . The G- and K-type stars of NGC 2547 follow the same relationship between X-ray activity and Rossby number established in older clusters and field stars, although most of the solar-type stars in NGC 2547 exhibit saturated or even super-saturated X-ray activity levels. The median levels of and in the solar-type stars of NGC 2547 are very similar to those in T-Tauri stars of the Orion Nebula cluster (ONC), but an order of magnitude higher than in the older Pleiades. The spread in X-ray activity levels among solar-type stars in NGC 2547 is much smaller than in older or younger clusters.
Coronal temperatures increase with , and surface X-ray flux. The most active solar-type stars in NGC 2547 have coronal temperatures intermediate between those in the ONC and the most active older ZAMS stars. We show that simple scaling arguments predict higher coronal temperature in coronally saturated stars with lower gravities. A number of candidate flares were identified among the low-mass members and a flaring rate (for total flare energies [0.3–3 keV] erg) of 1 every ks was found for solar-type stars, which is similar to rates found in the ONC and Pleiades. Comparison with ROSAT HRI data taken 7 years previously reveals that only 10–15 percent of solar-type stars or stars with erg s-1 exhibit X-ray variability by more than a factor of two. This is comparable with clusters of similar age but less than in both older and younger clusters. The similar median levels of X-ray activity and rate of occurrence for large flares in NGC 2547 and the ONC demonstrate that the X-ray radiation environment around young solar-type stars remains relatively constant over their first 30 Myr.
keywords:
stars: activity – stars: late-type – stars: coronae – stars: rotation – open clusters and associations: individual: NGC 2547 – X-rays: stars1 Introduction
X-ray emission from the hot coronae of cool stars is now a well established phenomenon (e.g. see the review by Güdel 2004). The emission arises from magnetically confined and heated structures with temperatures in excess of K. In stars that have reached the zero age main sequence (ZAMS) or older, the driving mechanism for this magnetic activity is thought to be a stellar dynamo: stars with convective envelopes and rapid rotation are relatively luminous X-ray sources compared with slower rotating stars of similar spectral type. There is now a well-founded age-rotation-activity paradigm (ARAP – see Jeffries 1999; Randich 2000), established via observations of many open clusters with ages from 50 Myr to several Gyr (e.g. Stauffer et al. 1994; Stern, Schmitt & Kahabka 1995; Jeffries, Thurston & Pye 1997), whereby younger stars tend to be more rapidly rotating and hence exhibit strong X-ray emission up to a saturated level, where the ratio of X-ray to bolometric flux, . As stars get older, they lose angular momentum and eventually spin down to rotation rates where and decreases further thereafter.
For very young stars in star forming regions with ages Myr, a direct connection between rotation and X-ray activity is much less clear and the presence of an (accretion) disc may play a role in either stimulating or inhibiting the observed levels of X-ray activity (see Feigelson et al. 2003; Flaccomio et al. 2003a; Flaccomio, Micela & Sciortino 2003b; Stassun et al. 2004; Preibisch et al. 2005). Feigelson et al. (2003) find no correlation between rotation and X-ray activity and a “saturation level” of only for pre-main-sequence (PMS) stars, both with and without discs, in the Orion Nebula Cluster (ONC). They suggest that a less efficient, turbulent “distributed” dynamo may act throughout the convective zones of these stars. On the other hand Flaccomio et al. (2003a,b) and Stassun et al. (2004) suggest that ONC stars with accretion discs bias the average downwards, perhaps as a result of intrinsic absorption or changes in the magnetic field geometry. Preibisch et al. (2005) show that active accretion, rather than the mere presence of a disc is possibly responsible for the wider spread and lower median level of X-ray activity among the very young ONC stars.
NGC 2547 is an interesting open cluster in the context of studying the transition between the early behaviour of stellar coronae in star forming regions and the development of the well tested ARAP at older ages. It has a precisely determined age of either Myr determined from fitting isochrones to its 0.3–1.2 stars as they descend their PMS tracks (Naylor et al. 2002), or Myr determined from the re-appearance of lithium in the atmospheres of even lower mass stars (Jeffries & Oliveira 2005). It is old enough that inner circumstellar discs have dispersed – no accretion-related H emission or -band near infrared excesses are seen from its solar-type members (e.g. Jeffries, Totten & James 2000; Young et al. 2004). However, cluster members with are still in the PMS phase, stars with are fully convective (Siess, Dufour & Forestini 2000; D’Antona & Mazzitelli 1997) and it is significantly younger than other well-studied open clusters like IC 2391 ( Myr) and the Alpha Per cluster ( Myr).
NGC 2547 was observed at X-ray wavelengths by the ROSAT High Resolution Imager (HRI). Jeffries & Tolley (1998) found a rich population of low mass, X-ray active cluster candidates with erg s-1. Puzzlingly, the solar-type stars of NGC 2547 seemed slightly less X-ray active than their counterparts in older clusters. Their activity peaked at , whereas the most active stars at lower masses had as expected. Jeffries, Totten & James (2000) ruled out anomalously slow rotation rates in the cluster as an explanation; they found both very fast and slow rotators among the X-ray selected members. A further possibility is that the energy distribution of the X-ray emitting plasma is rather different for the solar-type stars of NGC 2547 than for those in older clusters or cooler stars – the HRI observations had no spectral resolution and so a uniform conversion factor was used to estimate X-ray fluxes from count rates.
In this paper we present the results of an XMM-Newton observation of NGC 2547 using the European Photon Imaging Camera (EPIC), which seeks to characterise the coronal emission of solar-type (and lower mass) stars at Myr. The sensitivity of these X-ray images is better than the ROSAT HRI data, enabling us to identify cluster members with lower activity and measure X-ray emission from cluster members with lower mass. There is also some spectral resolution available with the EPIC data that allows us to test whether the X-ray spectra of the solar-type members of NGC 2547 are significantly different to active stars in other open clusters. Finally, we are able to look for possible variability in the level of X-ray emission of these young stars on a timescale of 7 years, which is comparable with the solar magnetic activity cycle.
Section 2 describes the observations, data analysis and identification of X-ray sources with members of NGC 2547. Section 3 deals with spectral analysis of the X-ray data, whilst section 4 uses the spectral information to calculate intrinsic luminosities and search for evidence of dynamo-related activity. Section 5 looks at the X-ray variability of NGC 2547 members, both within the observation (flares, rotational modulation) and on the longer 7 year timescale. Section 6 places NGC 2547 in context with younger and older clusters and discusses the evolution of X-ray activity, coronal temperatures and coronal variability. Our conclusions appear in section 7.
2 Observations and Data Analysis
NGC 2547 was observed by XMM-Newton between UT 23:16:33 on 2 April 2002 and UT 13:17:53 on 3 April 2002 using the EPIC instrument, for a nominal exposure time of 49.4 ks. The two EPIC-MOS cameras and the EPIC-pn camera were operated in full frame mode (Turner et al. 2001; Strüder et al. 2001), using the medium filter to reject optical light. The nominal pointing position of the observation was RA h 10m 12.0s, Dec d 13m 0.0s (J2000.0). As we shall show in subsequent sections (2.1, 2.2 and 4.1), these data yield an X-ray luminosity threshold (0.3–3.0 keV) for the weakest detected sources of erg s-1 for NGC 2547 cluster members near the centre of the EPIC field of view.
2.1 Source Detection
Version 6.0 of the XMM-Newton Science Analysis System was used for the initial data reduction and source detection. Unfortunately, the data were affected by several periods of high background. Data from the three cameras were individually screened for high background periods and these time intervals were excluded from all subsequent analysis. Observation intervals were excluded where the total count rate (for single events of energy above 10 keV) in the instruments exceed 0.35 s-1 and 1.0 s-1 for the MOS and pn detectors respectively. The remaining useful exposure times were 29.0 ks and 29.4 ks for the MOS1 and MOS2 cameras, but only 13.7 ks for the pn camera, which is more sensitive to high background intervals.
Images were created using the evselect task and a spatial sampling of 2 arcseconds per pixel. The event lists were filtered to exclude anomalous pixel patterns and edge effects by including only those events with “pattern” . The contrast between background and source events was also increased by retaining only those events with energies between 0.3 and 3 keV. The edetect_chain task was used to find sources with a combined maximum likelihood value in all three instruments greater than 10 for the 0.3-3.0 keV energy range. We expect 1-2 spurious X-ray detections at this level of significance, though they would be highly unlikely to correlate with an NGC 2547 member, so will not hamper any analysis in this paper.
Before performing the combined search we executed searches on the individual images to confirm that there were no systematic differences in the astrometry of the brightest sources. Count rates in each detector were determined for sources using exposure maps created within the same task. In addition, count rates were determined for each source in the 0.3–1.0 keV and 1.0–3.0 keV bands separately. A total of 163 significant X-ray sources were found. Some only have count rates measured in a subset of the three instruments because they fell in gaps between detectors, on hot pixels or lay outside the field of view.
2.2 Source Identification
Jeffries & Tolley (1998) showed that the majority of bright X-ray sources in this region are associated with stars in the NGC 2547 cluster. As the purpose of this paper is to examine the X-ray properties of cluster stars, we have restricted our analysis to those X-ray sources with counterparts among photometrically selected cluster members taken from the catalogues of Naylor et al. (2002) and Jeffries et al. (2004).
The EPIC X-ray source list was correlated with: (1) the photometrically selected members based on the D’Antona & Mazzitelli (1997) isochrones and photometry in Naylor et al. (2002 – their Table 6), which incorporates photometry of bright cluster members from Clariá (1982); (2) photometrically selected members based on either the D’Antona & Mazzitelli or Baraffe et al. (2002) isochrones and photometry in Jeffries et al. (2004 – their Tables A.2 and A.3)
The correlation took place in two stages. In stage 1 correlations were sought with bright (maximum log likelihood ) X-ray sources that have small formal position uncertainties. The purpose was to establish how much additional systematic error there might be in the XMM-Newton astrometry and whether there was any systematic offset in the X-ray source positions111The absolute astrometric accuracy of the optical catalogues is of order 0.2 arcseconds and they have astrometry that is internally consistent to arcseconds.. It was found that an offset of 1.48 and 0.05 arcseconds needed subtracting from the RA and Dec of the X-ray positions and that an additional systematic error of 1.2 arcseconds (1-) needed adding in quadrature to the X-ray astrometric uncertainties in order to yield a reduced of unity in the fit to the mean offset of 38 bright X-ray/cluster-object correlations. This additional error corresponds perfectly with the expected precision of the current XMM-Newton attitude reconstruction (Kirsch et al. 2005). In stage 2 this offset and additional error were applied and the full X-ray source list correlated with the membership catalogues using an error circle of radius 3 times the total positional error. 103 correlations were found between selected members and X-ray sources and 67 correlations between selected members and X-ray sources. There are a total of 108 X-ray sources with a cluster counterpart, 5 of which were not considered members by Naylor et al. (2002) using photometry (they look just too blue in ) and 8 of which are not considered members by Jeffries et al. (2004) using photometry (3 look just too blue in the vs diagram and 5 lie a little too far above the cluster isochrone in vs ). A further 33 objects that are members in the catalogue have no good photometry in the catalogue, mostly because these stars are too bright and were saturated in the deeper images. We choose to include all the above objects as likely cluster members.
Colour magnitude diagrams for the X-ray sources with cluster counterparts are shown in Figs. 1, 2 and 3. A distance of 417 pc, , and were assumed (see Jeffries & Oliveira 2005 and references therein). Cluster candidates that lie within 15 arcminutes of the XMM-Newton pointing and which were not detected as X-ray sources are shown for comparison. Details of the X-ray sources with cluster counterparts are given in Tables 1 and 2. The number of spurious correlations was estimated by applying random 30 arcsecond offsets to the X-ray sources. From these tests fewer than 2 of the 108 cluster X-ray sources are expected to be spurious correlations. X-ray sources are detected from across the mass range covered by the cluster members. For low-mass objects our census is limited by the sensitivity of the X-ray observations (see section 4.1). The faintest detected cluster members have and , corresponding to about 0.25 from the isochrones used in Figs. 2 and 3. The observations are not sensitive enough (by a factor of a few) to detect brown dwarfs if they have an X-ray to bolometric flux ratio of .
The remaining 55 X-ray sources with no cluster counterpart are listed in Table 3. In an exposure of this length it is quite probable that many of these sources are extragalactic and there may also be a number of magnetically active field stars unassociated with the cluster. However, we have not listed possible correlations with the full optical catalogues of Naylor et al. (2002) and Jeffries et al. (2004) because the expected number of spurious correlations down to the limits of these catalogues (which would still have plausible X-ray-to-optical flux ratios for extragalactic sources) is of order 50 and many have several counterparts. These X-ray sources will not be discussed further in this paper.
| No. | Name | RA | Dec | ML | pn count rates (s-1) | HR (pn) | |||
| J2000 | arcsec | (0.3-3.0) keV | (0.3-1.0) keV | (1.0-3.0) keV | |||||
| (1) | (2) | (3) | (4) | (5) | (6) | (7) | (8) | (9) | (10) |
| 3 | XMMU J081012.9-491408 | 8 10 12.90 | -49 14 08.6 | 1.22 | 2896.14 | 5.62E-022.33E-03 | 3.46E-021.84E-03 | 2.16E-021.43E-03 | -0.2310.040 |
| 4 | XMMU J080947.2-491305 | 8 09 47.25 | -49 13 05.1 | 1.23 | 2607.62 | 5.40E-024.29E-03 | 4.15E-023.73E-03 | 1.25E-022.12E-03 | -0.5360.068 |
| MOS1 count rates (s-1) | HR (M1) | MOS2 count rates (s-1) | HR (M2) | ||||
| (0.3-3.0) keV | (0.3-1.0) keV | (1.0-3.0) keV | (0.3-3.0) keV | (0.3-1.0) keV | (1.0-3.0) keV | ||
| (10) | (11) | (12) | (13) | (14) | (15) | (16) | (17) |
| 1.62E-028.15E-04 | 8.77E-035.89E-04 | 7.46E-035.62E-04 | -0.0810.050 | 1.74E-021.03E-03 | 9.38E-037.52E-04 | 8.01E-037.02E-04 | -0.0790.059 |
| 2.03E-029.37E-04 | 1.24E-027.26E-04 | 7.81E-035.93E-04 | -0.2290.045 | 2.13E-029.96E-04 | 1.46E-028.20E-04 | 6.77E-035.66E-04 | -0.3650.044 |
| No. | ID (N02) | Sep | ID (J04) | Sep | (0.3-3 keV) | ||||||||
| arcsec | arcsec | bc() | bc() | bc() | erg s-1 | ||||||||
| (1) | (2) | (3) | (4) | (5) | (6) | (7) | (8) | (9) | (10) | (11) | (12) | (13) | (14) |
| 3 | 13 516 | 1.08 | 13.637 | 0.791 | 0.912 | 13 98 | 1.11 | 12.741 | 0.430 | 9.17E-04 | 8.76E-04 | 7.46E-04 | 2.26E+301.46E+29 |
| 4 | 14 32 | 0.69 | 12.301 | 0.536 | 0.698 | 13 34 | 0.75 | 11.605 | 0.326 | 3.45E-04 | 3.31E-04 | 2.80E-04 | 2.54E+301.71E+29 |


3 Spectral Analysis
3.1 X-ray spectra


Ten cluster candidates were chosen for a detailed spectroscopic examination. These ten sources were those with the largest number of detected X-ray photons, with 300-670 counts in the pn detector and 230-530 counts in the MOS1/MOS2 detectors respectively. Source spectra of these stars were extracted from circular or elliptical regions with radii arc sec. This relatively small extraction region was used to minimise the significant subtracted background. A larger (45 arcsec) extraction radius for the brightest source was used to check that the smaller extraction radius did not change the derived spectral parameters. The same filtering expression used to generate the images was used for source extraction. For 9 of the stars spectra were obtained from all three EPIC instruments. Star 11 lay in a region of the pn detector which was excluded by the selection expression described earlier, and thus only MOS data were used for this star. Annuli around each source were used to estimate the background.
Redistribution and ancillary response matrices were generated using the rmfgen and arfgen tasks. One matrix was generated per instrument (based on star 3) and then used for each of the stars. Energy ranges above 0.3 keV were considered in the analysis, but the spectra were binned such that there were at least ten source counts per bin and then modelled using xspec.
A single optically thin thermal plasma (mekal – Mewe, Kaastra & Liedahl 1995) component modified by photoelectric absorption (a 1-T model) was used as an initial model. The column density of the absorption was fixed at cm-2. This corresponds to the reddening estimated for bright cluster members and is unlikely to be uncertain by more than a factor of two (see Jeffries & Tolley 1998)222Experiments which allowed the column density to be a free parameter showed that the X-ray spectra could only constrain the column density to be cm-2 because of the lack of sensitivity to this parameter at energies keV and the possibility to compensate for changes in column density with changes in the emission measure of a cool coronal component. The metal abundance was a free parameter (in the form of a multiple of the solar metal abundances of Anders & Grevesse 1989) while the normalisation of the mekal component was allowed to optimise independently for the three EPIC instruments to counter the effects of any cross-calibration uncertainties. In general, good agreement was found between the three normalisations. The best-fit parameters and values of these model fits are given in Table 4. An example spectral fit is shown in the top panel of Fig. 4.
The 1-T model fits are on the whole statistically acceptable. In two cases (stars 3 and 10), the 1-T model is rejected at 99 per cent confidence. A second mekal component was added to the models (a 2-T model), which of course improved the fit in all stars (Table 5 and see the lower panel of Fig. 4). For four objects the upper bound to the temperature of the second component could not be constrained; these stars are indicated by an asterisk in Table 5. All of the 2-T models are statistically acceptable, and there are significant reductions chi-squared values in 8 cases (statistically justified at per cent according to a likelihood ratio test).
Little weight should be attributed to this. It has commonly been found that multi-temperature fits are required to fit coronal X-ray spectra once a sufficiently precise spectrum is obtained. Even then, a 2-T model is probably a crude approximation to the true differential emission measure (DEM). The pattern here appears to be that the DEM could be approximated with a 2-T model with a lower temperature keV and an upper temperature keV. In spectra with insufficient counts or where one component is significantly larger (in terms of the number of X-ray photons produced) than the other, then a 1-T fit is adequate with . The relative emission measure of the two components reveals that those 2-T models for which is unconstrained are where the cooler component is dominant.
Perhaps the biggest difference between the 1-T and 2-T models is that adding the extra mekal component relaxes somewhat the requirement for a very low metallicity in the 1-T fits. Even so, significantly subsolar metallicities are implied by all the 2-T fits, with an average . This value is likely dominated by the effects of a group of strong (unresolved) iron lines around 1 keV. The deduction of low coronal metallicity is a common feature of spectral fits to X-ray data from low-mass stars with high levels of magnetic activity (e.g. Briggs & Pye 2003; Güdel 2004). Telleschi et al. (2005) studied solar analogues at a range of ages, finding that coronal iron abundances decrease from solar values for an average coronal temperature of 4 MK to half-solar at temperatures of 10 MK. The NGC 2547 stars have average (emission measure weighted) coronal temperatures MK, so a coronal metallicity of is not surprising.
| Star | EM | () | ||||
|---|---|---|---|---|---|---|
| (keV) | (cm-3) | |||||
| 3 | 0.791 | 1.05 (0.98 1.11) | 53.39 (53.33 53.45) | 0.16 (0.14 0.21) | 130.7 (1.49) | 0.01 |
| 4 | 0.536 | 0.68 (0.65 0.74) | 53.55 (53.49 53.62) | 0.13 (0.10 0.18) | 57.5 (0.80) | 0.89 |
| 5 | 1.485 | 1.38 (1.26 1.66) | 53.43 (53.34 53.48) | 0.12 (0.07 0.21) | 105.7 (1.22) | 0.08 |
| 6 | 0.994 | 0.80 (0.74 0.87) | 53.52 (53.46 53.58) | 0.05 (0.03 0.07) | 71.7 (0.96) | 0.59 |
| 7 | -0.06 | 0.69 (0.65 0.73) | 53.16 (53.05 53.27) | 0.23 (0.16 0.35) | 59.7 (1.07) | 0.34 |
| 8 | -0.08 | 0.70 (0.66 0.77) | 53.13 (53.00 53.24) | 0.25 (0.18 0.37) | 59.2 (0.99) | 0.50 |
| 9 | 0.622 | 0.87 (0.80 1.03) | 53.15 (53.06 53.24) | 0.12 (0.08 0.17) | 40.5 (0.96) | 0.54 |
| 10 | 0.693 | 0.82 (0.76 0.88) | 53.23 (53.14 53.30) | 0.12 (0.09 0.18) | 82.1 (1.55) | 0.01 |
| 11 | 0.755 | 1.02 (0.91 1.11) | 53.47 (53.40 53.54) | 0.10 (0.06 0.15) | 54.5 (1.19) | 0.18 |
| 12 | 0.704 | 1.05 (0.95 1.35) | 53.06 (52.96 53.15) | 0.13 (0.08 0.20) | 50.4 (1.33) | 0.09 |
| Star | EM1 | EM2 | () | |||
|---|---|---|---|---|---|---|
| (keV) | (keV) | (cm-3) | (cm-3) | |||
| 3 | 0.61 (0.49 0.68) | 1.62 (1.37 1.96) | 52.70 (52.47 52.89) | 53.07 (52.94 53.18) | 0.45 (0.30 0.68) | 93.1 (1.11) |
| 4 | 0.64 (0.56 0.69) | 1.51 (0.97 5.93 ) | 53.34 (53.20 53.54) | 52.84 (52.65 53.07) | 0.19 (0.13 0.30) | 47.4 (0.70) |
| 5 | 1.07 (0.96 1.30) | 9.99 (6.22 –) | 53.24 (53.19 53.45) | 52.74 (52.54 52.92) | 0.09 (0.05 0.13) | 92.5 (1.10)* |
| 6 | 0.68 (0.64 0.79) | 8.22 (1.69 –) | 53.43 (53.23 53.53) | 52.58 (53.34 53.64) | 0.06 (0.04 0.10) | 57.2 (0.79)* |
| 7 | 0.67 (0.61 0.71) | 1.14 (0.61 –) | 53.04 (52.79 53.22) | 52.00 (– 52.73) | 0.31 (0.19 0.56) | 54.5 (1.05)* |
| 8 | 0.57 (0.40 0.69) | 0.79 (0.71 2.81) | 52.62 (52.35 53.18) | 52.92 (– 53.18) | 0.31 (0.21 0.81) | 53.7 (0.96) |
| 9 | 0.57 (0.43 0.69) | 1.14 (0.99 1.35) | 52.62 (– 52.89) | 52.87 (52.80 53.07) | 0.22 (0.13 0.37) | 25.6 (0.67) |
| 10 | 0.63 (0.42 0.70) | 1.52 (1.18 2.06) | 52.66 (52.38 52.95) | 52.81 (52.60 53.00) | 0.36 (0.21 0.54) | 60.5 (1.23) |
| 11 | 0.81 (0.72 0.93) | 9.99 (2.02 –) | 53.39 (53.26 53.51) | 52.64 (52.29 52.87) | 0.10 (0.06 0.19) | 43.8 (1.00)* |
| 12 | 0.64 (0.51 0.82) | 3.53 (2.28 7.75 ) | 52.40 (51.91 52.79) | 52.73 (52.54 52.90) | 0.43 (0.18 0.70) | 25.6 (0.75) |
3.2 Hardness ratios


Due to low numbers of counts, spectral fitting barely provides constraints on the temperature distribution of the coronal plasma even in the brightest NGC 2547 sources. Nevertheless, there is sufficient evidence here that these coronae follow the often observed pattern that, given sufficient statistics, a multi-component thermal model fits the data better than a single temperature. To extend our analysis to fainter sources, the hardness ratio, defined as , where is the count rate in the 0.3–1.0 keV band and is the count rate in the 1.0–3.0 keV band, was modelled in terms of a 2-T corona. The purpose is to provide a physical interpretation for any trends in the spectral distribution with type of star or overall X-ray activity level and also to estimate how any spectral changes might influence the conversion from X-ray count rates into fluxes (see Section 4).
Figure 5 shows plots of the hardness ratios in the pn detector versus colour and also versus count rate. The plots for the MOS detectors are similar, but noisier, and are omitted for brevity. These hardness ratios were simulated using a 2-T model, with fixed temperatures of keV, keV, a fixed metallicity of and cm-2. This simple, though not unique, model is justified by the spectral fitting results in section 3.1. The emission measure ratio of the two components is altered to generate a given hardness ratio. The required emission measure ratio (hot/cold) is indicated against the y-axes of Figure 5.
Recent work on high quality X-ray spectra of nearby stars with varying activity levels has identified a trend of increasing emission measure weighted mean coronal temperature with X-ray activity (e.g. Telleschi et al. 2005). The same trend, albeit with poorer ROSAT spectra, has also been identified among stars of the Pleiades cluster (Gagné, Caillault & Stauffer 1995a). There is evidence for this in Fig. 5 in terms of increasing hardness ratio and therefore hotter coronae as the pn count rate (and hence X-ray luminosity) rises. A fitted relationship of the form HR(pn) (shown as a dashed line) appears a reasonable description. However, there is also evidence for an intrinsic scatter in this relationship, especially at pn count rates of 0.005–0.01 s-1. The reduced chi-squared is 2.53, indicating that further parameters may be important. The plots of hardness ratio versus colour reveal why this may be so. There are two groups of stars with the highest hardness ratios: at and at , corresponding to G and M stars respectively. M stars are smaller than G stars and as we will see in the next section, tend to have lower peak X-ray luminosities. Nevertheless, many M stars appear to have hot coronae and thus it seems that the variable that truly predicts average coronal temperature may be an activity indicator that is normalised by stellar surface area, such as the surface X-ray flux or the ratio of X-ray to bolometric luminosity.
Three other features of the plots are worthy of comment. First, there seem to be a lack of K stars () with large hardness ratios. In fact, given the small number of such objects in the sample, that conclusion is not statistically sound. The same could be said of the apparent decrease in hardness ratios as we move from G to F stars (recalling that NGC 2547 has ) or . However, this trend would match observations in the field and other clusters that F-stars have significantly cooler coronae than G-M stars (e.g. Gagné et al. 1995a; Panzera et al. 1999). Third, the hardness ratio versus plot adds a further 9 data points for hotter stars. The distribution of hardness ratios for these stars is not distinguishable from the rest of the sample. This is important because these 9 A and B stars have no subphotospheric convection zones and no massive winds (bar perhaps the hottest object in the sample) that may be capable of generating X-ray activity. It is widely hypothesised that the X-ray emission from these stars comes from lower-mass companions. That the (crude) spectral properties of these X-ray sources are similar to the bulk of the sample provides support for this idea.
4 X-ray activity levels in NGC 2547


4.1 X-ray luminosity
To look at the overall level of activity in the cluster as a function of colour/spectral type/ requires a means of calculating X-ray luminosity and the ratio of X-ray to bolometric luminosity. For simplicity, and also because the available spectral information is too sparse to do otherwise for most sources, a uniform conversion factor between X-ray count-rate and unabsorbed X-ray flux in the 0.3–3.0 keV range was assumed for each of the three cameras. To do this, the mean hardness ratio in each of the cameras was compared with the two-component spectral model predictions discussed in section 3.2. From this it seems appropriate to adopt an average X-ray spectrum consisting of a 2-T model with an emission measure ratio of hot/cool and . This yields conversion factors (from counts in the 0.3–3.0 keV range to a flux in the 0.3–3.0 keV range) of , and erg cm-2 per count for the pn, MOS1 and MOS2 detectors respectively333To compare with luminosities given in other flux bands in the literature, our values should be multiplied by 1.21 to obtain in the 0.1–2.4 keV range and by 0.91 to obtain in the 0.5–8.0 keV range.
There is little uncertainty injected by assuming a uniform conversion factor regardless of hardness ratio. The variation in the conversion factor is less than per cent for the most extreme hardness ratios found in our data - with harder coronae leading to larger conversion factors. We have also tested variations in the assumed metal abundances between and . Changing the metal abundance while keeping other parameters fixed leads to conversion factor variations of per cent, with more metal-poor coronae yielding larger conversion factors. Altering the absorbing column from our assumed value of cm-2 to cm-2 or cm-2 leads to conversion factors that are only 6 per cent smaller or 25 per cent larger respectively.
Figure 6 shows the X-ray luminosity (0.3–3.0 keV) of cluster members versus and . A weighted mean was used where measurements from more than one EPIC detector were available. A distance of 417 pc was assumed. Uncertainties in have been estimated using the count rate errors, but we added a further 10 per cent systematic error in quadrature for each EPIC count rate to cover uncertainties in the detector PSF modelling in the SAS edetect_chain task (e.g. Saxton 2003). Figure 7 shows similar plots for the distance-independent ratio of X-ray to bolometric luminosity, as a function of and . The bolometric corrections are those used to produce the isochrones in Figs. 1 and 2 and are fully described in Naylor et al. (2002). The bolometric correction–colour relationship becomes very uncertain for and the plot is to be preferred in those cases. and values are listed in Table 2.
The dashed lines in Figs. 6 and 7 represent an approximate sensitivity limit for the EPIC observations, based on an object observed by all 3 detectors at the centre of the field. This limit is erg s-1, corresponding to about 13 detected source counts in the MOS detectors and about 23 source counts in the pn detector. The detection threshold rises to erg s-1 for sources more than 10 arcminutes from the centre of the X-ray image.
Figures 6 and 7 reveal a pattern of X-ray activity that has become familiar in older open clusters (e.g. the Pleiades – Stauffer et al. 1994; NGC 2516 – Jeffries et al. 1997), but is particularly well delineated here. X-ray emission is seen at all spectral types. Early type stars have a wide spread in activity levels; there is a trend of increasing and moving from F through to G stars. The X-ray activity of G and K stars has less than a factor of five spread and appears saturated at . All the detected M stars () have activity levels that are as high (or even higher), but it is not immediately apparent whether a population of lower activity objects might be present, as the least active detected objects lie at the X-ray detection sensitivity threshold.
4.2 Completeness and contamination
Whether the X-ray selected sample of NGC 2547 members is complete or whether it is contaminated by X-ray active field stars, as a function of spectral type, has been discussed at length by Jeffries & Tolley (1998) and Jeffries et al. (2000). For completeness we briefly re-visit those arguments which are based on the appearance of Figs. 1, 2 and 7.
The first point to make is that Figs. 1 and 2 indicate that the vast majority of photometric cluster candidates within the XMM-Newton field of view are X-ray detected. The exceptions are a handful of early-type objects, a clump of objects at , and an increasing number of undetected objects at . The latter group might simply be explained in terms of a gradual decrease in the X-ray luminosity of cluster members with decreasing , which intercepts the detection sensitivity limit (for the centre of the field) at around . Hence the average X-ray properties of the M-type NGC 2547 members will be biased upwards by the non-detection of less active cluster members with .
The X-ray quiet objects at intermediate colours are almost certainly background giants which thrust a “finger” of contamination through the NGC 2547 colour-magnitude loci at these colours. This interpretation is supported by Fig. 6 which shows that the X-ray census in NGC 2547 is very likely to be complete for G and K stars (, ), because the sensitivity threshold is some way below the least active detected cluster members at these colours. Of course there could be a small tail of G/K stars with very low activity, but there would only be scope for such a population at the colours occupied by the giant contaminants. In particular, all photometric candidates with were detected by XMM-Newton.
Contamination of our X-ray selected sample is likely to be very light. Not only would the contaminants have to be at a small range of distances consonant with appearing in colour-magnitude diagrams at the same position as NGC 2547 members, but they would need to possess comparable levels of X-ray activity. F-K type stars have X-ray activity levels that are a sharply declining function of age (see section 6.1), so few field stars would jointly meet these criteria. Jeffries et al. (2000) found that 23/24 photometrically selected, X-ray active NGC 2547 candidates were probable members on the basis of their radial velocities. Higher levels of contamination are possible among M-stars as these have more slowly decaying X-ray activity and a higher spatial density in the field. However, Jeffries & Oliveira (2005) have shown that per cent of candidate cluster M-dwarfs selected by photometry alone turn out to be members when investigated spectroscopically. As the X-ray properties of any small number of contaminants are likely to be similar to the cluster members, they should not unduly bias the results and conclusions.
4.3 Coronal temperature variation with activity


The top panel of Fig. 5 demonstrates that more luminous X-ray coronae are hotter on average. However, the scatter in this plot hints at a dependence on another parameter. Figure 8 shows how the pn hardness ratio varies with the activity indicators and the surface X-ray flux, (radii as a function of colour were obtained from the evolutionary models used to obtain the isochrone in Fig. 2). Only those stars with a measurement were used, to avoid any scatter introduced by the inclusion of early-type stars in which the dominant optical source is probably not the source of the X-rays.
Curves of the form HR(pn) and HR(pn) were fitted, which do indicate significant correlations between hardness ratio and X-ray activity. According to the 2-T modelling of the hardness ratio (see section 3.2) this corresponds to an emission measure ratio of hot to cool plasma which changes from about zero at , erg s-1 cm-2 to unity at , erg s-1 cm-2. However, the reduced chi-squared of these fits are 2.47 and 1.95 respectively (with 82 degrees of freedom). Both the significance of the correlations and the scatter are almost the same as found for the hardness ratio versus pn count-rate relationship in section 3.2. Thus , or could be used to predict how hot a coronae will be, but are not deterministic in the sense that an rms hardness ratio scatter of about 0.15 exists at a given , or . This cannot be explained by the measurement errors and corresponds roughly to a variation of a factor 2 in the emission measure ratio of the hot to cool plasma in the 2-T model.
4.4 The rotation-activity connection
Jeffries et al. (2000) published projected equatorial velocities () for 23 probable members of NGC 2547 which have and hence spectral types from late F to early K. They found both fast ( km s-1) and slow ( km s-1) rotators. Evidence for a rotation-activity relationship was found among the cooler stars of this sample () – all such stars with km s-1 had saturated levels of X-ray activity. The evidence was less clear among hotter stars, probably because the rapidly changing convective zone depth as a function of caused significant scatter in the dynamo efficiencies at a given rotation rate.
This relationship was re-examined using the XMM-Newton data, but adopting a more physical approach that incorporates both rotation and the properties of the subphotospheric convection zone. An approximate Rossby number, the ratio of rotation period to convective turnover time at the base of the convection zone, was calculated for each of the 23 NGC 2547 members in the Jeffries et al. (2000) sample. The relationship between convective turnover time and from Noyes et al. (1984) was used. This is more appropriate for main sequence stars, but the NGC 2547 stars considered here are almost at the ZAMS so this should not lead to serious errors (see Gilliland 1986 and section 6.1). The period was estimated from the and a radius obtained from the D’Antona & Mazzitelli (1997) isochrone shown in Fig. 1. We divided each by to correct for an average projection effect.
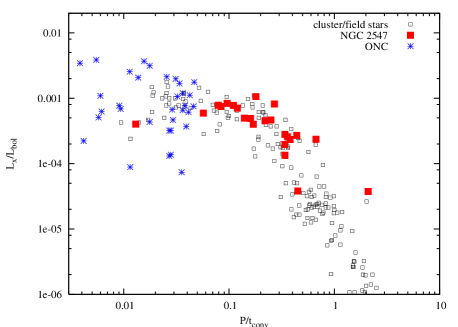
Figure 9 shows X-ray activity, expressed as versus the Rossby number. Similar data are plotted for a large number of G/K field and cluster stars. These are from the compilation of Pizzolato et al. (2003), who also used the Noyes et al. (1984) estimation of convective turnover time, and for a group of solar-type (0.5–1.2 ) ONC stars with rotation periods from Getman et al. (2005), where a mean convective turnover time of 250 years has been assumed (see Preibisch et al. 2005). This latter assumption may introduce at most a factor of two horizontal scatter in the plot. To provide an accurate comparison, the NGC 2547 X-ray fluxes have been increased by a factor of 1.21 to match the 0.1-2.4 keV range of the Pizzolato et al. fluxes. The published 0.5–8.0 keV ONC X-ray fluxes were increased by a factor of 1.38 (see Preibisch & Feigelson 2005).
The NGC 2547 objects fit the pattern defined by other young clusters and field stars perfectly, with a scatter of about a factor of two about a mean relationship. increases from in the slow rotators or those stars with thinner convection zones and shorter convective turnover times, up to a peak level (in the 0.1–2.4 keV band) of . This contrasts with the level of found by Jeffries & Tolley (1998), a discrepancy which is investigated and explained in section 5.2. There is one object in NGC 2547 which has a of at least 160 km s-1, a very small Rossby number, and which seems to have a lower “super-saturated” level of X-ray activity. Similar objects have been found in the IC 2391 and Alpha Per clusters (e.g. Prosser et al. 1996; Randich 1998). In contrast, PMS stars in the ONC all have Rossby numbers that would put them in the saturated or super-saturated regime, but show a much larger scatter ( orders of magnitude) in X-ray activity at a given Rossby number. Preibisch et al. (2005) claim that much of this scatter is due to actively accreting objects, of which there are none in the NGC 2547 sample (Jeffries et al. 2000).
5 X-ray variability
5.1 Short-term variability


| ID | Quiescent | Peak | Duration | Energy |
|---|---|---|---|---|
| (erg s-1) | (ks) | (ergs) | ||
| 3 | 8 | |||
| 5 | 36 | |||
| 10 | 12 | |||
| 12 | 4 | |||
| 13 | 16 | |||
| 15 | 12 | |||
| 83 | 36 | |||
Short term ( day) X-ray variability in young low-mass stars is a well known phenomenon and can be caused by changes in coronal structures, rotational modulation, eclipses or flaring of a magnetic origin (see Güdel 2004 for a review).
For some of the X-ray bright NGC 2547 members, there are sufficient detected counts to construct light curves. For the fainter sources we can only hope to detect longer term variations in the X-ray activity (see section 5.2). Background subtracted light curves were constructed for the 10 brightest NGC 2547 sources using the sum of events in the MOS1 and MOS2 detectors. Only data from good (low background) time intervals (as discussed in section 2.1) were included, resulting in numerous, but small, gaps in the coverage. We did not use the pn data because of the much larger gaps in the coverage. The extraction and background regions were similar to those used to obtain spectra. For the purposes of comparison with published information on younger and older clusters (see section 6.3), light curves were extracted in a similar way for all solar-type stars with , corresponding to according to the isochrone used in Fig. 2.
Initially the background subtracted light curves were put into 4 ks bins, a few of the brighter targets had sufficient counts to reduce this to 2 ks. The periods of high background were sufficiently dispersed in the MOS data that there was adequate information to obtain reasonably well sampled light curves that cover ks, beginning at MJD 2452367.4786. The count rates shown of course take account of the gaps in the coverage. A simple chi-squared test revealed 12/30 stars showing significant ( per cent confidence) variability. X-ray light curves for these stars are shown in Fig. 10. As expected, the variable stars tend to be the brighter among our sample, with the best statistics. We suspect that, given sufficient signal-to-noise ratios, all of the NGC 2547 targets would show variability at some level.
Some of the variability seen may well be due to flares. Several of the light curves showed the characteristic rapid rise and longer decay that is often seen in X-ray flares on the Sun and other stars. A couple of other “events” were more questionable. We chose to be reasonably relaxed in our definition of a flare and indicate in Fig. 10 those stars and time intervals we considered to represent flaring behaviour. To estimate some crude energetic parameters for these flares, the same count-rate to intrinsic flux conversion factor was assumed to be valid throughout the flare even though the coronal plasma will likely be hotter than average during flare events. It was found in section 4.1 that the conversion factor was quite insensitive to spectral parameters, but as the conversion factor does increase with temperature, the flare energies and luminosities are probably under-estimates. The correction between the count-rates in the light curves, which were extracted from a small radius, and the total count-rate, was provided by comparing the average light curve count-rate with those in Table 1 which include a PSF correction. A quiescent luminosity was defined using the average flux outside of the flare and a peak flare luminosity was esimated. The latter was quite uncertain and probably under-estimated because of the low time resolution. Finally, a total flare energy above that which the star would have emitted in its “quiescent” state was calculated.
The “flare” parameters, for the energy range 0.3–3.0 keV, are listed in Table 6. Given these values we are confident that we would have detected all flares on the solar type stars with integrated energies in excess of erg s-1. The exception could be for the case of very long duration ( ks) flares which might not be distinguishable from rotational modulation (see below). Short flares ( ks), as seen in some young stars (see Stelzer et al. 2000) would not be properly resolved but would easily be seen as 1-2 very high points if the flare energy exceeded erg.
For stars 6, 9, 11, 26 and 32 the variability does not appear to be flare-like, but rather could be due to the rotational modulation of reasonably compact coronal structures. In particular, the light curve of star 11 could be repeating with a period of 30 ks. Unfortunately there is no published information on this star to decide whether a period of 0.35 days is plausible, but stars that rotate this rapidly exist in other young clusters. At this rotation rate, the star would be have a Rossby number of 0.024 – approaching the super-saturated part of Fig. 9. Star 11 actually has , which could indicate the onset of super-saturation, but is not conclusive. Stars 9 and 32 are at least moderately fast rotators with of 27 and 12 km s-1 and hence have rotation periods that are shorter than 1.9 and 3.6 days respectively. Star 6 is a slow rotator with km s-1 and star 26 is a close spectroscopic binary with two slowly rotating components (Jeffries et al. 2000). It is worth noting that the fastest known rotators in the cluster (stars 4 and 21 in this paper, labelled RX 30a and RX 35 in Jeffries et al. 2000), with values of 86 and 160 km s-1 respectively, show no signs of variability at the per cent level. The X-ray light curve for star 4 is shown in Fig. 10.
5.2 Long term variability
| No. | RX | Sep | HRI count rate (s-1) | HRI | HRI (0.3–3 keV) | ||
|---|---|---|---|---|---|---|---|
| arcsec | bc() | bc() | bc() | erg s-1 | |||
| (1) | (2) | (3) | (4) | (5) | (6) | (7) | (8) |
| 3 | 53 | 2.5 | 1.28E-031.70E-04 | 4.27E-04 | 4.08E-04 | 3.47E-04 | 1.05E+30 |
| 4 | 30 | 2.7 | 4.21E-032.90E-04 | 4.83E-04 | 4.63E-04 | 3.92E-04 | 3.56E+30 |
| RX | ID (N02) | HRI count rate (s-1) | HRI | HRI (0.3–3 keV) | XMM | XMM | ||
|---|---|---|---|---|---|---|---|---|
| 20 | 14 2133 | 20.634 | 3.261 | 2.20E-048.00E-05 | 3.91E-03 | 1.96E+29 | 1.19E-03 | 5.98E+28 |
| 23 | 18 2322 | 19.109 | 2.832 | 3.50E-041.00E-04 | 2.60E-03 | 3.06E+29 | 7.49E-04 | 8.82E+28 |
The previous observation of NGC 2547 with the ROSAT HRI (Jeffries & Tolley 1998), taken in December 1995, allows an investigation of variations in X-ray activity on a year timescale. The XMM-Newton list of cluster members was cross-correlated against the HRI source positions allowing a correlation radius of up to 16 arcseconds, reflecting the larger positional uncertainties in the HRI data. There are 72 correlations which are identified in Table 7 by their “RX” numbers from Jeffries & Tolley. RX 86 was correlated with, and lay mid-way between, XMM-Newton sources 111 and 113. In the absence of any additional information the X-ray flux in the HRI was split equally between the two.
In Jeffries & Tolley (1998) it was claimed that the most active stars in NGC 2547 were under-active by nearly a factor of two (in terms of ) compared with other young clusters, especially among the G and K stars. This seems not to be the case in the XMM-Newton observations (see sections 4.1 and 4.4) and the discrepancy needs explaining. One possibility that can now be ruled out is that the NGC 2547 stars have peculiarly hot or cold coronae resulting in under-estimated fluxes from the HRI count-rates. Like XMM-Newton, the HRI count-rate to flux conversion factor is quite insensitive to variations in temperature or column density and the coronal parameters we have deduced here are close to the 1 keV coronal temperature assumed by Jeffries & Tolley. After further careful investigation we have found two other effects that resulted in under-estimated HRI fluxes.
First, the spectral response of the HRI was varying with time throughout the ROSAT mission. Using an updated gain and response matrix shift appropriate for the time of the NGC 2547 observation (see David et al. 1999 for details) the count-rate to flux conversion factor was re-calculated for (a) the 0.1–2.4 keV range considered by Jeffries & Tolley (1998) and (b) the 0.3–3.0 keV range for comparison with the XMM-Newton data. In both cases we have assumed the mean coronal model discussed in section 4.1. The case (a) conversion factor is erg cm-2 per count, which is 1.31 times larger than the conversion factor used by Jeffries & Tolley. The case (b) conversion factor which is used to estimate the and (using the same distance and bolometric corrections as in Table 2) values in Table 7 was erg cm-2 per count.
Second, modelling of the HRI PSF was fairly crude at the time of the analysis performed by Jeffries & Tolley (1998). Their point source parameterisation assumed a Gaussian PSF which got broader with off-axis distance. This is a considerable simplification compared with the more complex PSF modelling discussed by Campana et al. (1999) in the context of constructing the Brera Multiscale Wavelet (BMW) ROSAT HRI source catalogue (Panzera et al. 2003). A significant extended “halo” to the PSF means that the count-rates provided by Jeffries & Tolley (1998) may have been significantly underestimated. To test this the Jeffries & Tolley catalogue was correlated against the BMW catalogue, finding 78 matches. The Jeffries & Tolley count-rates were systematically lower by a factor of , where is the off-axis ange in arcminutes. The scatter around this relationship was 0.15 (rms). We have chosen to correct the Jeffries & Tolley count-rates by this factor rather than use the BMW count-rates. The rationale for this is that the BMW catalogue does not include 24 of the 102 sources found by Jeffries & Tolley, 15 of which have XMM-Newton detections of cluster counterparts and 4 of the remaining 9 are also closely correlated with photometric cluster candidates. It seems that Jeffries & Tolley were better at finding X-ray sources even if their count-rates were systematically too low.
For the remaining 36 cluster candidates detected by XMM-Newton which have no HRI counterparts an estimated upper limit to the flux observed by the HRI was made by looking at the minimum detected HRI count-rates (after the correction described above) as a function of off-axis angle. Where no RX number is given in Table 7 this indicates that the HRI count-rate given is an upper limit.
Two significant HRI sources (RX 20 and RX 23) were found which correlate with photometric cluster candidates and lie within the EPIC field of view, but which were not detected by XMM-Newton. Both of these X-ray sources are closely correlated with M-dwarfs from the membership lists of Naylor et al. (2002) and 2-sigma upper limits for the count-rates and X-ray fluxes were calculated for these. The details are given in Table 8.
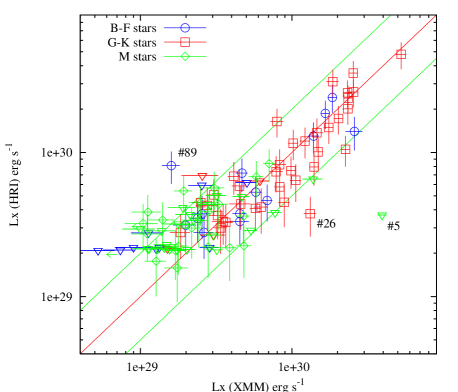
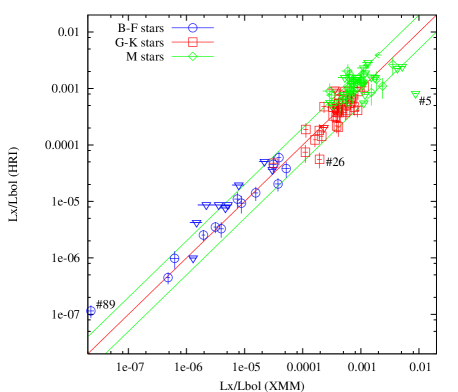
A comparison of the X-ray activity as judged by XMM-Newton and the ROSAT HRI (as listed in Table 7) in the form of both and is shown in Fig. 11. Different symbols (and colours in the electronic version of the paper) are used to represent stars of approximately F-type or earlier (), spectral types G or K () and M-type stars (). Note that the additional error in the corrected HRI count-rates, associated with uncertainties in the HRI PSF has been added in quadrature and incorporated into these diagrams. was calculated using the colour if available, or using otherwise.
Figure 11 shows that there is excellent agreement between the intrinsic X-ray fluxes of stars observed with both XMM-Newton and the ROSAT HRI. The majority of stars have varied by less than a factor of two between the observations. There appears to be some evidence that stars with lower X-ray luminosities were brighter at the time of the HRI observations. Of course this is counterbalanced to some extent by the upper limits on HRI fluxes in the same region of the diagram and by the larger error bars for these sources. Another point to consider is that for X-ray sources with low signal-to-noise, there is an inevitable upward bias if (as is the case here and in Jeffries & Tolley 1998) the position of the X-ray source is a free parameter in the count-rate determination algorithm. This is because the (weak) source tends, on average, to be located at the position of a positive noise peak. This upward bias will predominantly affect the weaker sources in the less sensitive HRI observations. On that basis we don’t believe there is strong evidence that lower luminosity sources are more variable, or for any systematic discrepancy between the HRI and EPIC fluxes as a function of X-ray activity or spectral type.
Various ways of parameterising long-term variability can be found in the literature. To make comparisons we have estimated the fraction of stars that have varied by more than a factor of two and the mean (and median) absolute deviation from equal luminosity. These statistics were calculated for two limited samples: (A) erg s-1; (B) the G/K star sample as defined above. These subsets were chosen to minimise the number of upper limits and to avoid the weak X-ray source bias discussed above. For samples A and B there are 8/60 and 5/40 objects that varied by a factor of two or more, treating the upper limits as detections. The fractions are more likely to be 9/60 and 4/40 given a more thoughtful consideration of where these upper limits lie. The high M-stars could be more variable than average; 5/15 of the M-dwarfs in sample A are variables. However, there is an obvious selection effect favouring a high fraction in this very incomplete sample. The mean (and median) absolute deviations from equal luminosity of samples A and B are almost identical at 0.098(0.095) dex and 0.107(0.094) dex respectively (i.e. a factor of ). The upper limits are treated as detections in this estimate, but their inclusion does not affect the result significantly.
Assuming that the error bars in Fig. 11 represent a normal distribution, we have made simulations under the additional assumption that the two measured luminosities are equal. We find that we would expect mean absolute deviations of 0.087 and 0.088 for samples A and B respectively in any case. This strongly suggests that the majority of sources have not varied at all and that the slightly larger observed mean absolute deviations are attributable to a handful of strongly varying objects, which are discussed below.
There are only three clear examples where we are confident that variations of more than a factor of 2 have occurred (i.e. with deviations well in excess of the estimated errors). These are sources 5, 26 and 89, which are labelled in Fig 11.
Source 5 is an M-dwarf that has clearly undergone an intense flare during the XMM-Newton observation (see section 5.1 and Fig. 10). The “quiescent” estimated in Table 6 is consistent with the upper limit derived from the HRI observation.
Source 26 is a moderately active G-type star, identified as a short period spectroscopic binary by Jeffries et al. (2000). This was identified as variable in the EPIC data, but the light curve only shows a gradual decrease in the X-ray flux during the observation. It is however feasible that we have seen the decay phase of a long duration ( ks) flare that is responsible for increasing the average as viewed by XMM-Newton by a factor of 3 compared with ROSAT.
Source 89 corresponds to the optically brightest star in the cluster, HD 68478 with a B3 iv spectral type. It is just possible that this star is massive enough to generate X-rays in a stellar wind with – (e.g. Cassinelli et al. 1994). However, the strong variability of almost a factor of 4 between the EPIC and HRI observations is not expected from early-type X-ray sources (Berghöfer et al. 1997), so we hypothesise that it is more likely that the X-ray emission arises from an as-yet-undiscovered late-type companion that flared during the HRI observation.
6 Coronal activity at 30 Myr
The main focus of this paper is to gather information on the X-ray coronae of PMS stars at Myr and put them in context with what we know about X-ray activity in younger star forming regions, like the ONC and older, well-studied clusters such as the Pleiades (age Myr) and Hyades (age Myr). We can then ask whether the X-ray activity of such stars conforms to our expectations based on the age-rotation-activity paradigm (ARAP). Or, are other factors besides the changing stellar structure and decreasing rotation rate important, such as the apparent suppression of X-ray activity by accretion in the ONC?
Thanks to the relative insensitivity of estimated coronal fluxes to assumptions about the temperature structure of the coronae, we can split our discussion into a consideration of the evolution of the overall coronal energy losses followed by the evolution of coronal temperatures and variability.
6.1 The Evolution of X-ray activity
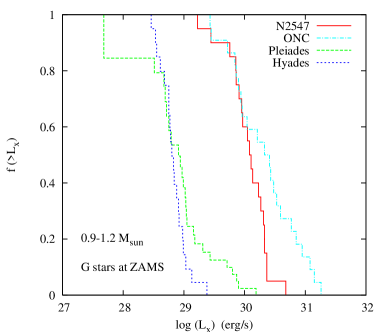
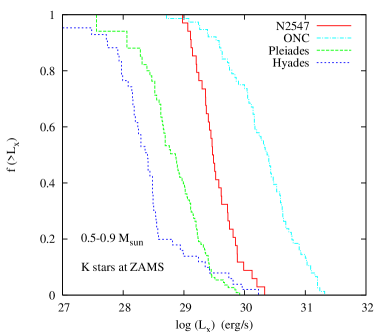
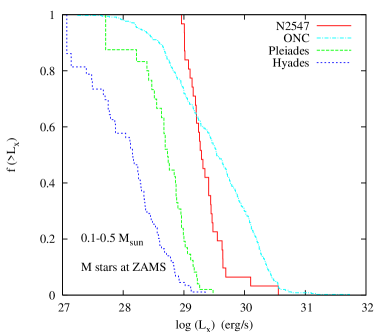
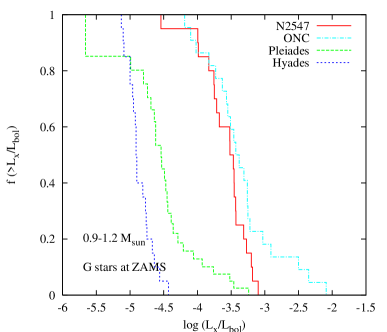
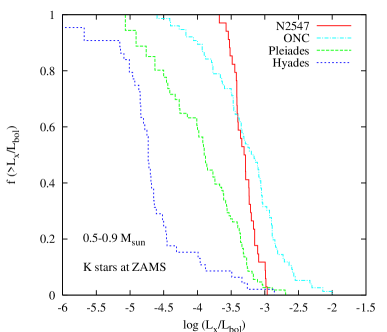
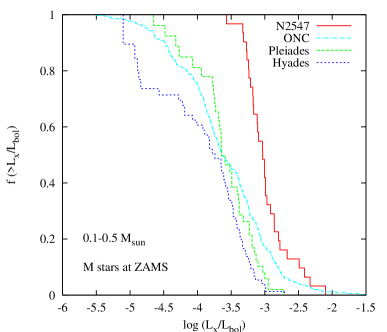
Figure 12 shows the cumulative X-ray luminosity functions (XLFs) for NGC 2547 and the equivalent functions for . Comparison plots are shown for the ONC, Pleiades and Hyades. These latter samples were obtained from the works of Stelzer & Neuhäuser (2001) and Preibisch & Feigelson (2005). To provide a fair comparison, all the X-ray fluxes have been adjusted to correspond to the 0.5–8.0 keV band considered by Preibisch & Feigelson (2005). This has been achieved by subtracting 0.14 dex from the 0.1–2.4 keV Pleiades and Hyades fluxes (see Preibisch & Feigelson) and by subtracting 0.04 dex from the NGC 2547 0.3–3.0 keV fluxes (see section 4.1).
The Pleiades and Hyades XLFs account for X-ray flux upper limits in non-detected cluster members using “survival analysis” techniques. No account of upper limits is taken for the ONC and NGC 2547 data. In the ONC essentially all cluster members were detected at X-ray wavelengths (see Getman et al. 2005). This is also true for NGC 2547 members in certain mass or colour ranges, but not in others (see section 4.2). It is not easy to take account of upper limits to the X-ray fluxes of undetected NGC 2547 members because, outside of photometric candidacy, there is no list of confirmed cluster members. Hence the inclusion of X-ray upper limits for photometric candidates which turn out to be non-members could bias the results in a way that is very difficult to assess. Instead we deal with the XLF of detected photometric candidates, accepting that where the X-ray census is incomplete then the XLF will be overestimated.
X-ray emission is known to be mass-dependent, or at least to depend on the structural properties of a star – which are both mass and age dependent. Fig. 12 provides XLFs for three different mass subsets. These are not the same as spectral type subsets because the ONC stars are sufficently young that most stars are on their Hayashi tracks and significantly cooler than they will appear when they reach the ZAMS. The mass estimates for the ONC sample are discussed by Getman et al. (2005). For NGC 2547 we use a relationship between and mass from the isochrone adopted in Fig. 2 to to make similar mass-range selections; that corresponds to ; that corresponds to ; and that corresponds to . In section 4.2 arguments were presented to suggest that the former two samples are likely to be complete for NGC 2547 and suffer little contamination. The lower-mass sample is likely to be very incomplete for NGC 2547. There are no X-ray detections with and a significant number of X-ray undetected candidates with . The simple G, K, M spectral type divisions for the XLFs of the Pleiades and Hyades used by Stelzer & Neuhäuser are assumed to correspond approximately with the three mass ranges defined for NGC 2547.
6.1.1 G stars at the ZAMS
The XLFs of stars that are or will become G-stars at the ZAMS show large changes with time. These changes could be caused by decreases in the convective turnover time () and decreases in the rotation period, but may also be connected with the disappearance of circumstellar material. For a star, Gilliland (1986) shows that decreases by a factor of 10 between 1 and 30 Myr, but hardly changes thereafter. The same evolutionary models also show the total moment of inertia of the star decreasing by a factor of 10 between 1 and 30 Myr and staying constant thereafter. Without angular momentum loss (AML) the rotation periods would decrease with the moment of inertia and little change in the Rossby number would be expected. The other major structural change is of course the development of a radiative core which takes place after a few Myr. Looking at the upper panels of Fig. 12 we see that whilst the upper levels of X-ray luminosity and are higher in the ONC than NGC 2547, the median and minimum levels are very close. This is an important result – indicating that the high level of X-ray irradiation seen in the vicinity of the young ONC stars is maintained for at least Myr prior to a quite significant decrease by the age of the Pleiades.
In terms of the ARAP we might conclude that there was very little AML between 1 and 30 Myr so that stars in NGC 2547 and the ONC had similar Rossby numbers. However, we know that this is not true as rotational velocities have been measured for reasonable samples of solar-type stars in both clusters. The Rossby numbers in the ONC are significantly smaller (see Fig. 9). It is still an unsolved puzzle as to how this angular momentum is lost but probably involves interactions between circumstellar material and the coronal magnetic fields as well as losses through a magnetised stellar wind. X-ray activity levels are maintained at high levels in NGC 2547 because many (but not all) stars have not yet slowed sufficiently to place them on the declining portion of the relationship between activity and Rossby number in Fig. 9. On the other hand, the range of activity levels in the ONC is too large to be explained by the ARAP. This is discussed at length by Stassun et al. (2004) and Preibisch et al. (2005) who conclude that stars without active accretion have saturated or super-saturated X-ray activity that is equivalent to fast-rotating ZAMS stars, but that active accretors often have significantly suppressed X-ray activity. Active accretion is not found in the NGC 2547 stars and the spread in X-ray activity is much smaller and quite consistent with the spread in rotation rates and a small amount (less than a factor of two – see section 5.2) of variability.
Between NGC 2547 and the Pleiades there is an order of magnitude decline in the median X-ray activity, a similar and perhaps even larger decline in the minimum activity levels, but comparatively little decline in the peak levels of X-ray activity. In terms of the ARAP, this can be understood if the fastest rotating G-stars in the Pleiades have yet to spin down sufficiently that their X-ray activity falls below the saturation level. Queloz et al. (1998) find that about 14 per cent of 0.9–1.1 Pleiads have equatorial velocities exceeding km s-1 and hence Rossby numbers which lead to saturated X-ray activity. Conversely, to explain their much lower X-ray activity, the slowest rotators in the Pleiades must rotate at rates that are factors of lower than the slowest rotators in NGC 2547. This tallies with the available observations. From the projected equatorial velocity measurements in Jeffries et al. (2000) we see that only 4 out of 20 G-type NGC 2547 members have km s-1, whereas that fraction is about 50 per cent in the Pleiades, with the slowest 10 per cent having rotational velocities similar to those in the even older Hyades (Queloz et al. 1998). Hence the solar-type stars undergo a period of rapid spindown during the first 100 Myr on the ZAMS, followed by a much longer “plateau” phase. This behaviour can plausibly be explained if the convective envelope and radiative core are rotationally coupled on a timescale somewhere between the age of the Pleiades and Hyades (Sills, Pinsonneault & Terndrup 2000).
6.1.2 K stars at the ZAMS
The situation is somewhat different in the lower mass stars. Here, the structural evolution means that whilst decreases by a factor of 2–6 for 0.5–0.9 stars between 1 and 30 Myr, there is a corresponding decrease in the moment of inertia by factors of 6–8 for the whole star. In the absence of AML we might expect the Rossby number to decrease by factors of 1.3–3. Beyond 30 Myr there is little evolution of either or moment of inertia, so the Rossby number would remain nearly constant in the absence of AML (see Gilliland 1986). The K-stars in the NGC 2547 sample will have developed a radiative core during the last Myr.
The most notable property of the NGC 2547 XLF for K-stars is the very narrow spread in and . In terms of the ARAP this is not explained by a narrow spread in rotational rates, but instead by the majority of objects rotating fast enough to lie on the saturated, or even super-saturated portions of the relationship between X-ray activity and Rossby number. It is therefore startling to see that a significant fraction ( per cent) of ONC stars in this mass range have lower values than even the least active NGC 2547 members, although they do still have higher values of . There is no explanation of this in terms of the ARAP unless the K-stars of NGC 2547 have an angular momentum distribution that is skewed to higher values compared with the ONC. But even if that were true, there are clear examples of ONC objects with very small Rossby numbers that have or even lower. Again, it is accreting objects in the ONC that tend to have these lower levels of . If anything, the bolometric luminosities derived by Getman et al. (2005) for these stars may be underestimates, making the result more significant (see discussion in Hillenbrand 1997).
Between NGC 2547 and the Pleiades there is an order of magnitude decrease in the minimum and median levels of X-ray activity, but comparable levels of maximum X-ray activity. Again, this can be interpreted in terms of the rotation distributions in the two clusters. A fraction ( per cent) of K-type Pleiades have equatorial velocities exceeding 15 km s-1 that would result in saturated levels of coronal emission. Almost half have spun down to less than 7.5 km s-1 (Queloz et al. 1998). Unfortunately only three measurements exist for NGC 2547 stars in the same mass range (13.4, 9.3 and 19.2 km s-1), so we cannot test this hypothesis in detail. On the basis of the NGC 2547 XLF we predict that NGC 2547 members with masses of 0.5–0.9 all have Rossby numbers less than 0.3 and equatorial velocities in excess of 10 km s-1.
6.1.3 M stars at the ZAMS
The lowest mass stars we have considered have a much slower evolutionary timescale on the PMS. Hence changes in and moment of inertia are expected both before and after the age of NGC 2547. In the absence of AML there should be a decrease in the Rossby number by factors of a few between 1 and 30 Myr, but only small changes after that (Gilliland 1986). A notable difference between this subsample and the higher mass stars considered previously is that many of the NGC 2547 stars may still be fully convective. In the D’Antona & Mazzitelli (1997) models, this transition takes place at 0.4 at 30 Myr, corresponding to . There is no great change apparent in Figs 6 and 7 at this colour, except perhaps for the development of a small tail of high activity objects.
Unlike the higher mass subsamples, the X-ray census of M stars in NGC 2547 is definitely not complete and so the XLFs will be biased upwards. There are no detections of any NGC 2547 stars with , although confirmed cluster members (see Jeffries & Oliveira 2005) are certainly within the XMM-Newton field of view. All we can say is that the majority of NGC 2547 M stars are expected to exhibit saturated or even super-saturated levels of X-ray emission and this is consistent with the observed XLFs. The peak levels of X-ray luminosity and activity are close to those in the ONC and several times higher than in the Pleiades and Hyades. It is hard to be sure that this is a significant difference though, because approaching the flux sensitivity limit of the survey one is bound to upwardly bias the fluxes of the detected objects simply through fluctuations in the background and the intrinsic X-ray variability of the stars. It would be fascinating to do a deeper survey in order to establish whether NGC 2547 (like the ONC 0.1–1.2 stars) exhibits a significant fraction of objects with and objects with . The confirmed existence of either of these two populations might lend support to the suggestion that young, fully convective stars might not conform to the ARAP possibly through the operation of a dynamo that is distributed throughout the convective interior rather than at the interface between the radiative core and convective envelope (Feigelson et al. 2003).
6.2 The evolution of coronal temperatures
In section 4.3 we showed that average coronal temperatures, indicated by crude hardness ratios, increased with , and , although there was considerable scatter in these relationships. As these activity indicators decline with time (also with considerable scatter) an interesting question is whether coronal temperatures, and by implication coronal structures and heating mechanisms, change solely with coronal activity, or whether there is some other time-dependent variable involved. It has been known for some time that this is the case for older stars, with average coronal temperatures decreasing among solar type stars between ages of Myr and 9 Gyr. This evolution appears to be largely governed by the gradual disappearance of the hotter ( MK) coronal plasma (e.g. Güdel, Guinan & Skinner 1997; Telleschi et al. 2005). Telleschi et al. (2005) propose a relationship of the form between coronal luminosity and mean coronal temperature,
This dependence of coronal temperature on activity and age apparently continues to younger ages. Whilst the most active field stars studied by Güdel et al. (1997) have a coronal temperature of about 10 MK, detailed X-ray spectroscopy of T-Tauri stars (both accreting and non-accreting) finds that their coronae are dominated by a very hot component ( MK) that is seen only in the largest flares in the solar corona (Skinner & Walter 1998; Grosso et al. 2004). What is not clear is whether these hotter coronae are merely an extension of the trend defined by older stars, which is presumably driven by changes in rotation rate, or whether the significant increase in coronal temperatures is attributable to differences in the stellar structure or the presence of discs in PMS stars.
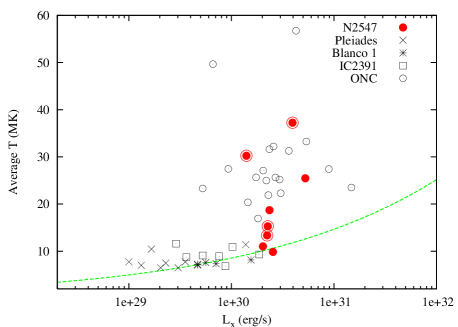
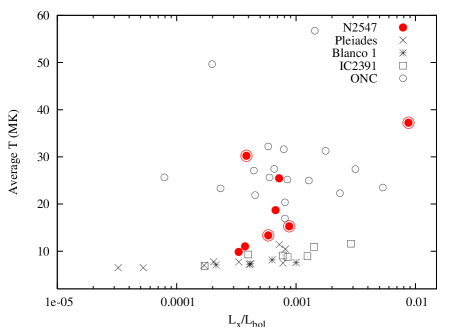
Figure 13 illustrates where the stars of NGC 2547, at an age of Myr, fit into this progression. The emission measure weighted mean coronal temperature is shown as a function of and for the 8 stars in Table 5 with and which are unambiguously low-mass stars. The dashed line indicates the relationship derived for 0.07–9 Gyr G-type stars in the field, that have erg s-1 (Telleschi et al. 2005). Comparable data were gathered from the literature for low-mass stars in IC 2391 (age 50 Myr, Marino et al. 2005), Blanco 1 (age Myr, Pillitteri et al. 2004) and the Pleiades (age 120 Myr, Briggs & Pye 2003). These comparison samples were chosen on the basis that the spectra were also obtained with the XMM-Newton EPIC instrument and modelled with two thermal components with abundance as a free parameter. Finally, data were added for a sample young PMS stars in the ONC (Getman et al. 2005). These spectra were obtained with the Chandra ACIS instrument, but modelled in a similar manner to the NGC 2547 stars. Objects were selected that had , that had X-ray sepectra which were modelled with two thermal components and for which no problems were reported in the spectral fits (see Getman et al. for details).
It appears that the PMS stars of the ONC have coronae that are much hotter than a simple extension of the trend defined by older stars with lower . This becomes even more apparent when considering mean coronal temperature versus , where the higher coronal temperatures of the ONC appear to be a consequence of youth rather than a higher overall level of magnetic activity. The ONC stars are photospherically cooler than the young cluster samples because of their younger evolutionary stage and therefore using X-ray surface flux () as an activity indicator would yield an even worse correlation.
The stars of NGC 2547 form an intermediate population. They lie significantly above the mean relationship defined by the field G-stars. Of course there is a bias towards the most active stars in NGC 2547, and the objects with the highest mean temperatures (stars 5 and 12) were seen to flare during the observation, but this is also the case in the comparison stars in the other clusters. When compared at a given activity level (defined by ) the NGC 2547 stars lie between the older clusters and the ONC. We emphasize that the Blanco 1, Pleiades and IC 2391 samples were analysed with the same instrument and in an entirely consistent manner with our approach. We also checked whether our assumed hydrogen column density of cm-2 could influence this result. Doubling the column density (see section 3.1) reduces the mean coronal temperature in our NGC 2547 sample by only per cent – insufficient to account for the observed differences.
“Activity”, either judged by , or , is not capable of predicting what the average coronal temperature will be, so it is difficult to attribute a causal effect to these quantities. Instead there must be an additional age-related factor which should be taken into account. It is unlikely that this factor has anything to do with active accretion or the presence of circumstellar material. We can confidently rule these out in the case of NGC 2547 and of 19 objects included in the ONC sample only 4 are classical T-Tauri stars and about half show evidence of a near-IR excess, but these do not appear to have systematically higher temperatures. This leaves changes in the interior structure of the PMS stars, the absolute rotation rate or perhaps the surface gravity as the most likely causative effects of the higher coronal temperatures.
One possibility is that the higher coronal temperatures in the younger stars are a manifestation of a more turbulent dynamo distributed throughout the entirely convective interior of the young ONC stars (e.g. see the discussion in Feigelson et al. 2003 and references therein). This could lead to differing coronal structures and higher temperatures, perhaps as a result of a less ordered magnetic field and more frequent flaring interactions on a variety of scales. Intermediate coronal temperatures in the older NGC 2547 stars may be due to the beginning of strong magnetic braking, differential rotation between the developing radiative core and envelope and hence the presence of a tachocline region, and initiation of an dynamo (e.g. Parker 1993). The influence of a distributed convective dynamo that depends on a deep convection zone would diminish.
There are (at least) two problems with these ideas: First, there is no clear evidence that large flares are more common in ONC stars than the most active stars in NGC 2547 or indeed older ZAMS cluster (see section 6.3.1). Second, if being young and fully convective is the recipe for hotter coronal temperatures then MK coronae should be present in all stars with () in NGC 2547. Although we have no detailed spectra with which to test this, the hardness ratios are reasonably indicative. Simulating a 2 keV thermal plasma with a similar column density and abundance to the other NGC 2547 stars yields a pn hardness ratio of 0.00. There is a hint that coronae get hotter for , but hardness ratios are comfortably below zero for stars of any spectral type (see Fig. 5). Of course this analysis neglects any cool coronal component and it is true that there are a few fully convective stars with hardness ratios as large as the hottest stars with detailed spectral fits. More detailed spectral modelling of better data is required.
An alternative explanation for hotter coronae in PMS stars arises from simple scaling laws (see also Jordan & Montesinos 1991). Suppose that the coronal plasma and magnetic field approach pressure equilibrium, such that , where is the coronal pressure and the coronal magnetic field. We could further assume that X-ray emission is observed from magnetic loops that extend to some fraction of a pressure scale height, so that , where is the loop semi-length and the surface gravity. The final ingredient is the scaling law between loop length, pressure and temperature derived for hydrostatic loops by Rosner, Tucker & Vaiana (1978), who show that . Combining these we find
| (1) |
For large (unsaturated) Rossby numbers, mean field dynamo theory suggests that should increase with decreasing Rossby number (Durney & Robinson 1982), but for small (saturated) Rossby numbers it is quite possible that feedback effects limit any further growth in or magnetic activity. Hence at large Rossby numbers and for stars that have already reached the main sequence with similar gravities, coronal temperature will chiefly depend on Rossby number and hence rotation (or or for a given spectral type) – as observed in older G dwarfs (Telleschi et al. 2005). For small Rossby numbers and saturated coronae the dependence should be dominated by gravity variations. The models of D’Antona & Mazzitelli (1997) suggest that the surface gravity of a 0.8 star changes from to (in cgs units) between 1 and 30 Myr, with only a small further decrease thereafter. Accordingly, equation 1 predicts that stars in the saturated regime will exhibit a corresponding drop in coronal temperature of a factor 2.3 between 1 and 30 Myr – approximately what is seen. A probable complicating factor is that the scale heights in the ONC stars will be large enough for centrifugal forces to play a role. Indeed, Jardine & Unruh (1999) have shown that coronal loops extending beyond the Keplerian co-rotation radius would be unstable and the simple pressure scale height equals the co-rotation radius at MK for a star with and rotation period of 5 days.
If coronal temperature just scales with gravity as described above then this is readily testable by determining the relative coronal heights ONC and ZAMS stars. The lower gravity ONC coronae should be approximately 10 times more extended ( is 2.5 times hotter and is 4 times smaller) than in active ZAMS stars444Note this is in absolute units, not relative to the stellar radius.. In practice, there is little strong evidence for this. Whilst the coronae of ZAMS stars have usually been found to be consistent with an extent of a pressure scale height (or less) from eclipse mapping or combinations of emission measure and density estimates (see Güdel 2004 for a review), the same diagnostics are not yet available for PMS stars. Perhaps the only technique applied to both classes of objects is the modelling of strong X-ray flares with loop models. Favata et al. (2005) have used the analysis of strong flares to determine loop half lengths of – m in several ONC stars. Equivalent analyses of strong flares on very active ZAMS stars do imply significantly smaller loop lengths ( m – Güdel et al. 2001; Scelsi et al. 2005) with an extent of about a pressure scale height. It must be emphasised though that these approaches to interpreting spatially unresolved flares are highly model dependent.
6.3 The evolution of coronal variability
6.3.1 Flaring
In principle we could attempt to compare the “flare rate” in NGC 2547 stars with objects of similar mass in older and younger clusters. In practice this turns out to be difficult because there is little uniformity in the literature about how a flare should be defined and numerous selection effects concerning the detection of flaring events that are difficult to account for. In particular, care must be taken in comparing data with differing sensitivities (for instance from clusters at different distances) or from instruments with different energy band-passes.
In section 5.1 and Table 6 a number of possible flaring events were identified. Although we have identified one major flare on an M-star in NGC 2547, the majority of such sources are so weak in our data that a proper assessment of the flaring frequency in M-stars is impossible. The situation is better for solar-type stars, where we would claim to have been able to detect all flares with integrated energies exceeding erg, provided that they had total durations ks. We have detected 4 such flares and 2 others that fall just outside these thresholds from a sample of 28 solar-type stars with masses . Each source was monitored for approximately 50 ks, with no gaps large enough for us to have missed any significant flaring. Hence the flare rate (for flares with total energy erg and duration ks) is approximately 1 every ks.
Equivalent statistics are presented or can be calculated from a few sources in the literature for older and younger stars. Gagné et al. (1995a) used ROSAT observations of the Pleiades to find 12 flares with peak of – erg s-1. We estimate that they observed 3 flares from G-stars with energies in excess of erg (making a small approximate correction for the differences in band-passes) from an effective monitoring time of 60 ks on 33 G-stars. Hence the comparable flaring statistic to our NGC 2547 measurement is 1 flare every 660 ks. Wolk et al. (2005) have presented a detailed search for flares in ONC stars with using the Chandra COUP dataset. They conclude that the equivalent flare rate statistic is 1 flare every 650 ks. In terms of duration and peak luminosity, the flares in NGC 2547 are quite comparable with the large flares seen in the ONC and Pleiades. Larger flares ( erg) are seen occasionally in the ONC, but they are reasonably rare and it is not necessarily significant that none were observed in the solar-type stars of NGC 2547.
Hence there appears to be little or no change in the rate of occurrence of large flares in solar-type stars during their first Myr. If anything the flare rate seems larger in NGC 2547 than the ONC, but the reader should note that 2 of the 4 flares in NGC 2547, those in stars 10 and 15, may not have been classified as flares in the ONC study of Wolk et al. (2005), because their peak luminosities were less than three times their quiescent luminosity. On the other hand, some of the ONC flares were so long ( ks) that such variability may not have been classed as a flare in this paper. A longer observation of NGC 2547 is required for a more reliable comparison.
A similar flare rate in NGC 2547, the ONC and the Pleiades seems at odds with explanations of the enhanced coronal temperatures in very young PMS stars which rely on enhanced flaring rates. On the other hand, only the rate of occurrence of the very brightest flares have been measured here. It is still possible that the flare energy spectrum has a shallower slope in the ONC than NGC 2547 or the Pleiades, resulting in coronal heating by more numerous smaller flares.
6.3.2 Long term variations
Comparisons of long term variability as a function of age needs to be restricted to those studies which (i) define variabilty in terms of an amplitude, rather than stating that some fraction of stars are “variable” which will just be an increasing function of the sensitivity of the observations; (ii) consider upper limits where necessary and do not restrict themselves to stars detected in all observations and (iii) adequately account for systematic differences in the estimated luminosities from different instruments. Several papers have been found that fulfil these criteria.
In section 5.2 it was established that only 10–15 per cent of G/K stars or stars with erg s-1 in NGC 2547 show variations of a factor on timescales of 7 years. Similarly, Simon & Patten (1998) find only 2/28 members of IC 2391 (age Myr) have X-ray luminosities that vary by more than a factor of two on a 2 year timescale.
In older clusters Gagné et al. (1995a) and Micela et al. (1996) found that per cent of low-mass Pleiads (age Myr) showed variations of a factor two or more on timescales of 1-2 years and perhaps 40 per cent on timescales of 11 years. Pillitteri et al. (2005) found that at least 8/22 G- and K-type stars in Blanco 1 (age Myr) varied by just over a factor of two on a 6 year timescale. Marino et al. (2003) showed that older (but still relatively X-ray active) solar-type (F7-K2) field stars were even more variable than their counterparts in the Pleiades. Micela & Marino (2003) have shown that the Sun would exhibit variations by factors of if observed in a similar manner over the course of its magnetic activity cycle. Favata et al. (2004) have presented the first compelling evidence for solar-like X-ray variations in an old field G2 star, where varied by a factor of 10 in 2.5 years.
Detailed studies of the long-term variability of younger stars are scarce. There are some indications that X-ray variability may be much more common in young PMS stars. Gagné, Caillault & Stauffer (1995b) claim that at least 25 per cent of X-ray luminous late-type ONC stars vary by more than a factor of two on timescales of 1 year. Preibisch et al. (2005) quote a median absolute deviation from equal luminosities of 0.31 dex between their Chandra observations of ONC stars and another long Chandra dataset taken 3 years earlier. This is much higher than the equivalent variability of 0.1 dex reported here for NGC 2547, suggesting that variations of a factor of 2 are common in very young PMS stars.
In summary the long term X-ray variability presents a confused picture. Very young PMS stars may be very variable, but clusters at the age of NGC 2547 show very little long term variability on timescales of 7 Myr and so certainly nothing like a solar magnetic activity cycle with a period less than about 20 years. Any variability which exists may be entirely attributable to large flares which can significantly alter the average X-ray luminosity seen in relatively short ( day) observations. The amount of long-term variability then appears to increase for older clusters, but it is not clear whether this marks the development of activity cycles or whether it is due to the maintenance of a reasonably high rate of large flares contrasting with rapidly decreasing “quiescent” X-ray luminosity with age (see Fig. 12).
7 Summary
With a reasonably long and sensitive XMM-Newton observation of NGC 2547 we have been able to go some way towards characterising the X-ray emission from analogues of the Sun (and at lower masses) at ages of Myr. The main findings of this study can be summarised as follows:
-
1.
Candidate cluster counterparts have been found for 108 X-ray sources. X-ray emission is seen from stars of all spectral types. X-ray luminosities peak among the G-stars at erg s-1 declining to erg s-1 among M stars with masses as low as . The ratio of X-ray to bolometric luminosity increases rapidly with decreasing among F-type stars, reaching a saturated peak of for G stars and cooler.
-
2.
Optically thin thermal plasma models have been used to fit the X-ray spectra of the most active stars in NGC 2547. Where there were sufficient detected X-ray photons, a multi-temperature model fares better than a single temperature model. Coronal metal abundances are clearly sub-solar. There are reasonable correlations between increasing coronal temperature, indicated by a hardness ratio, and X-ray luminosity, surface flux or . However, none of these relations is entirely deterministic, with a significant scatter in hardness ratio at any activity level.
-
3.
The relationship between X-ray activity and Rossby number among the G- and K-type stars of NGC 2547 follows that established in a number of older clusters and field stars. The majority of the solar-type stars in NGC 2547 have saturated or even super-saturated levels of coronal activity that are commensurate with their rotation rates. Based on their saturated activity levels, we predict that none of the K stars in NGC 2547 have spun down below equatorial velocities of 10 km s-1.
-
4.
The X-ray luminosity functions (XLFs) of NGC 2547 have been compared with younger and older stars in several mass ranges. For G- and K-type stars the median activity levels in NGC 2547, indicated by , are very similar to stars of equivalent mass in the Orion Nebula cluster (ONC), but nearly an order of magnitude higher than in the Pleiades at Myr. The X-ray luminosities of G-type stars in NGC 2547 are only marginally lower than their counterparts in the ONC. The spreads in the XLFs of NGC 2547 are much smaller than in older clusters and the ONC. These phenomena are readily interpreted in terms of a magnetic dynamo and the age-rotation-activity paradigm, providing account is taken of the evolution of convection zone parameters and angular momentum loss using Rossby numbers. The reported low activity levels of some very young accreting PMS stars in the ONC do not straightforwardly fit into this scenario.
-
5.
Coronal temperatures in the most active solar-type stars in NGC 2547 are intermediate between those of older clusters and the very young ONC stars. We show that correlations proposed between coronal temperature and X-ray activity for field stars do not predict the temperatures in NGC 2547 or the much higher temperatures in the ONC. Simple scaling law arguments predict that coronal temperatures should increase as surface gravity decreases for stars with saturated levels of magnetic activity. These arguments require that the scale heights of coronae in the ONC stars are an order of magnitude larger than in ZAMS stars. Alternative explanations such as enhanced flaring or different modes of dynamo action in younger, fully convective PMS stars are possible, but there is no clear evidence for very hot coronae in the fully convective stars of NGC 2547 and the flaring rate (at least for strong flares) is comparable in the solar-type stars of the ONC, NGC 2547 and the Pleiades (see below). However, the hottest coronal temperatures in our sample do arise from clear flaring behaviour.
-
6.
A number of candidate flares were detected among the low-mass stars of NGC 2547, with peak luminosities (0.3–3.0 keV) exceeding erg s-1 and integrated flare energies of – erg. The occurrence rate for flares with energy erg is approximately 1 every ks and comparable to flare frequencies in the ONC and Pleiades.
-
7.
By comparison with earlier ROSAT HRI observations we find that only 10–15 per cent of G- and K-type stars, or stars of any spectral types with erg s-1, show variations of a factor of two or more on timescales of 7 years. The level of long term variability is incompatible with solar-like magnetic activity cycles with periods of 20 years or less. This is comparable with variability seen in similarly aged clusters (IC 2391) but less than observed in older clusters and field stars and in the younger PMS stars of the ONC.
Acknowledgments
This work is based on observations obtained by XMM-Newton, an ESA science mission with instruments and contributions directly funded by ESA member states and the USA (NASA). We would like to thank Dr. T. Preibisch for supplying electronic tables containing the X-ray luminosity functions of the Orion nebula cluster. We thank an anonymous referee for helping us clarify the paper in a number of places.
References
- [\citeauthoryearAnders & GrevesseAnders & Grevesse1989] Anders E., Grevesse N., 1989, Geochimica et Cosmochimica Acta, 53, 197
- [\citeauthoryearAudard, Telleschi, Gudel, Skinner, Pallavicini & Mitra-KraevAudard et al.2004] Audard M., Telleschi A., Gudel M., Skinner S. L., Pallavicini R., Mitra-Kraev U., 2004, ApJ, 617, 531
- [\citeauthoryearBaraffe, Chabrier, Allard & HauschildtBaraffe et al.2002] Baraffe I., Chabrier G., Allard F., Hauschildt P. H., 2002, A&A, 382, 563
- [\citeauthoryearBerghofer, Schmitt, Danner & CassinelliBerghofer et al.1997] Berghofer T. W., Schmitt J. H. M. M., Danner R., Cassinelli J. P., 1997, A&A, 322, 167
- [\citeauthoryearBriggs & PyeBriggs & Pye2003] Briggs K., Pye J. P., 2003, MNRAS, 345, 714
- [\citeauthoryearCampana, Lazzati, Panzera & TagliaferriCampana et al.1999] Campana S., Lazzati D., Panzera M. R., Tagliaferri G., 1999, A&A, 524, 423
- [\citeauthoryearCassinelli, Cohen, Macfarlane, Sanders & WelshCassinelli et al.1994] Cassinelli J. P., Cohen D. H., Macfarlane J. J., Sanders W. T., Welsh B. Y., 1994, ApJ, 421, 705
- [\citeauthoryearClariáClariá1982] Clariá J. J., 1982, A&AS, 47, 323
- [\citeauthoryearCutri, R. M. et al.Cutri, R. M. et al.2003] Cutri, R. M. et al. 2003, Technical report, Explanatory supplement to the 2MASS All Sky data release. http://www.ipac.caltech.edu/2mass/
- [\citeauthoryearD’Antona & MazzitelliD’Antona & Mazzitelli1997] D’Antona F., Mazzitelli I., 1997, Mem. Soc. Astr. It., 68, 807
- [\citeauthoryearDavid, Harnden, Kearns, Zombeck, Harries, Mossman, Prestwich, Primini, Silverman & SnowdenDavid et al.1999] David L. P., Harnden F. R. J., Kearns K. R., Zombeck M. V., Harries D. E., Mossman A. E., Prestwich A., Primini F. A., Silverman J. D., Snowden S. L., 1999, Technical report, The ROSAT High Resolution Imager Calibration Report. U.S. ROSAT Science Data Center/SAO
- [\citeauthoryearDurney & RobinsonDurney & Robinson1982] Durney B. R., Robinson R. D., 1982, ApJ, 253, 290
- [\citeauthoryearFavata, Flaccomio, Reale, Micela, Sciortino, Shang, Stassun & FeigelsonFavata et al.2005] Favata F., Flaccomio E., Reale F., Micela G., Sciortino S., Shang H., Stassun K. G., Feigelson E. D., 2005, ApJS, 160, 469
- [\citeauthoryearFavata, Micela, Baliunas, Schmitt, Gudel, Harnden, Sciortino & SternFavata et al.2004] Favata F., Micela G., Baliunas S. L., Schmitt J. H. M. M., Gudel M., Harnden F. R. J., Sciortino S., Stern R. A., 2004, A&A, 418, L13
- [\citeauthoryearFeigelson, Gaffney, Garmire, Hillenbrand & TownsleyFeigelson et al.2003] Feigelson E. D., Gaffney J. A., Garmire G., Hillenbrand L. A., Townsley L., 2003, ApJ, 584, 911
- [\citeauthoryearFlaccomio, Damiani, Micela, Sciortino, Harnden, Murray & WolkFlaccomio et al.2003] Flaccomio E., Damiani F., Micela G., Sciortino S., Harnden F. R. J., Murray S. S., Wolk S. J., 2003, ApJ, 582, 398
- [\citeauthoryearFlaccomio, Micela & SciortinoFlaccomio et al.2003] Flaccomio E., Micela G., Sciortino S., 2003, A&A, 402, 477
- [\citeauthoryearGagné, Caillault & StaufferGagné et al.1995] Gagné M., Caillault J. P., Stauffer J. R., 1995, ApJ, 450, 217
- [\citeauthoryearGagné, Caillault & StaufferGagné et al.1995] Gagné M., Caillault J. P., Stauffer J. R., 1995, ApJ, 445, 280
- [\citeauthoryearGetman, A, A, A, A, A, A, A, A, A, A, A, A, A, A, A & AGetman et al.2005] Getman K., A B., A B., A B., A B., A B., A B., A B., A B., A B., A B., A B., A B., A B., A B., A B., A B., 2005, ApJS, 160, 319
- [\citeauthoryearGillilandGilliland1986] Gilliland R. L., 1986, ApJ, 300, 339
- [\citeauthoryearGrosso, Montmerle, Feigelson & ForbesGrosso et al.2004] Grosso N., Montmerle T., Feigelson E. D., Forbes T. G., 2004, 419, p. 653
- [\citeauthoryearGudelGudel2004] Gudel M., 2004, ARA&A, 12, 71
- [\citeauthoryearGudel, Audard, Briggs, Haberl, Magee, Maggio, Mewe, Pallavicini & PyeGudel et al.2001] Gudel M., Audard M., Briggs K., Haberl F., Magee H., Maggio A., Mewe R., Pallavicini R., Pye J., 2001, A&A, 365, L336
- [\citeauthoryearGudel, Guinan & SkinnerGudel et al.1997] Gudel M., Guinan E. F., Skinner S. L., 1997, ApJ, 483, 947
- [\citeauthoryearHillenbrandHillenbrand1997] Hillenbrand L. A., 1997, AJ, 113, 1733
- [\citeauthoryearJardine & UnruhJardine & Unruh1999] Jardine M., Unruh Y. C., 1999, A&A, 346, 883
- [\citeauthoryearJeffriesJeffries1999] Jeffries R. D., 1999, in Butler C. J., Doyle J. G., eds, Solar and stellar activity: similarities and differences: ASP Conference series Vol.158 ASP, San Francisco, p. 75
- [\citeauthoryearJeffries, Naylor, Devey & TottenJeffries et al.2004] Jeffries R. D., Naylor T., Devey C. R., Totten E. J., 2004, MNRAS, 351, 1401
- [\citeauthoryearJeffries & OliveiraJeffries & Oliveira2005] Jeffries R. D., Oliveira J. M., 2005, MNRAS, 358, 13
- [\citeauthoryearJeffries, Thurston & PyeJeffries et al.1997] Jeffries R. D., Thurston M. R., Pye J. P., 1997, MNRAS, 287, 350
- [\citeauthoryearJeffries & TolleyJeffries & Tolley1998] Jeffries R. D., Tolley A. J., 1998, MNRAS, 300, 331
- [\citeauthoryearJeffries, Totten & JamesJeffries et al.2000] Jeffries R. D., Totten E. J., James D. J., 2000, MNRAS, 316, 950
- [\citeauthoryearJordan & MontesinosJordan & Montesinos1991] Jordan C., Montesinos B., 1991, MNRAS, 252, 21P
- [\citeauthoryearKirschKirsch2005] Kirsch M., 2005, Technical Report XMM-SOC-CAL-TN-0018, EPIS status of calibration. XMM-Newton SOC
- [\citeauthoryearMarino, Micela, Peres, Pillitteri & SciortinoMarino et al.2005] Marino A., Micela G., Peres G., Pillitteri I., Sciortino S., 2005, A&A, 430, 287
- [\citeauthoryearMarino, Micela, Peres & SciortinoMarino et al.2003] Marino A., Micela G., Peres G., Sciortino S., 2003, A&A, 406, 629
- [\citeauthoryearMewe, Kaastra & LeidahlMewe et al.1995] Mewe R., Kaastra J. S., Leidahl D. A., 1995, Technical report, The HEASARC Journal, Legacy Volume 6. Goddard Space Flight Center
- [\citeauthoryearMicela & MarinoMicela & Marino2003] Micela G., Marino A., 2003, A&A, 404, 637
- [\citeauthoryearMicela, Sciortino, Kashyap, Harnden & RosnerMicela et al.1996] Micela G., Sciortino S., Kashyap V., Harnden F. R., Rosner R., 1996, ApJS, 102, 75
- [\citeauthoryearNaylor, Totten, Jeffries, Pozzo, Devey & ThompsonNaylor et al.2002] Naylor T., Totten E. J., Jeffries R. D., Pozzo M., Devey C. R., Thompson S. A., 2002, MNRAS, 335, 291
- [\citeauthoryearNoyes, Hartmann, Baliunas, Duncan & VaughanNoyes et al.1984] Noyes R. W., Hartmann L., Baliunas S. L., Duncan D. K., Vaughan A. H., 1984, ApJ, 279, 763
- [\citeauthoryearPanzera, Campana, Covino, Lazzati, Mignani, Moretti & TagliaferriPanzera et al.2003] Panzera M. R., Campana S., Covino S., Lazzati D., Mignani R. P., Moretti A., Tagliaferri G., 2003, A&A, 399, 351
- [\citeauthoryearPanzera, Tagliaferri, Pasinetti & AntonelloPanzera et al.1999] Panzera M. R., Tagliaferri G., Pasinetti L., Antonello E., 1999, A&A, 348, 161
- [\citeauthoryearParkerParker1993] Parker E., 1993, ApJ, 408, 707
- [\citeauthoryearPillitteri, Micela, Reale & SciortinoPillitteri et al.2005] Pillitteri I., Micela G., Reale F., Sciortino S., 2005, A&A, 430, 155
- [\citeauthoryearPillitteri, Micela, Sciortino, Damiani & HarndenPillitteri et al.2004] Pillitteri I., Micela G., Sciortino S., Damiani F., Harnden F. R. J., 2004, A&A, 421, 175
- [\citeauthoryearPizzolato, Maggio, Micela, Sciortino & VenturaPizzolato et al.2003] Pizzolato N., Maggio A., Micela G., Sciortino S., Ventura P., 2003, A&A, 397, 147
- [\citeauthoryearPreibisch & FeigelsonPreibisch & Feigelson2005] Preibisch T., Feigelson E. D., 2005, ApJS, 160, 390
- [\citeauthoryearPreibisch, Kim, Favata, Feigelson, Flaccomio, Getman, Micela, Sciortino, Stassun, Stelzer & ZinneckerPreibisch et al.2005] Preibisch T., Kim Y. C., Favata F., Feigelson E. D., Flaccomio E., Getman K., Micela G., Sciortino S., Stassun K., Stelzer B., Zinnecker H., 2005, ApJS, 160, 401
- [\citeauthoryearProsser, Randich, Stauffer, Schmitt & SimonProsser et al.1996] Prosser C. F., Randich S., Stauffer J. R., Schmitt J. H. M. M., Simon T., 1996, AJ, 112, 1570
- [\citeauthoryearQueloz, Allain, Mermilliod, Bouvier & MayorQueloz et al.1998] Queloz D., Allain S., Mermilliod J. C., Bouvier J., Mayor M., 1998, A&A, 335, 183
- [\citeauthoryearRandichRandich1998] Randich S., 1998, in Donahue R. A. amd Bookbinder J. A., ed., 10th Cambridge Workshop on Cool Stars, Stellar Systems and the Sun, ASP Conference Series, Vol 154 ASP, San Francisco, p. 501
- [\citeauthoryearRandichRandich2000] Randich S., 2000, in Pallavicini R., Micela G., Sciortino S., eds, Stellar Clusters and Associations: Convection, Rotation, and Dynamos: ASP Conference Series Vol. 198 ASP, San Francisco, p. 401
- [\citeauthoryearRosner, Tucker & VaianaRosner et al.1978] Rosner R., Tucker W. H., Vaiana G. S., 1978, ApJ, 220, 643
- [\citeauthoryearSaxtonSaxton2003] Saxton R. D., 2003, Technical Report XMM-SOC-CAL-TN-0023, A statistical evaluation of the EPIC flux calibration, Version 2.0. XMM-Newton SOC
- [\citeauthoryearScelsi, Maggio, Peres & PallaviciniScelsi et al.2005] Scelsi L., Maggio A., Peres G., Pallavicini R., 2005, A&A, 432, 671
- [\citeauthoryearSiess, Dufour & ForestiniSiess et al.2000] Siess L., Dufour E., Forestini M., 2000, A&A, 358, 593
- [\citeauthoryearSills, Pinsonneault & TerndrupSills et al.2000] Sills A., Pinsonneault M. H., Terndrup D. M., 2000, ApJ, 534, 335
- [\citeauthoryearSimon & PattenSimon & Patten1998] Simon T., Patten B. M., 1998, PASP, 110, 283
- [\citeauthoryearSkinner & WalterSkinner & Walter1998] Skinner S. L., Walter F. M., 1998, ApJ, 509, 761
- [\citeauthoryearStassun, Ardila, Barsony, Basri & MathieuStassun et al.2004] Stassun K., Ardila D. R., Barsony M., Basri G., Mathieu R. D., 2004, AJ, 127, 3537
- [\citeauthoryearStauffer, Caillault, Gagné, Prosser & HartmannStauffer et al.1994] Stauffer J. R., Caillault J. P., Gagné M., Prosser C. F., Hartmann L. W., 1994, ApJS, 91, 625
- [\citeauthoryearStelzer & NeuhauserStelzer & Neuhauser2001] Stelzer B., Neuhauser R., 2001, A&A, 377, 538
- [\citeauthoryearStelzer, Neuhauser & HambaryanStelzer et al.2000] Stelzer B., Neuhauser R., Hambaryan V., 2000, A&A, 356, 949
- [\citeauthoryearStern, Schmitt & KahabkaStern et al.1995] Stern R. A., Schmitt J. H. M. M., Kahabka P. T., 1995, ApJ, 448, 683
- [\citeauthoryearStruderStruder2001] Struder L. e. a., 2001, A&A, 365, L18
- [\citeauthoryearTelleschi, Gudel, Briggs, Audard, Ness & SkinnerTelleschi et al.2005] Telleschi A., Gudel M., Briggs K., Audard M., Ness J. U., Skinner S. L., 2005, ApJ, 622, 653
- [\citeauthoryearTurnerTurner2001] Turner M. J. L. e. a., 2001, A&A, 365, L27
- [\citeauthoryearWolk, Flaccomio, Micela, Favata, Glassgold, Shang & FeigelsonWolk et al.2005] Wolk S. J., Flaccomio E., Micela G., Favata F., Glassgold A. E., Shang H., Feigelson E., 2005, ApJS, 160, 423
- [\citeauthoryearYoung E. T. amd Lada, Teixeira, Muzerolle, Muench, Stauffer, Beichman, Rieke, Hines, Su, Engelbracht, Gordon, Misselt, Morrison, Stansberry & KellyYoung et al.2004] Young E. T. amd Lada C. J., Teixeira P., Muzerolle J., Muench A., Stauffer J., Beichman C. A., Rieke G. H., Hines D. C., Su K. Y. L., Engelbracht C. W., Gordon K. D., Misselt K., Morrison J., Stansberry J., Kelly D., 2004, ApJS, 154, 428