2European Astronomical Institute, Karl-Schwarzchild-Strasse 2 D-85748 Garching b. Munchen, Germany
3Department of Physics and Astronomy, University College London, Gower Street, London, WC1E 6BT
4SRON Laboratory for Space Research, Sorbonnelaan 2, NL-3584 CA Utrecht, The Netherlands
Observational evidence for a truncation of the star cluster initial mass function at the high mass end
We present the luminosity function (LF) of star clusters in M51 based on HST/ACS observations taken as part of the Hubble Heritage project. The clusters are selected based on their size and with the resulting 5 990 clusters we present one of the largest cluster samples of a single galaxy. We find that the LF can be approximated with a double power-law distribution with a break around . On the bright side the index of the power-law distribution is steeper () than on the faint-side (), similar to what was found earlier for the “Antennae” galaxies. The location of the bend, however, occurs about 1.6 mag fainter in M51. We confront the observed LF with the model for the evolution of integrated properties of cluster populations of Gieles et al. (2005b), which predicts that a truncated cluster initial mass function would result in a bend in, and a double power-law behaviour of, the integrated LF. The combination of the large field-of view and the high star cluster formation rate of M51 make it possible to detect such a bend in the LF. Hence, we conclude that there exists a fundamental upper limit to the mass of star clusters in M51. Assuming a power-law cluster initial mass function with exponentional cut-off of the form , we find that . A direct comparison with the LF of the “Antennae” suggests that there .
1 Introduction
There is a relation between the luminosity of the brightest star cluster in a galaxy and the total number of clusters (Whitmore 2003; Larsen 2002), suggesting that sampling statistics is determining the luminosity of the most luminous cluster. Since the luminosity of clusters is heavily dependent on the age, a straightforward translation from most luminous to most massive is not possible. Recently, Hunter et al. (2003) showed that the maximum cluster mass increases with log(age/yr) in the LMC and SMC, which can be interpreted as a size-of-sample effect. Also Weidner et al. (2004) suggest that the maximum cluster mass in a galaxy depends on the star formation rate in the galaxy, hence the total number of clusters. This suggests that it would be physically possible to form a super massive cluster such as W3 in NGC 7252 with a mass of (Maraston et al. 2004) in our Milky Way, but the chance is just very small. This issue is still heavily under debate and is subject of this study.
The cluster luminosity function (LF) is a powerful tool for the study of star cluster populations. In a wide variety of environments the LF can often be well approximated by a power-law distribution: , where the index is between 1.8 and 2.4 (e.g. Larsen 2002; de Grijs et al. 2003). The shape of the LF is related to, but not necessarily identical to the cluster initial mass function (CIMF). It is important to note that it is hard to relate the observed LF directly to the underlying CIMF, since the LF contains clusters of different ages. A star cluster fades about 5 magnitudes in 1 Gyr in the -band, which makes it hard to estimate the mass without knowing the age.
The LF of clusters in the “Antennae” galaxies (Whitmore et al. 1999), however, is much better approximated by a double power-law distribution. The bright side () has a steeper slope () than the faint side (). The latter is close to the value found for other galaxies. This double power-law nature with a bend, was interpreted by the authors as a turn-over in the mass function.
In Gieles et al. (2005b) we compared a cluster population model with various observed luminosity functions from the literature. We investigated various possible ways of detecting a truncated cluster initial mass function and the possible biases caused by extinction, disruption, variations in the cluster formation rate, etc. We concluded that a truncated CIMF will be observed as a bend in the integrated cluster luminosity function. We showed that tentative hints for a truncation are present in NGC 6946 (from Larsen 2002) and M51 (from Bastian et al. 2005) and are clearly not present in the SMC and the LMC (from Hunter et al. 2003).
In this work we present a greatly improved LF of clusters in M51, based on recently released deep HST observations with the Advanced Camera of Surveys (ACS) covering the entire disk of M51. The great resolution of the ACS camera is exploited by selecting clusters based on their size. With this we are able to accurately select clusters, even when they are as faint as individual bright high mass stars. The improved resolution and larger field-of-view make it possible to confirm the suggestion of Gieles et al. (2005b) that the LF of M51 is of a double power-law nature.
We show that the bend in the LF is not necessarily related to a corresponding turn-over in the MF, but results naturally if the CIMF is a power-law distribution truncated at the high-mass end.
2 Source selection and photometry
2.1 Data
We used the new HST/ACS (Hubble Heritage) data of M51 (NGC 5194) and its companion NGC 5195 in F435W (2720 sec.), F555W (1360 sec.), F658N (2720 sec.) and F814W (1360 sec.). Six pointings, corresponding to (=kpc), cover the entire disk of M51 plus the region with NGC 5195. For details on reduction we refer to Mutchler et al. (2005) and the M51 mosaic website (http://archive.stsci.edu/prepds/m51/).
2.2 Source selection
Source selection was done with the SExtractor package (Bertin & Arnouts 1996; version 2.3.2). A background map was made, by computing a mean and standard deviation of every section of the image with a user defined size. Deviating pixels were iteratively discarded until every pixel value of the background was within of the mean value. Every area of at least three adjacent pixels that exceeded the background by at least was called a source. For the details of the background estimation and source selection we refer to Bertin & Arnouts (1996). The F435W, F555W and F814W coordinates of the sources were cross-correlated and only sources within a two pixel uncertainty were kept. This resulted in a list of 75436 sources.
2.3 Photometry
Aperture photometry was performed on the source list, using the IRAF/DAOphot package using a 5 pixel aperture radius and a background annulus with an inner radius of 10 pixels and a width of 3 pixels. Aperture correction from a 5 pixel aperture to 10 pixels (=0.5”) were measured on artificial sources, generated by the BAOlab package (Larsen 1999; Larsen 2004). A Moffat profile (Moffat 1969) with power-law index of and an effective radius (), which is the radius containing half the cluster light in projection, of 3 pc was convolved with the filter dependent point spread function (PSF) of the ACS camera and the aperture correction was measured. The PSF we used was observationally determined from a crowded star field on a drizzled image of the Galactic globular cluster 47 Tuc. For each filter a separate PSF was determined. The resulting aperture corrections in F435W, F555W and F814W were and mag, respectively. These values would be 0.04 lower/higher for sources which are 1 pc bigger/smaller. The aperture corrections between 0.5” and infinity were taken from Table 5 of Sirianni et al. (2005). Finally, a correction for Galactic foreground extinction of was applied according to Appendix B of Schlegel et al. (1998). We did completeness tests by adding the same artificial clusters as used for determining the aperture correction to the image. A high background part of the image was used and the resulting 90% completeness limits in F435W, F555W and F814W were 23.3, 23.3 and 23.0 mag respectively.
2.4 Radius measurements
To distinguish between stars and clusters, we exploit the resolution of the ACS camera (1 pixel = 0.05”) to measure the radii of all sources detected in F435W, F555W and F814W using the ISHAPE routine within the BAOlab package. In summary, analytic profiles with variable effective radii are convolved with the PSF, and are then fitted to each source in the data. The best-fit was determined by minimizing the . We choose a Moffat profile with a power-law index of . Comparing the of a point source (= PSF) fit to an extended profile fit, indicated whether a source is resolved. ISHAPE is able to pick up sources with a FWHM of 0.2 pixels, which corresponds to a = 0.5 pc at the distance of M51 (distance modulus = 29.62, Feldmeier et al. 1997) The source detection and radius fits are used to define a source to be a cluster when
-
1.
the source is detected in F435W, F555W and F814W,
-
2.
the source magnitude is above the 90% completeness limit,
-
3.
the sources is extended, defined as pc,
-
4.
the of the extended profile fit is lower than that of the pure PSF fit.
These criteria resulted in clusters brighter than ().
3 The luminosity function
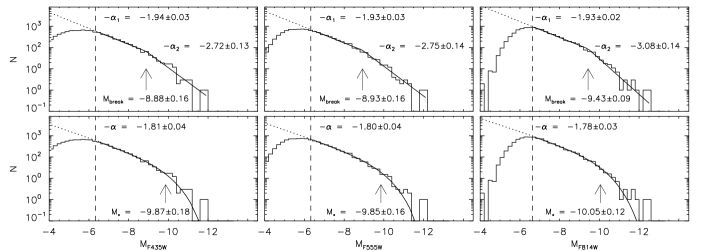

Following the source selection as described in § 2, we generate the LF of all clusters in the three available filters (left part of Fig. 1). The three columns on the left correspond with the F435W, F555W and F814W filters. In the top panels we fit a double power-law distribution, with a variable location of the break and indices and in the bottom panels we fit a Schechter function with variable and index. The results of the different fits are summarized in Table 1. Note that the slopes on the faint sides correspond to the typical value of , found in other galaxies. The slopes on the bright side () are much steeper. The break appears at higher luminosities in the F814W filter. The double power-law break shifts about 0.5 mag to the red, going from F555W to F814W. The values from the Schechter fit are about 0.2 mag brighter in F814W as compared to F435W and F555W.
In Gieles et al. (2005b) we constructed the LF of M51 clusters based on the data of Bastian et al. (2005). The data was based on two WFPC2 pointings, and the LF showed that a double power-law function was better fit than a single power-law by a factor of two, when comparing values. In this case, we obtain for the double power-law fit in the F555W band, whereas the single power-law fit results in . This shows that the increase of the field-of-view and depth of the current data set contributes considerably to the significance of the result.
The downturn at bright magnitudes and the slopes of the double power-law distribution are very similar to what Whitmore et al. (1999) found for the LF of the “Antennae” galaxies. The bend and , however, occur about 1.6 mag brighter in the “Antennae” LF. We will explain this behavior of the LF and the difference between the “Antennae” and M51 in § 4.
| Double power-law | Schechter | ||||
| Filter | Break | ||||
| Observations | |||||
| F435W | 1.94 | 2.72 | -8.88 | 1.81 | -9.87 |
| F555W | 1.93 | 2.75 | -8.93 | 1.80 | -9.85 |
| F814W | 1.93 | 3.08 | -9.43 | 1.78 | -10.05 |
| Models with | |||||
| F439W | 2.01 | 2.76 | -8.99 | 1.85 | -9.89 |
| F555W | 1.93 | 2.71 | -8.94 | 1.79 | -9.94 |
| F814W | 1.90 | 2.70 | -9.60 | 1.76 | -10.57 |
4 Comparison with a cluster population model
We have developed an analytical model which can reproduce the observable properties of a cluster population. The model was introduced in Gieles et al. (2005a) for comparison with the age and mass distribution of M51 and used in Gieles et al. (2005b) to compare with LFs in different galaxies. The model generates cells which are equally spaced in log(age/yr) and log(mass/). Weights are assigned to each cell, such that the integrated weights as a function of mass correspond to a chosen CIMF and formation rate and in that way correspond to number of clusters. Working with weigths is preferred over generating the actual number of clusters, since this can be a very high number. Then cells are evolved as if they were clusters, where mass loss due to stellar evolution and disruption are taken into account by analytical functions derived by Lamers et al. (2005).
In Gieles et al. (2005b) we showed that a physical limit to the maximum cluster mass will cause a bend in the LF. For details we refer to that paper. We generated several populations with different maximum masses. A constant cluster formation rate between yr and 10 Gyr is assumed and a power-law CIMF with an exponential cut-off , with , similar to what has been proposed for the CIMF of globular clusters (Burkert & Smith 2000). The disruption parameters from Gieles et al. (2005a) are adopted (i.e. yr). We note that with these disruption parameters all cluster older than 2 Gyr are removed from the sample. We applied an extinction of mag to all clusters, which is close to the average extinction measured by Bastian et al. (2005). All masses are converted to ACS filter magnitudes, depending on their age, using the GALEV simple stellar population models (Anders & Fritze-v. Alvensleben 2003; Schulz et al. 2002). We fit the same functions to the artificial LFs as we did to the data. In the right panel of Fig. 1 we show the result for the F555W filter for . The predicted LF parameters for all filters are summarized in the bottom part of Table 1. The bright side shows a steeper slope than the faint part, as is the case in the data. This is because the clusters with the maximum mass fade and therefore have an age-dependent contribution to the LF. The brightest cluster will be the youngest and going faint-wards, more older clusters will contribute to the LF. Faint-ward of , clusters of all ages contribute. The fact that we find shallower slopes on the faint side than the input MF slope is due to the mass dependent disruption. The fact that the bend occurs at a higher luminosity in the F814W filter, in both the model and the data, is an important confirmation of our idea that the bend is caused by a truncated MF.
When we make a direct comparison with the “Antennae” galaxies, the MF is truncated at a higher mass (), since the bend there occurs 1.6 mag brighter (Whitmore et al. 1999).
5 Discussion and conclusions
Does the fact that other galaxies have a single power-law LF imply that there is no upper limit to the cluster mass there? Probably not. The CIMF has to be sampled well enough to reach the critical , only then a bend will show up in the total cluster LF. M51 and the “Antennae” are forming enough clusters such that the CIMF is sampled until , and a bend in the LF is observable. The difference between in M51 and the “Antennae” galaxies suggest that is environment dependent.
These environmental differences might be caused by variations in the giant molecular cloud (GMC) mass distribution. Wilson et al. (2003) shows that the cloud mass function of the “Antennae” galaxies is truncated at higher masses than that of M51, which in turn is at much higher masses than in the Milky Way (Williams & McKee 1997). Other galaxies also seem to have GMC mass distributions which are truncated at the high mass end (Rosolowsky 2005). A truncated GMC mass function might impose a physical limit to the maximum star cluster mass, which will be observable in galaxies with a high star/cluster formation rates.
Acknowledgements.
We thank Marcelo Mora at ESO/Garching for kindly providing us with the empirical ACS PSFs.References
- Anders & Fritze-v. Alvensleben (2003) Anders, P. & Fritze-v. Alvensleben, U. 2003, A&A, 401, 1063
- Bastian et al. (2005) Bastian, N., Gieles, M., Lamers, H. J. G. L. M., Scheepmaker, R. A., & de Grijs, R. 2005, A&A, 431, 905
- Bertin & Arnouts (1996) Bertin, E. & Arnouts, S. 1996, A&AS, 117, 393
- Burkert & Smith (2000) Burkert, A. & Smith, G. H. 2000, ApJ, 542, L95
- de Grijs et al. (2003) de Grijs, R., Anders, P., Bastian, N., et al. 2003, MNRAS, 343, 1285
- Feldmeier et al. (1997) Feldmeier, J. J., Ciardullo, R., & Jacoby, G. H. 1997, ApJ, 479, 231
- Gieles et al. (2005a) Gieles, M., Bastian, N., Lamers, H. J. G. L. M., & Mout, J. N. 2005a, A&A, 441, 949
- Gieles et al. (2005b) Gieles, M., Larsen, S. S., Bastian, N., & Stein, I. 2005b, recommended for publication in A&A(astro-ph/0512297)
- Hunter et al. (2003) Hunter, D. A., Elmegreen, B. G., Dupuy, T. J., & Mortonson, M. 2003, AJ, 126, 1836
- Lamers et al. (2005) Lamers, H. J. G. L. M., Gieles, M., Bastian, N., et al. 2005, A&A, 441, 117
- Larsen (1999) Larsen, S. S. 1999, A&AS, 139, 393
- Larsen (2002) Larsen, S. S. 2002, AJ, 124, 1393
- Larsen (2004) Larsen, S. S. 2004, A&A, 416, 537
- Maraston et al. (2004) Maraston, C., Bastian, N., Saglia, R. P., et al. 2004, A&A, 416, 467
- Moffat (1969) Moffat, A. F. J. 1969, A&A, 3, 455
- Mutchler et al. (2005) Mutchler, M., Beckwith, S. V. W., Bond, H., et al. 2005, American Astronomical Society Meeting Abstracts, 206,
- Rosolowsky (2005) Rosolowsky, E. 2005, ArXiv Astrophysics e-prints
- Schechter (1976) Schechter, P. 1976, ApJ, 203, 297
- Schlegel et al. (1998) Schlegel, D. J., Finkbeiner, D. P., & Davis, M. 1998, ApJ, 500, 525
- Schulz et al. (2002) Schulz, J., Fritze-v. Alvensleben, U., Möller, C. S., & Fricke, K. J. 2002, A&A, 392, 1
- Sirianni et al. (2005) Sirianni, M., Jee, M. J., Benitez, N., et al. 2005, ArXiv Astrophysics e-prints
- Weidner et al. (2004) Weidner, C., Kroupa, P., & Larsen, S. S. 2004, MNRAS, 350, 1503
- Whitmore (2003) Whitmore, B. C. 2003, in A Decade of Hubble Space Telescope Science, 153–178
- Whitmore et al. (1999) Whitmore, B. C., Zhang, Q., Leitherer, C., et al. 1999, AJ, 118, 1551
- Williams & McKee (1997) Williams, J. P. & McKee, C. F. 1997, ApJ, 476, 166
- Wilson et al. (2003) Wilson, C. D., Scoville, N., Madden, S. C., & Charmandaris, V. 2003, ApJ, 599, 1049