Optical/near-infrared colours of early-type galaxies and constraints on their star formation histories
Abstract
We introduce and discuss the properties of a theoretical - integrated colour diagram for single-age, single-metallicity stellar populations. We show how this combination of integrated colours is able to largely disentangle the well known age-metallicity degeneracy when the age of the population is greater than 300 Myr, and thus provides valuable estimates of both age and metallicity of unresolved stellar systems. We discuss in detail the effect on this colour-colour diagram of -enhanced metal abundance ratios (typical of the oldest populations in the Galaxy), the presence of blue horizontal branch stars unaccounted for in the theoretical calibration, and of statistical colour fluctuations in low mass stellar systems. In the case of populations with multiple stellar generations, the luminosity-weighted mean age obtained from this diagram is shown to be heavily biased towards the youngest stellar components. We then apply this method to several datasets for which optical and near-IR photometry are available in the literature. We find that LMC and M31 clusters have colours which are consistent with the predictions of the models, but these do not provide a sensitive test due to the fluctuations which are predicted by our modelling of the Poisson statistics in such low-mass systems. For the two Local Group dwarf galaxies NGC185 and NGC6822, the mean ages derived from the integrated colours are consistent with the star formation histories inferred independently from photometric observations of their resolved stellar populations.
The methods developed here are applied to samples of nearby early-type galaxies with high quality aperture photometry in the literature. A sample of bright field and Virgo cluster elliptical galaxies is found to exhibit a range of luminosity-weighted mean ages from 3 to 14 Gyr, with a mean of 8 Gyr, independent of environment, and mean metallicities at or just above the solar value. Colour gradients are found in all of the galaxies studied, in the sense that central regions are redder. Apart from two radio galaxies, where the extreme central colours are clearly driven by the AGN, and one galaxy which also shows a radial age gradient, these colour changes appear consistent with metallicity changes at a constant mean age. Finally, aperture data for five Virgo early-type dwarf galaxies shows that these galaxies appear to be shifted to lower mean metallicities and lower mean ages (range 1 to 6 Gyr) than their higher luminosity counterparts.
keywords:
Galaxies: clusters: individual (Virgo) - galaxies: stellar content - galaxies: elliptical and lenticular - galaxies: dwarf1 Introduction
Within the currently favoured CDM models of galaxy and large scale structure formation, dwarf galaxies play a crucial role. The first stars are predicted to form in small dark matter halos of mass at redshifts of (see Bromm and Larson 2004). These small dark matter halos subsequently form the building blocks from which the larger galaxies we see around us today are assembled (Kauffman et al. 1993; Cole et al. 2000; Mathis et al. 2002). As with every building site many of the smaller component parts are left behind once the larger structures are formed and so the CDM model predicts that there should be many small dark matter halos around us today.
If this debris of small dark matter halos can be associated with dwarf galaxies then there is a large discrepancy between what is observed and what is predicted by theory, this is known as the sub-structure problem (Moore et al. 1999; Klypin et al. 1999). The standard CDM model, without dwarf galaxy formation suppression processes, predicts many more small dark matter halos (with a low mass slope of the mass function of ) compared to observations of the faint end of the global luminosity function of galaxies (; Blanton et al. 2001, Norberg et al., 2002). There have been numerous suggestions for a solution to this problem. These typically involve the prevention of gas falling into small dark matter halos (Efstathiou 1992), the removal of gas via supernova winds from the first generation of stars (Dekel and Silk 1986) or the ‘squelching’ of dwarf galaxy formation by ionising photons (Tully et al. 2002). These mechanisms prevent or severely inhibit star formation in small halos; the halos still exist, but they remain hidden from us. Interest in the possiblity that star formation in dwarf galaxies has in some way been delayed compared to larger galaxies has come from the extensive studies made using Sloan Digital Sky Survey data. This seems to indicate that it is the low luminosity galaxies that contain the youngest stars (Kauffmann et al., 2003). It is difficult to see how this ‘downsizing’ of the galaxy population fits in with the standard CDM model (Kodama et al. 2004), but it is an observation we can test with the methods we discuss in this paper. Recently other solutions have been suggested, for example by adjusting the initial dark matter fluctuation spectrum, something suggested by combining the WMAP, 2dF and Lyman- forest observations (Spergel et al. 2003), small dark matter halos themselves become rare.
By studying in detail the sub-structure problem in different galaxy environments we can hope to gain an insight into the mechanisms that prevent dark matter halos revealing themselves to us as dwarf galaxies or comment on how universally rare small halos might be. We have previously quantified the relative numbers of dwarf galaxies in different environments and find many more dwarf galaxies in the Virgo and Fornax clusters than can be found in the general field (Phillipps et al. 1998a; Sabatini et al. 2003, 2004; Roberts et al. 2004, 2005; Davies et al. 1988; Kambas et al. 2000). The general field result is also consistent with observations of the dwarf galaxy population of the Local Group (Mateo 1998; Pritchet & van den Bergh 1999). It appears that global star formation suppression mechanisms do not work. The environment plays a major role in either producing a large number of additional dwarf galaxies or in revealing more of the existing dark matter halos to us.
The expected properties of the first galaxies to form within the CDM model seem to be more closely matched to the properties of globular clusters (a star formation event followed by almost total gas expulsion) than it does to the more complicated star formation histories of dwarf galaxies. Although dwarf galaxies appear to be relatively simple stellar systems (there is little evidence for spiral stellar density waves, bars or jets, but see Barazza et al. 2002) they can be more susceptible to exterior influences. In the main dwarf galaxies show a morphology density relation with the gas poor dSph galaxies being closer to the bright galaxies in the Local Group and closer to the centres of galaxy clusters than are the dIrr galaxies (Ferguson & Sandage 1989; Mateo 1998; Boyce et al. 2001; Sabatini et al. 2003; Roberts et al. 2004). Within a cluster environment, or when they are close to a more massive galaxy, dwarf galaxies may be subject to ram pressure and/or tidal stripping, tidal destruction or ‘harassment’ processes (for a review see Sabatini et al. 2004).
Currently we essentially only have detailed star formation histories for Local Group dwarf galaxies because these are the only ones for which we have resolved observations of their stellar populations. These have been interpreted using stellar colour magnitude diagrams and models that implement different stellar ages and metallicities (Grebel & Stetson 1999; Smecker-Hane et al. 1996; Gallart et al. 1999; Mighell and Rich 1996; Skillman et al. 2003). Each of the Local Group dwarf galaxies has a quite different star formation history when studied in detail, with stellar populations covering a wide range of ages and metallicities. In general the dSph galaxies have no young stars; the stellar population is dominated by stars that are older than 10 Gyr, but there are some intermediate age stars (1-10 Gyr) indicating that star formation continued for many Gyr after their formation (Grebel 2002). The current, most widely used, CDM solution to the substructure problem (that small galaxies in the early Universe should experience a single catastrophic episode of star formation) is not supported by observations of the star formation histories of Local Group dwarf galaxies or by the large numbers of dwarf galaxies found in clusters.
Although subject to similar physical processes dwarf galaxies in clusters may have very different origins and histories to those in the Local Group. Within the cluster environment there are many more dwarf galaxies per giant (Phillipps et al. 1998b, Sabatini et al. 2003), so the clusters are not being assembled from groups like the Local Group. Also unlike the Local Group there are many early type (dE) dwarf galaxies that are not companions of the giant galaxies (Sabatini et al. 2003, 2004; Roberts et al. 2004). Ideally we would like to study the star formation histories of these galaxies in the same detail as has been done for the Local Group galaxies to see if they are consistent with each other and with the properties predicted by CDM - predominantly old, gas poor, low metallicity galaxies. Currently this is not possible for dwarf galaxies in the two nearest clusters to us (Virgo and Fornax) for two reasons. Firstly, because the bulk of the stellar population cannot be resolved at these distances (although the resolution of galaxies at these distances is a key science driver for the proposed Extremely Large Telescopes). Secondly, many of the dwarf galaxies we are particularly interested in are of such low surface brightness (LSB) that it is impossible to obtain spectra and derive line indices (Worthey 1994, Vazdekis and Arimoto 1999, Kuntschner 2000). Thus, at present we are forced to use population indicators that can be applied to completely unresolved LSB stellar populations.
In the present study we explore the use of optical/near-IR colours as diagnostics of luminosity-weighted mean ages and metallicities of stellar populations. We demonstrate that such colours have similar diagnostic power to spectral line indices, while being much less demanding in terms of observing time, data reduction and analysis. The development of such indicators is particularly timely with the recent release of the full Two-Micron All-Sky Survey (Jarrett et al. 2000; henceforth 2MASS), and the prospect of deeper surveys such as the United Kingdom Infrared Deep Sky Survey (UKIDSS) recently commenced with the United Kingdom Infrared Telescope (UKIRT).
Model predictions of optical/near-IR colours have previously been presented by several groups (e.g. Fioc and Rocca-Volmerange 1997; Smail et al. 2001, Girardi et al. 2002; Bruzual and Charlot 2003) and observational studies have already highlighted the potential of such measurements for breaking the age-metallicity degeneracy, which is the first requirement of any successful population diagnostic method. Peletier, Valentijn & Jameson (1990) used , and colours to constrain the ages and metallicities of 12 elliptical galaxies, while Peletier & Balcells (1996) demonstrated that colour-colour plots gave useful information on the mean ages of galaxy bulges and disks. Bell et al. (2000) and Bell & de Jong (2000) used and colours in the analysis of the star formation histories of low surface brightness and spiral galaxies respectively. Puzia et al. (2002) and Hempel & Kissler-Patig (2004) have recently demonstrated the power of colour-colour diagrams applied to analysis of the star-formation histories of unresolved extragalactic globular clusters.
In this paper we first develop our own predictions of the optical/near-IR colours of stellar populations as a function of age and metallicity, using models developed by two of the authors (MS and SC). We identify the - colour-colour plane as a particularly sensitive one for breaking age-metallicity degeneracy, and use photometry to test these predictions for systems (globular clusters and two dwarf galaxies in the Local Group) with existing independent measurements of age and metallicity. We also apply these methods to a small number of Virgo cluster elliptical and dwarf elliptical galaxies which have sufficiently high quality photometry in the 2MASS catalogues and -band photometry in matched apertures, in the first stage in a study of the star formation history of cluster galaxies.
2 The theoretical calibration
We employed the stellar evolution model library by Pietrinferni et al. (2004), that spans the metallicity (scaled solar metal distribution) range between Z=0.0001 and Z=0.04 (10 different metallicities in total); this model grid enables one to compute isochrones for ages from 20-40 Myr up to 15-20 Gyr, covering all evolutionary phases from the Zero Age Main Sequence (ZAMS) up to the beginning of the Thermal Pulse (TP) phase along the Asymptotic Giant Branch (AGB) or carbon ignition, depending on the mass of the most evolved objects. In order to compute correctly the near-IR integrated colours of stellar populations older than 100 Myr we have extended the evolutionary tracks of the masses that evolve along the AGB phase, until the end of the TP phase. This has been performed by means of the synthetic AGB evolution technique (see e.g. Marigo et al. 1996 and references therein) starting from the stellar structures at the beginning of the TPs. The use of this technique suffices for our purposes and avoids extremely time-consuming evolutionary computations. The analytical relationships necessary for the synthetic AGB computations (e.g. an equation for the rate of growth with time of the carbon-oxygen core, the core mass-luminosity relationship, etc) are taken from Wagenhuber & Groenewegen (1998); they are obtained from full evolutionary AGB calculations covering the relevant range of initial masses and metallicities. The analytical formulae for the determination of the model along the extended AGB phase are not given explicitly in Wagenhuber & Groenewegen (1998), but can be found in Wagenhuber (1996); the mass loss rate along the TP phase is computed according to the methods of Vassiliadis & Wood (1993). The synthetic AGB evolution is stopped when the models start to cross the Hertzsprung-Russell diagram towards their white dwarf cooling sequence.
Using this extended set of evolutionary tracks we computed isochrones for ages running from 40 Myr to 14 Gyr, suitably transformed to various photometric filters using the bolometric corrections and colour transformations described in Pietrinferni et al. (2004). For the AGB TP phase we have used the transformations described in Girardi et al. (2002) modified in the carbon star regime to reproduce the empirical colour-colour relationships for Galactic and LMC clusters’ carbon stars, as obtained from data by Mendoza & Johnson (1965) and Frogel & Cohen (1982).
Integrated magnitudes and colours for the simple stellar populations (SSPs) described by our isochrones have been determined using a Salpeter (1955) Initial Mass Function (IMF). We adopted as lower and upper IMF mass cutoffs the values 0.1 and 100, respectively, as in Bruzual & Charlot (2003). The choice of these cutoffs is important for the determination of the total mass of the system and the integrated magnitudes, but it is not critical for the integrated colour-colour calibration discussed in this paper, due to the following two reasons. First, the integrated colours are independent of the total stellar mass, apart from the case of stellar populations with masses typical of star clusters (see next subsection). Only in this case does the value of the total mass of the stellar population play a role in the determination of the integrated colours. Second, the upper limit of the mass contributing to the total flux and colours is fixed by the most massive star evolving at the age of the population, and it is at most around 10 in our discussion. As for the lower mass limit, we have found that in the photometric filters of interest, MS objects less massive than 0.5 do not provide an appreciable contribution to the integrated flux. To give a quantitative estimate of the contribution of these low-mass stars, we have recomputed the and colours neglecting stars with masses below 0.5. We found that the values are decreased by less than 0.01 mag and is decreased by only 0.03-0.05 mag over the full range of ages and metallicities of our calibration.

Figure 1 displays the theoretical integrated and colours for a subset of our isochrones with ages of, respectively, 40, 300 and 600 Myr, and 1, 3, 6, 10, and 14 Gyr (from bottom to top) and (from left to right) [Fe/H]=–1.79, –1.27, –0.66, 0.06, and 0.40. This combination of colours is able – for ages larger than Myr – to appreciably disentangle the effect of age and metallicity on the observed integrated fluxes. Some residual degeneracy is still present between 600 Myr and 1 Gyr at the high metallicity end of the calibration. The integrated colour appears to be a good tracer of the initial metallicity of a Simple Stellar Population (SSP) and is weakly affected by age, whereas the integrated is a good age indicator, mildly affected by the SSP metallicity. The direction of the reddening vector is also shown in the figure.
We have studied the contribution of the individual evolutionary phases to the , and integrated magnitudes and found, not unexpectedly, that the and integrated fluxes are dominated by AGB stars when the SSP age is below Gyr, and by upper Red Giant Branch (RGB) objects for higher ages. As for the integrated flux, the main contribution comes always from the upper Main Sequence (MS) and TO stars. This means that the integrated colour is mainly determined by the colour of AGB and/or RGB stars, whose location is strongly affected by their initial metallicity, whereas is sensitive to the magnitude and colour of the TO, hence to the SSP age.
It is also very interesting to notice how the theoretical integrated colour diagram closely mirrors the behaviour of the theoretical calibrations of pairs of Lick indices (e.g. Worthey 1994) like, for example , where is a tracer of the stellar population age and is sensitive mainly to the metal content.
For ages above 10 Gyr the colour tends to lose sensitivity to age, whereas below 300 Myr there is full degeneracy between age and metallicity, since the lines corresponding to different metallicities overlap. These general properties of the integrated - diagram are not peculiar to our set of models; they are displayed also i.e., by the Girardi et al. (2002) and Bruzual & Charlot (2003) integrated colours. As an example, we show in Fig. 2 the Girardi et al. (2002) theoretical diagram, for the age range where the age-metallicity degeneracy is broken.

2.1 The effect of statistical fluctuations
Given that the fast evolving upper RGB and AGB stars are the main contributors to the integrated colours, it is very important to assess the effect of small number statistics on the integrated and colours. When the mass of the SSP under scrutiny is small – total masses up to , the upper end of the mass spectrum of star clusters – the number of stars in these fast evolutionary phases is subject to sizable fluctuations from one SSP to another, with potentially large fluctuations of the integrated magnitudes and colours. To quantify this effect we have performed a series of Monte-Carlo simulations.
We have considered the following combinations of ages () and [Fe/H] values: [Fe/H]=1.79 and 10 Gyr, [Fe/H]=0.66 and 10 Gyr, [Fe/H]=1.27 and 600 Myr. For each one of these combinations, we have drawn stars randomly from a Salpeter IMF and placed them in their evolutionary phases along the isochrone at that age, until a cluster mass of is reached. The integrated colours of the resulting populations have been then computed. In general, we found that the fluctuations are negligible in since this wavelength range is dominated by the much more populous MS phase.

The open squares, triangles and pentagons in Fig. 3 display the integrated colours obtained from 100 realizations each for the three adopted age and metallicity combinations. The colours show a very large spread due to statistical fluctuations of the number of stars along the upper RGB and AGB phases. This spread increases for decreasing age because of the shorter timescales. Hence, there are larger number fluctuations along the AGB phase that dominate the colours at 600 Myr. The colour spread causes a 3 uncertainty of 2 dex in the inferred metallicity at 600 Myr, and dex at 10 Gyr. The fluctuation of is entirely due to the fluctuation of the magnitudes and it is interesting to notice that the path in the colour-colour plane described by the 100 realizations follows a vector that is almost parallel to lines of constant age. At 600 Myr the fluctuations cause an almost negligible uncertainty on the age, while the effect is more important at 10 Gyr, due to the lower sensitivity of to age in this age range.


These fluctuations can clearly be seen in Figs. 4 and 5, which show the colours of bright star clusters in the Large Magellanic Cloud (LMC) and M31 globular clusters, superimposed on our models. The photometry for the LMC clusters is taken from van den Bergh (1981), the and photometry (plus reddening estimates) is from Persson et al. (1983); the age classification comes from van den Bergh (1981), and is based on integrated colours. Figure 4 shows that the young LMC clusters scatter along the tracks predicted for the early colour evolution of clusters, and illustrates that at these ages (300 Myr) the colours predicted by the models are completely degenerate. The oldest clusters lie fairly close to the colour predicted for an age of 14 Gyr and [Fe/H] = 1.79, but with a large scatter very similar in size and direction to that shown in the simulated old clusters in Fig. 3.
In case of the M31 globular clusters we considered the sample recently observed by Rich et al. (2005). The bright resolved stars of this cluster sample provide an estimate of the individual photometric metallicities and reddenings; the integrated colours are taken from Galleti et al. (2004). The metallicity range spanned by these M31 clusters is approximately enclosed by the two metallicities [Fe/H]=1.79 and 0.66 used in our simulations of 10 Gyr old populations. Figure 5 shows clearly how the observed colour distribution follows to a good approximation the distribution of points in Fig. 3 for the two old populations.
As an aside, we have also computed Monte-Carlo simulations for the colour fluctuations, employing the same cluster masses and metallicities as an analogous test performed by Bruzual & Charlot (2003), and recovered essentially the same results as these authors.
To conclude, Figs. 4 and 5 generally show strong encouragement for the predictions of our modelling; but it is also clear that this statistical fluctuation effect seriously limits the use that can be made of stellar clusters in testing these predictions. It should be emphasised that these statistical fluctuations of the integrated colours are only significant for stellar systems up to the sizes of large globular clusters, and are completely negligible for galaxies of 10 and larger (i.e. all galaxies considered in the current paper).
2.2 Anomalous Horizontal Branch colours
In general, colours and spectral features involving the blue part of the spectrum can be seriously affected by the presence of blue Horizontal Branch (HB) stars not accounted for in the theoretical calibration. Such stars have high temperatures and can add an appreciable contribution to the flux e.g. in the filter and Balmer lines. The models we used in our analysis have been computed with a standard Reimers (1975) mass loss law along the RGB, with the free parameter . This choice allows one to reproduce the mean colour of the HB in Galactic globular clusters of various metallicities, that qualitatively corresponds to a shift from red to blue – for a mean value of the age of 12-13 Gyr – when the metallicity decreases. However, as has been well known for many years (e.g. Sandage & Wildey 1967) some Galactic globular clusters of intermediate metallicity (e.g. [Fe/H] between 1.6 and 1.1) like the pairs M3-M13, NGC362-NGC288, show significantly different mean colours (M13 and NGC 288 having a much bluer HB with respect to their counterparts, that display an HB colour in line with other clusters of the same metallicity) in spite of having apparently the same age and the same [Fe/H]. This occurrence is the so-called second parameter phenomenon. Indeed, one explanation for this different morphology would be a higher age for the blue HB clusters (lower evolving mass hence bluer HB colours) but this appears not to be confirmed by their TO brightness.

The effect of an unaccounted-for blue HB on the - integrated colours has been evaluated with the following numerical test. For ages of 10 and 14 Gyr, and [Fe/H]=1.27 we have computed isochrones using a more efficient mass loss along the RGB (the value of has been doubled) that produced an HB much bluer than the case of our standard colours discussed above. The integrated colours for these blue HB populations have then been computed homogeneously with our standard case, and are displayed in Fig. 6. As expected, the effect on the inferred age is significant; these blue HB populations appear to be Gyr old when the age is evaluated using our standard calibration, instead of 10 and 14 Gyr. The metallicity estimate is only slightly affected, because of a small contribution of the HB to the J and K colours. This quantitative estimate is typical for all populations with ages greater than 10 Gyr, i.e. the age range where this effect is found at work in Galactic clusters.
2.3 The effect of an -enhanced metal distribution
The scaled solar metal distribution, used in almost all stellar evolution computations and adopted in our standard models, is not universal. Probably the most relevant example of this phenomenon is the fact that the initial chemical composition of both the old field and globular cluster stars in the Galactic halo displays a ratio [/Fe] (Carney 1996), where with we denote the so-called elements (O, Ne, Mg, Si, S, Ca, Ti). Also elliptical galaxies (e.g. Worthey, Faber & Gonzalez 1992) and metal poor stars in other Local Group galaxies appear to have been formed with an initial [/Fe]0, although with different degrees of enhancement.
We have studied the effect of an -enhanced metal mixture on the integrated and colours by performing the following test. The [/Fe]=0.4 models by Cassisi et al. (2004) extended along the AGB TP phase have been employed to determine the integrated colours for the following age-metallicity combinations: [M/H]=, age 3 and 10 Gyr; [M/H]=0.06, age 10 Gyr. We recall that in the case of a scaled solar metal mixture [M/H]=[Fe/H], whereas in case of this adopted -enhanced mixture [Fe/H]=[M/H]0.35. The results of this test are displayed in Fig. 6. The age inferred for the -enhanced populations when using our standard calibration is the correct one for the 10 Gyr population, whereas there is an age overestimate of about 1-2 Gyr for the 3 Gyr case. The [/Fe]0 colours are shifted to the blue with respect to the scaled solar ones, and their values are within 0.1 dex of the corresponding to [Fe/H]=[M/H]0.35 and a scaled solar metal mixture. We have found these same results concerning the recovered age and [Fe/H] when we performed the same comparisons at both lower and larger metallicities. Overall, the combined effect of an -element enhancement on both the theoretical models (i.e., evolutionary timescales and the luminosity- plane) and the bolometric corrections to the , and bands, makes this colour combination a good tracer of the [Fe/H] ratio, even in the presence of a ratio [/Fe]0.
To summarize, a scaled solar calibration of the - diagram is able to recover the correct age and approximately the correct [Fe/H] of an -enhanced population with [/Fe] typical of the Galactic halo. In case of a younger 3 Gyr old population, the inferred age tends to be overestimated by 1-2 Gyr. Similar offsets are found over the entire range of metallicities investigated in this paper.
2.4 The effect of the IMF exponent
To estimate the effect of possible departures from the Salpeter IMF, we have computed the integrated colours of solar metallicity SSPs using different exponents of the IMF. The results for two specific ages (14 Gyr and 600 Myr, respectively) are shown in Fig. 6. As a general rule, a more negative value of the exponent (MS dominated population) shifts the integrated colours towards bluer values, whereas the opposite is true in case of a less negative exponent (giant dominated population).
The reason for this behaviour is easily understood by recalling that MS objects less massive than do not contribute appreciably to the total integrated flux in the our photometric bands of choice, even if we decrease the exponent of the IMF significantly. For example, if we set the exponent to 3, excluding the contribution of stars with decreases the colour of a 10 Gyr, [Fe/H]=0.06 population by only 0.012 mag and the colour by 0.08 mag. An MS dominated SSP will have a larger contribution of MS stars to the integrated flux, but MS objects in the relevant mass range () are typically bluer than bright RGB and AGB objects (that still provide the largest contribution to the and fluxes) and thus make the integrated colours slightly bluer compared to the case of the Salpeter exponent. The opposite is true in a giant dominated SSP. The magnitude of this effect increases with decreasing age, because the extension of the MS reaches brighter magnitudes and bluer colours when the age decreases.
2.5 Composite stellar populations
The colour-colour diagram of Fig. 1 refers to simple stellar populations, made of coeval stars born with the same chemical composition. In the case of a complex star formation history, the age and metallicity obtained from this diagram will reflect some mean value, that is determined by the number and luminosity of the objects belonging to various stellar generations formed during the system’s lifetime.
The age sensitive colours are obviously very sensitive to the presence of young populations, whose Main Sequence is very bright in the B band. The metallicity-sensitive colour is strongly affected by intermediate age populations (300 – 600 Myr old) that show a very bright AGB.
We found that, keeping the metallicity constant, the age inferred from is always biased towards the youngest stellar component. In the case, for example, of two star formation bursts 40 Myr and 10 Gyr old, the is completely dominated by the youngest population, even if this contributes to the total system mass by only 3-5%. This is very similar to the conclusions reached by Tantalo & Chiosi (2004) in a theoretical study of the age-determinations using H and [MgFe] line indices. Their models showed that a burst of star formation involving 2% of the stellar mass of an otherwise old population would significantly perturb the derived age to young values for a period of order 2 Gyr after the onset of the burst.
A powerful test for the adequacy and usefulness of the theoretical calibration discussed in this paper, is provided by the comparison of our model predictions with integrated colours of Local Group galaxies, whose star formation histories (star formation rate - SFR - plus age-metallicity relation - AMR) are independently estimated from their resolved stellar populations.
2MASS and total integrated magnitudes for the Local Group galaxies NGC 6822 (dwarf Irregular) and NGC 185 (dwarf Elliptical) have been taken from Jarrett et al. (2003), while the integrated magnitudes have been taken from the Third Reference Catalogue of Bright Galaxies (de Vaucouleurs et al. 1991). Estimates of the star formation histories of these two galaxies, using Colour-Magnitude-Diagrams of their resolved stellar populations, are available in the literature (i.e., Gallart et al. 1996, Wyder 2001 for NGC 6822; Martínez-Delgado, Aparicio & Gallart 1999 for NGC 185). Observed colours, and magnitudes have been transformed to the Bessell & Brett (1988) system using the transformations by Carpenter (2001). Extinction corrections from Schlegel, Finkbeiner & Davis (1998) have been applied, and no correction for possible internal extinction has been considered.
Figure 7 displays the integrated colours of these two galaxies compared to our model grid. NGC 6822 appears to be young, located in the region of full degeneracy between age and metallicity effects. In light of our previous discussion about composite stellar populations, the position of NGC 6822 on our colour-colour diagram is fully consistent with its estimated star formation history, that displays a sizable star formation rate at young ages. NGC 185 appears to be older, with a mean age slightly above 3 Gyr and a mean metallicity of the order of [Fe/H]1.8. This is again consistent with the star formation rate inferred from its resolved stellar population, dominated by ages above 8 Gyr, and a much smaller star formation activity at young ages.

A more quantitative test has been performed in case of NGC 6822 (an analogous quantitative estimate for NGC 185 could not be performed, because of the lack of a firm estimate of the AMR for this galaxy). Wyder (2001) provides the SFR and AMR for three fields within the central bar, and two outer fields. The star formation history of the central bar fields – located in a region that contributes most to the total integrated magnitude of the galaxy – has been employed to determine their expected integrated colours. These theoretical predictions, displayed in Fig. 7, show a very good agreement with the observed integrated colour of the whole galaxy.
3 Application of this method to early-type galaxies
In this section we will use the model colours to determine properties of the early-type galaxy population in the nearby Virgo cluster and the general field. The 2MASS database contains photometry for most of the giant galaxies in Virgo, and a smaller but useful number of the brighter dwarf galaxies, so the main problem is finding matching -band photometry. Our initial analysis made use of extrapolated total magnitudes from the Virgo Cluster Catalogue (Binggeli, Sandage & Tammann 1985), which we combined with the 2MASS magnitudes to derive total magnitudes (see e.g. Mannucci et al. 2005). However, we found systematic offsets between the colours thus obtained and those calculated from aperture photometry of the same galaxies (Poulain 1988, Poulain& Nieto 1994), in the sense that the extrapolated magnitudes gave bluer colours than aperture measurements, typically by 0.2–0.3 mag., so we restricted the analysis to galaxies with matched aperture photometry in all three passbands (, and ).
One extremely useful database is that of Michard (2005) who studies the optical/near-infrared colours of 94 elliptical galaxies out to a distance modulus =33.52 and with total integrated magnitude 18.8, using 2MASS near-IR images and optical aperture photometry from the literature. He quotes colours within an effective aperture ; in every case this is interpolated from the published multi-aperture photometry in exactly the same way for the optical and near-infrared photometry, so no systematic colour differences should result from this procedure. Note that the photometry we use, which is originally from Poulain(1988) and Poulain & Nieto (1994), is not mentioned in the main text of Michard’s paper, but is available in the associated on-line data. The integrated magnitudes have been dereddened and -corrected as described in Michard (2005), and the infrared magnitudes and colours transformed to the standard Bessell & Brett (1988) system following Carpenter (2001).
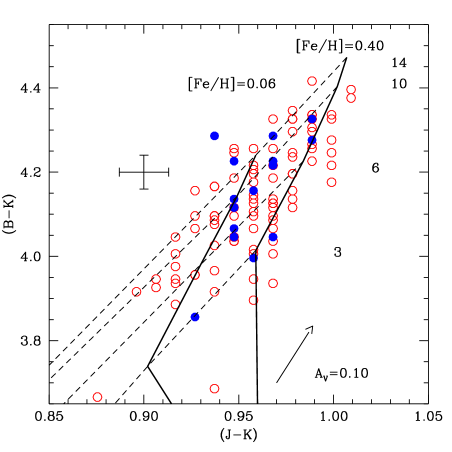
Figure 8 displays the colours of the 94 galaxies overlaid onto the theoretical calibration. The filled symbols show 16 objects belonging to the Virgo cluster, the highest density environment in the region of space sampled by these data. The distribution of about 99% of the galaxies in the sample follows nicely a mean linear relationship between and , corresponding to an average age of 8 Gyr and a range in [Fe/H] values between +0.4 and about the solar value. Superimposed on this mean relationship is an age spread that spans the range between 3 and 14 Gyr. As an example, in the Virgo cluster NGC 4478 has a luminosity weighted age of about 3 Gyr, whereas NGC 4374 is about 10 Gyr old. These age and metallicity spreads appear to be real, and are not due to the observational errors, which are quite small in comparison. We note that the use of the models of Girardi et al. (2002) would result in somewhat higher mean metallicities and younger mean ages in the colour range covered by this galaxy sample.
The distributions of points corresponding to the Virgo galaxies and the rest of the objects are statistically the same, as verified with a 2-dimensional Kolmogorov-Smirnov (KS) test (Press et al. 1992). Thus we find no evidence for environmental effects on the luminosity-weighted mean ages and metallicities of bright ellipticals in the sample of Michard (2005).
In general, the integrated colours of this sample show that, if ellipticals formed in a single star formation episode, their epoch of formation spans a large range of redshifts. If multiple generations are present together with an old component formed soon after the Big Bang, the age range derived in this analysis can be explained in terms of different fractions of intermediate age/young populations, which bias the luminosity-weighted ages towards lower values. The presence of very young populations (ages below 100 Myr) at a level larger than 1-2% (by mass) can be excluded by the results of this colour-colour analysis.
4 Age and metallicity gradients within galaxies

One complication in comparing results from integrated colours with literature studies based on line indices is that the latter are generally based on spectroscopic measurements which are only available for central regions of the galaxies concerned. Thus it is important to check for systematic gradients in derived properties of stellar populations which may affect such comparisons. One advantage of the methods presented here is that it is simple to get spatially-resolved information from array imaging, and hence to compare central and global stellar populations.
A subsample of 8 Virgo galaxies with aperture photometry from Poulain (1988), Poulain & Nieto (1994) and 2MASS is displayed in Fig. 9, upper frame; the sample contains NGC 4261 (open circles), NGC 4365 (filled circles), NGC 4374 (open pentagons), NGC 4472 (open squares), NGC 4473 (filled squares), NGC 4486 (filled pentagons), NGC 4621 (filled triangles) and NGC 4636 (open triangles). The aperture sizes (diameters) used by these authors were , , , and (although in the case of NGC 4473 the largest aperture is ). However, for every one of these galaxies we found a monotonic trend in colours with aperture, with the reddest colours being found for the smallest aperture, so we only plot symbols for the smallest and largest apertures. The typical error bars associated to the colours through an individual aperture are displayed in the upper left corner.
The general trend is of redder colours for decreasing aperture, a well known result (see, e.g. Peletier et al. 1990). The two galaxies with the reddest colours are NGC 4261 and NGC 4486, both of which are radio galaxies with strong nuclear emission, and so the colours are not reliable indicators of the underlying stellar population. Interestingly, for NGC 4374, NGC 4473, NGC 4636 and, to some extent, also NGC 4621 (if one takes into account the size of the error bars on the colours of each individual aperture) the colour gradients correspond to a sequence of increasing metallicity at approximately constant age. The slope of these radial colour gradients in the plane is therefore similar to the mean slope of the total integrated colours for the whole sample of galaxies, a result in agreement with Peletier et al. (1990) who employed the plane. Approximately constant luminosity-weighted ages at different radii are also found in relatively young looking galaxies like NGC 4636 and NGC 4473 (luminosity weighted ages of 6 Gyr and 3 Gyr respectively); this implies that any intermediate age/young population that eventually coexists with an old (10-14 Gyr) first stellar generation must be evenly spread throughout the parent galaxy.
The situation for NGC 4365, and to some extent NGC 4472, is different. Moving from the largest aperture towards the smallest one, the colour stays approximately constant, whereas increases. This implies that the luminosity-weighted age decreases from 10 Gyr to below 6 Gyr, and [Fe/H] increases from to above 0.40. Internal extinction should not be responsible for these different colour gradients (nor for the colour gradients of all other objects displayed in the figure) given that these are all early-type galaxies. Only a progressively bluer morphology (which would have to be bluer than the underlying theoretical calibration) of the HB with decreasing radius would be able to keep the NGC 4365 colour constant for increasing and metallicity.
The lower frame in Fig. 9 shows similar results for 5 dwarf galaxies in the Virgo cluster. These are the only Virgo cluster galaxies classified as dwarfs by Binggeli et al. (1985) which have 2MASS photometry with errors in 0.08 mag., and for which -band photometry is available from the survey of Sabatini et al. (2003). The latter study covered two strips of total area 25 deg2 within the Virgo cluster. The galaxies plotted are UGC 7436, type dE5, plotted as filled squares; IC 781, type dS0,N, plotted as filled triangles; IC 3292, type dS0, plotted as filled circles; UGC 7399A, type dE5,N, plotted as open circles; and NGC 4640, type dS0,N, plotted as open squares. Again, only the smallest (10′′) and largest (40–60′′) apertures are plotted for most of these; where this is done, the smallest apertures always have the reddest colours. Only in the case of NGC 4640 have all the aperture colours been plotted separately. For some reason this galaxy exhibits very different colour gradients from the other dwarfs. In this case the colours redden monotonically from the smallest aperture (10′′) to the largest aperture (50′′), while the colour does a peculiar loop to redder colours and back again. Apart from this galaxy, the overall colour gradients appear to be dominated by increasing metallicity towards the centres of these galaxies, with any age gradients being small, and those which are seen going in both directions. However, the most interesting result from this small number of dwarf galaxies is not in the colour gradients, but in the overall position of these dwarfs compared to the more luminous galaxies seen both in the upper frame of Fig. 9 and in Fig. 8. The dwarfs are shifted with respect to the brighter galaxies, both towards lower metallicities and, more interestingly, towards lower luminosity-weighted mean ages, with a range for the dwarfs of 1–6 Gyr. It is hard to draw any general conclusions from such a small sample, but the difference is quite striking, particularly given that we are studying the very brightest end of the dwarf galaxy luminosity function, because of the difficulty in detecting lower luminosity and hence lower-surface-brightness galaxies with the relatively shallow 2MASS data.
Thus we do see significant gradients in colours as a function of aperture size, which needs to be borne in mind when comparing integrated properties using colours with nuclear properties using line indices, particularly since spectroscopic apertures will tend to be much smaller even than the smallest apertures used here.
5 Discussion and conclusions
We will summarise briefly our conclusions on the nature of the stellar populations of the various galaxy samples as revealed by their optical/near-infrared colours. It is useful to remember at this point that the ages and metallicities derived are luminosity-weighted mean values, and we have shown that, as for spectroscopic indices, the results can be heavily skewed by the presence of even a small (a few per cent by mass) young stellar population in an otherwise old galaxy.
For the bright elliptical galaxy sample of Michard (2005), we find that the integrated colours within the effective radius for these galaxies reveal stellar populations with mean ages averaging about 8 Gyr, but with a real scatter, larger than the measurement errors, covering the range from 3–14 Gyr. Mean [Fe/H] values are just above solar, but again there is a real scatter, from just below solar to just above [Fe/H]0.4. The Virgo cluster galaxies contained within Michard’s sample show no statistically significant differences in their integrated parameters than the sample as a whole, so there is no evidence for strong environmental effects on either mean stellar ages or metallicities.
A more detailed study of population gradients within 8 Virgo cluster giant galaxies and 5 Virgo cluster dwarf galaxies reveals a strong trend for central regions of all galaxies to have higher metallicities than the galaxies as a whole. Evidence for age gradients is much more marginal, but one giant galaxy shows evidence for a younger central population, while the dwarfs show weak evidence for age gradients in both directions.
Considering the 5 Virgo dwarf galaxies together, we find that they have younger mean stellar ages than their more luminous counterparts. Clearly, this is too small a sample to be drawing general results about the dwarf galaxy population as a whole, but it should be noted that such a result would be consistent with recent observational results by Caldwell et al. (2003), using spectral indices of low-luminosity galaxies in Virgo and lower density environments, and Kauffmann et al. (2003), who perform a statistical study of the star formation histories of galaxies from the Sloan Digital Sky Survey.
There are two conclusions we can make from this preliminary study. Firstly, if we assume that all these galaxies contain a simple stellar population (SSP), then quite contrary to the hierarchical model of galaxy formation the smallest galaxies have not formed first at redshifts of 6-10 (ages greater than 12 Gyr for standard CDM) but, this does fit in with the ‘downsizing’ scenario discussed in the introduction. Secondly, if these galaxies do not contain a SSP but do have a small fraction of young stars then the feedback mechanisms discussed in the introduction are inefficient - these galaxies have retained at least some gas to enable them to continue to form stars over long periods of time (see also the model by Kobayashi, 2005, which has this property). This second interpretation fits in very well with observations of the resolved stellar populations found in Local Group dwarf galaxies (Grebel & Stetson 1999; Smecker-Hane et al. 1996; Gallart et al. 1999; Mighell & Rich 1996) and discussed in the introduction.
Unfortunately, it is only possible to study the brightest of the Virgo dwarf elliptical galaxies using 2MASS photometry. However, with new data becoming available, e.g. from the UKIDSS project, it should be possible to derive the required colours for some hundreds of Virgo cluster dwarfs, pushing significantly further down the luminosity function.
Acknowledgments
This publication makes extensive use of data products from the Two Micron All Sky Survey, which is a joint project of the University of Massachusetts and the Infrared Processing and Analysis Center/California Institute of Technology, funded by the National Aeronautics and Space Administration and the National Science Foundation. We warmly thank Tom Jarrett for his very prompt calculation of some additional aperture photometry which was not available in the online 2MASS database, and Rory Smith for providing optical magnitudes for Virgo cluster dwarfs. This research has made use of the NASA/IPAC Extragalactic Database (NED) which is operated by the Jet Propulsion Laboratory, California Institute of Technology, under contract with the National Aeronautics and Space Administration. The referee is thanked for several helpful comments, one of which led to the discovery of the problem with the use of extrapolated total magnitudes in calculating colours.
References
Barazza F., Binggeli B., Jerjen H., 2002, AA, 391, 823
Bell E. F., Barnaby D., Bower R. G., de Jong R. S., Harper D. A.,
Hereld M., Loewenstein R. F., Rauscher B. J., 2000, MNRAS, 312, 470
Bell E. F., de Jong R. S., 2000, MNRAS, 312, 497
Bessell M. S., Brett J. M., 1988, PASP, 100, 1134
Binggeli B., Sandage A., Tammann G., 1985, AJ, 90, 1681
Blanton et al., 2002, AJ, 121, 2358
Boyce P. J., Phillipps S., Jones J. B., Driver S. P., Smith R. M.,
Couch W. J., 2001, MNRAS, 328, 277
Bromm V., Larson R., 2004, ARAA, 42, 79
Bruzual G., Charlot S., 2003, MNRAS, 344, 1000
Caldwell N., Rose J. A., Concannon K. D., 2003, AJ, 125, 2891
Carney B.W., 1996, PASP, 108, 900
Carpenter J. M., 2001, AJ, 121, 2851
Cassisi S., Salaris M., Castelli F., Pietrinferni A., 2004, ApJ, 616,
498
Cole S., Lacey C., Baugh C., Frenk C., 2000, MNRAS, 319, 168
Davies J., Phillipps S., Cawson N., Disney M., Kibblewhite E., 1988, MNRAS, 232, 239
de Vaucouleurs G., de Vaucouleurs A., Corwin H. G., Buta R. J., Paturel
G., Fouqué P., 1991, “Third Reference Catalogue of Bright Galaxies”,
Springer-Verlag
Dekel A., Silk J., 1986, ApJ, 303, 39
Efstathiou G., 1992, MNRAS, 256, 43
Ferguson H. C., Sandage A., 1989, ApJ, 346, 53
Fioc M., Rocca-Volmerange B., 1997, AA, 326, 590
Frogel J. A., Cohen J. G., 1982, 253, 580
Gallart C., Aparicio A., Bertelli G., Chiosi C., 1996, AJ, 112, 2596
Gallart C, Freedman W., Aparicio A., Bertelli G., Chiosi C., 1999,
AJ, 118, 2245
Galleti S., Federici L., Bellazzini M., Fusi Pecci F., Macrina S.,
2004, A&A, 416, 917
Girardi L., Bertelli G., Bressan A., Chiosi C., Groenewegen M. A. T.,
Marigo P., Salasnich B., Weiss A., 2002, A&A, 391, 195
Grebel E., 2002, in ‘Modes of Star Formation and the Origin of Field
Populations’, ASP conf. ser.,
Vol. 285, eds. E. K. Grebel and W. Brandner
Grebel E., Stetson P., 1999, in ‘The Stellar content of the Local
Group’, IAU Symp. 192, ed. P. Whitelock and R. Cannon
Hempel M., Kissler-Patig M., 2004, A&A, 428, 459
Jarrett T.H., Chester T., Cutri, R., Schneider S., Skrutskie M.,
Huchra, J. P., 2000, AJ, 119, 2498
Jarrett T.H., Chester T., Cutri, R., Schneider S., Skrutskie M.,
Huchra, J. P., 2003, AJ, 125, 525
Kambas A., Davies J., Smith R., Bianchi S. and Haynes J., 2000. AJ, 120, 1316
Kauffmann G., White S., Guiderdoni B., 1993, MNRAS, 264, 201
Kauffmann G., et al., 2003, MNRAS, 341, 54
Klypin A., Kravtsov A., Valenzuela O., Prada E., 1999, ApJ, 522, 82
Kobayashi C., 2005, MNRAS, 361, 1216
Kodama T., et al., 2004, MNRAS, 350, 1005
Kuntschner H., 2000, MNRAS, 315, 184
Marigo P., Bressan A., Chiosi C., 1996, A&A, 313, 545
Mateo M., 1998, ARAA, 36, 435
Mathis H., Lemson G., Springel V., Kauffman G., White S. D. M., Eldar A.,
Dekel A., 2002, MNRAS, 333, 739
Mannucci F., Della Valle M., Panagia N., Cappellaro E., Cresci G., Maiolino
R., Petrosian A., Turatto M., 2005, A&A, 433, 807
Martínez-Delgado D., Aparicio A., Gallart C., 1999, AJ, 118, 2229
Mendoza E. E., Johnson H. L., 1965, ApJ, 141, 161
Michard R., 2005, A&A, 429, 819
Mighell K., Rich M., 1996, AJ, 111, 777
Moore B., Lake G., Quinn T., Stadel J., 1999, MNRAS, 304, 465
Norberg et al., 2002, MNRAS, 336, 907
Peletier R. F., Valentijn E. A., Jameson R. F., 1990, A&A, 233, 62
Peletier R. F., Balcells M., 1996, AJ, 111, 2238
Persson S. E., Aaronson M., Cohen J. G., Frogel J. A., Matthews K.,
1983, ApJ, 266, 105
Phillipps S., Parker Q., Schwartzenberg J., Jones, J., 1998a, ApJ, 493, L59
Phillipps S., Driver S. P., Crouch W. J., Smith R. M., 1998b, ApJ,
498, 119
Pietrinferni A., Cassisi S., Salaris M., Castelli F., 2004, ApJ, 612,
168
Poulain P., 1988, A&AS, 72, 215
Poulain P., Nieto J.-L., 1994, A&AS, 103, 573
Press W. H., Flannery B. P., Teukolsky S. A., Vetterling W. T., 1992,
“Numerical Recipes in C”, Cambridge University Press
Pritchet C. J., van den Bergh S., 1999, AJ, 118, 883
Puzia T. H., Zepf S. E., Kissler-Patig M., Hilker M., Minniti D.,
Goudfrooij P., 2002, A&A, 391, 453
Reimers D., 1975, Mem. Soc. R. Sci.
Liège, 8, 369
Rich R. M., Corsi C. E., Cacciari C., Federici L., Fusi Pecci F.,
Djorgovski S. G., 2005, AJ, 129, 2670
Roberts S., Davies J., Sabatini S., van Driel W., O’Neil K., Baes M.,
Linder S., Smith R., Evans R., 2004, MNRAS, 352, 478
Roberts et al., 2005, MNRAS, submitted
Sabatini S., Davies J., Scaramella R., Smith R., Baes M., Linder S. M.,
Roberts S., Testa V., 2003, MNRAS, 341, 981
Sabatini S., Davies J., van Driel W., Baes M., Roberts S., Smith R.,
Linder S., O’Neil K., 2005, MNRAS, 357, 819
Salpeter, E. E., 1955, ApJ, 121, 161
Sandage A., Wildey R., 1967, ApJ, 150, 469
Schlegel D. J., Finkbeiner D. P., Davis M., 1998, ApJ, 500, 525
Skillman E. D., Tolstoy E., Cole A. A., Dolphin A. E., Saha A.,
Gallagher J. S., Dohm-Palmer R. C., Mateo M., 2003, ApJ, 596, 253
Smail et al., 2001, MNRAS, 323, 839
Smecker-Hane T. A., Stetson P. B., Hesser J. E., Vandenberg D. A., 1996,
in ‘Stars to galaxies: the impact of stellar physics on galaxy evolution’,
ASP Conf. Ser., Vol. 98, p. 328
Spergel D. N. et al., 2003, ApJS, 148, 175
Tantalo R., Chiosi C., 2004, MNRAS, 353, 405
Tully R. B., Somerville R. S., Trentham N., Verheijen M. A. W., 2002,
ApJ, 569, 573
van den Bergh S., 1981, A&AS, 46, 79
Vassiliadis E., Wood P. R., 1993, ApJ, 413, 641
Vazdekis A., Arimoto N., 1999, ApJ, 525, 144
Wagenhuber J., Groenewegen M. A. T., 1998, A&A, 340, 183
Wagenhuber J., 1996, PhD thesis, Techn. Univ. München
Worthey G., Faber S. M., Gonzalez J. J., 1992, ApJ, 398, 69
Worthey G., 1994, ApJS, 95, 107
Wyder T.K., 2001, AJ, 122, 2490