Deep 1.4-GHz observations of diffuse polarized emission
Abstract
Polarized diffuse emission observations at 1.4-GHz in a high Galactic latitude area of the northern Celestial hemisphere are presented. The field, centred at RA = , Dec = (B1950), has Galactic coordinates , and is located in the region selected as northern target of the BaR-SPOrt experiment. Observations have been performed with the Effelsberg 100-m telescope. We find that the angular power spectra of the – and –modes have slopes of and , respectively. Because of the very high Galactic latitude and the smooth emission, a weak Faraday rotation action is expected, which allows both a fair extrapolation to Cosmic Microwave Background Polarization (CMBP) frequencies and an estimate of the contamination by Galactic synchrotron emission. We extrapolate the –mode spectrum up to 32-GHz and confirm the possibility to safely detect the CMBP –mode signal in the Ka band found in another low emission region (Carretti et al., 2005b). Extrapolated up to 90-GHz, the Galactic synchrotron –mode looks to compete with the cosmic signal only for models with a tensor-to-scalar perturbation power ratio , which is even lower than the value of 0.01 found to be accessible in the only other high Galactic latitude area investigated to date. This suggests that values as low as might be accessed at high Galactic latitudes. Such low emission values can allow a significant red-shift of the best frequency to detect the CMBP –mode, also reducing the contamination by Galactic dust, and opening interesting perspectives to investigate Inflation models.
keywords:
cosmology: cosmic microwave background – polarization – radio continuum: ISM – diffuse radiation – radiation mechanisms: non-thermal.1 Introduction
The polarization of the Cosmic Microwave Background (CMB) is a powerful probe to investigate the early Universe. Inflation, scalar (density) and tensorial (gravitational waves) primordial perturbations, and formation processes of first stars and galaxies can be effectively studied through its angular power spectra (e.g. Zaldarriaga, Spergel & Seljak 1997; Kinney 1999; Cen 2003). The CMB Polarization (CMBP) can be expanded in a curl-free and a curl component called – and –mode, respectively (Zaldarriaga & Seljak 1997; for an equivalent formalism see Kamionkowski, Kosowsky & Stebbins Kamionkowski et al.1997). These fully describe the polarized emission and have the advantage to be scalar quantities, differently from the Stokes parameters and that are components of a 2-spin tensor.
The emission level of the –mode is a few per cent of the CMB temperature anisotropy signal. First detections have been recently performed (Kovac et al., 2002; Readhead et al., 2004; Barkats et al., 2004; Leitch et al., 2005; Montroy et al., 2005), but a full characterization is far from being completed. On subdegree scales, level and behaviour of the -mode are well predicted by the standard model, provided a number of cosmological parameters are determined (e.g. those of the concordance model after the WMAP data set: Spergel et al. 2003). A precise measurement of the power spectrum thus represents a powerful check of the overall theoretical framework based on both the standard model and the Inflation paradigm.
Foreground noise sources can compete with the cosmic signal and disturb the precise measurements needed for CMBP goals. Estimates of contaminant emissions are then crucial to define the best observing conditions, as the identification of the frequency window in which the cosmic signal is accessible as a function of the sky position. These estimates also allow the determination of the foreground properties, which, in turn, greatly improve the effectiveness of foreground cleaning algorithms (e.g. Tegmark et al. 2000; Tucci et al. 2005; Verde et al. 2005). The diffuse synchrotron emission of the Galaxy is considered one of the most relevant polarization contaminant and is expected to dominate the foreground contribution at frequencies less than 100-GHz. Recent measurements performed in a low emission area at both 1.4 and 2.3-GHz indicate that the synchrotron signal does not represent an obstacle for the –mode at high Galactic latitude and at frequencies higher than 30-GHz (Bernardi et al., 2003; Carretti et al., 2005a, b). However, this is just one sample that may not be representative of the situation throughout high Galactic latitudes and other measurements in different areas are required to confirm this first evaluation.
The second CMBP component, the –mode, is even fainter and no information which can help predict its level are available so far. In fact, within the Inflation paradigm its level on degree scales is related to the amount of primordial tensor perturbations (Gravitational Waves, GW) generated in the early whiles of the Universe by the Inflation event (e.g. see Kamionkowski & Kosowsky 1998; Kinney 1999; Boyle, Steinhardt & Turok 2005). Usually, this GW amount is measured by the tensor-to-scalar perturbation power ratio and only upper limits are available so far (, 95 per cent confidence level: Spergel et al. 2003). The detection of the CMB –mode and the measure of its value are thus fundamental to disentangle among different Inflation models and to measure their relevant parameters (e.g. Kinney 1999). Estimates of the –mode emission of the foreground contaminants (mainly synchrotron and dust emissions of the ISM) are crucial not only to identify clean sky areas, but also to understand the range of Inflation models which can be explored through CMB measurements. The low emission area surveyed by Carretti et al. (2005b) was found promising also for the detection of this CMBP component. In fact, these authors find that models with a GW amount down to should be accessible in that area. However, as for the –mode, this is just one sample of the high Galactic latitude conditions and measurements in other sky areas are needed to check whether this trend is general.
High Galactic latitude fields are promising for CMBP investigations for their low total intensity emission both by ISM synchrotron and dust. Among them, Carretti et al. (2002) identify a couple of wide fields (about ) as observing targets for the BaR-SPOrt experiment (Cortiglioni et al., 2003), one for each of the northern and southern Celestial hemispheres.
An area in the southern field has been observed by Bernardi et al. (2003) and Carretti et al. (2005b), providing the results briefly reported above.
In this paper we present deep 1.4-GHz observations of an area in the northern field. Centred at RA = , Dec = (B1950), the observed area features very high Galactic latitudes ( , ), which should prevent the significant alterations of the polarized emission by Faraday rotation possible at this frequency for –(Carretti et al., 2005a). This leads to estimates of the – and –mode power spectra which can be safely extrapolated to the frequency range relevant for CMB studies.
2 Observations
The observations were done using the Effelsberg 100-m telescope of the Max–Planck–Institut für Radioastronomie (MPIfR) with its primary-focus L-band receiver centred at 1402-MHz. A new 8-channel IF-polarimeter was used, where a 32-MHz wide band was split into eight channels, 4-MHz wide each. An additional 36-MHz wide broad band channel includes the band covered by the MHz channels. The addition of this multi-channel polarimeter allows a more efficient rejection of narrow band interferences and the derivation of the Rotation Measure (RM) of polarized emission. The L-band receiver and its calibration was already described by Uyanıker et al. (1998). The receiver covers a wide frequency range between 1.29-GHz and 1.72-GHz, which, however, has the disadvantage of some cross-talk between the Left– and Right–Handed circular polarization band varying with frequency. By observing several polarized and unpolarized calibration sources for each observing night we found the correction factors for each channel. For each pixel the observed total intensity signal was multiplied by these factors and the result was subtracted from the corresponding and signals. That way residual instrumental polarization was reduced to below 1 per cent of the total intensity. The main calibration source was 3C 286 assuming a flux density of 14.4-Jy and 9.3 per cent of linear polarization at a polarization angle of . The angular resolution at 1402-MHz was found to be 9.35-arcmin and the conversion from the Jy beam-1-scale into the main-beam-temperature-scale is = 2.12 K Jy-1 (Uyanıker et al., 1998).
In a first step we observed a field of centred at RA = , Dec = (B1950) in April 2003. Two coverages were made by scanning the field along orthogonal directions. The total integration time per 4-arcmin pixel was 2-s. This map was checked for a suitable sub-field with a largely uniformly distributed polarized emission as indicative of a small amount of foreground Faraday rotation effects. A field, centred at RA = , Dec = (B1950) – Galactic coordinates , – was selected for deep observations. The integration time per pixel was always 2-s for each coverage. The strong polarized source 3C 247 within the field was used to check the quality of the individual maps, e.g. their scale and pointing accuracy. The observations were completed end of May 2003. The standard data reduction scheme for Effelsberg continuum and polarization observations was applied including baseline corrections of the individual maps by using the unsharp masking procedure described by Sofue & Reich (1979). Five coverages were used (for a total 10-s integration time per pixel), where the data from the wide broad band channel have been used. The five maps were subsequently combined using the PLAIT algorithm as described by Emerson & Gräve (1988), which effectively destripes the maps. The total intensity noise level is set by the confusion limit of about 7 mJy beam-1 or 15-mK of brightness temperature (Uyanıker et al., 1999) of the Effelsberg 100-m telescope. The and maps are not confusion limited for an integration time of 10-s. We obtain rms-noise values of about 2-mK per pixel. The main observation features are summarized in Table 1.
| Central frequency | 1402-MHz |
|---|---|
| Effective bandwidth | -MHz |
| FWHM | -arcmin |
| RA (B1950) | |
| Dec (B1950) | |
| Area size | |
| Pixel size | |
| Observation period | May 2003 |
| , pixel sensitivity (flux) | 0.9 mJy beam-1 |
| , pixel sensitivity () | 2.0-mK |
| Gain /S | 2.12 K Jy-1 |
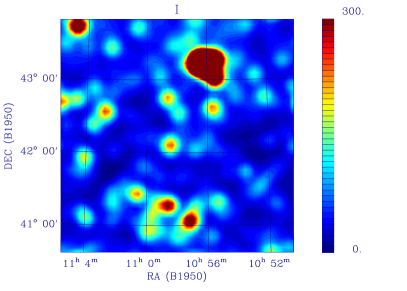
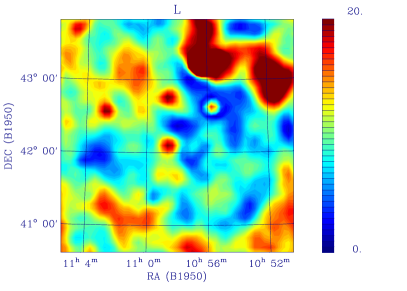
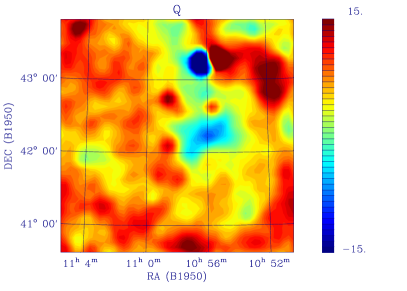
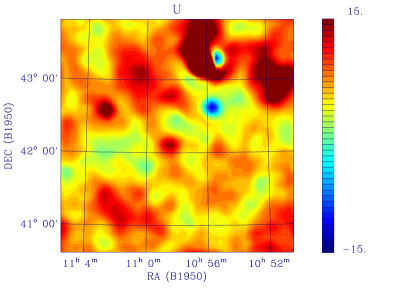
The Stokes , , and linearly polarized intensity () images are displayed in Figure 1, where they have been smoothed to a Full Width at Half Maximum (FWHM) of 11.0-arcmin.
The field is dominated by the strong source 3C 247 both in total and polarized intensity (2.9-Jy of total flux, 4.9 per cent of polarization fraction and of polarization angle). The rest of the image is dominated by point sources and no evidence of diffuse emission is found on the scales accessible to these observations.
The polarization images are dominated by diffuse emission and just few point sources are evident. Structures are present on all angular scales up to the field size, like the feature extending close to the southern border of the field. Excluding the evident point sources, the polarized intensity peaks at about 25-mK and features an rms fluctuation of about 6-mK. The polarization angle pattern has a regular behaviour (Figure 2).

No peculiar canal-like feature are visible in our images, as frequently seen in Galactic plane survey maps (as long filaments with polarized intensity near zero, e.g. see Uyanıker et al. 1999; Haverkorn, Katgert & de Bruyn 2004). An estimate of the RM throughout the field can be attempted thanks to our multi–band data. However, even smoothing the signal on a 15-arcmin scale to improve the signal-to-noise ratio, we achieve a mean rms-error of 50 rad m-2. At this limit, we do not find any significant result, in agreement with the values of 10–20 rad m-2 expected at these Galactic latitudes (e.g. see Han et al. 1997).
A direct comparison with the low emission area observed in the southern hemisphere at the same frequency (Bernardi et al., 2003) is difficult because of the different angular scales covered. Performed with the Australia Telescope Compact Array (ATCA), the observations of these authors have full sensitivity in the 3–15 arcmin range, which only allows a small overlap. A more appropriate analysis is done in Section 3 through angular power spectra, which can compare specific angular scales.
Finally, polarized point sources have been subtracted. To identify them, we fit the maxima/minima in and maps with a 2D-Gaussian beam and a constant value. The latter is adopted to account for the background emission.
3 Power Spectrum Analysis
The angular behaviour of polarized emission can be studied using the angular power spectra of – and –modes. Besides fully describing the statistical properties of the polarized emission with the additional advantage to be scalar, these spectra are the quantities predicted by the cosmological models and allow a direct comparison with the expected cosmic signal.
To study the properties of the diffuse synchrotron emission we use the images cleaned from point sources. The spectra are computed by using the Fourier method of Seljak (1997) and the results are shown in Figure 3. The correction by the beam window function allows us to measure the spectra up to , a value slightly larger than the multipole corresponding to the FWHM (). As typical of the polarized synchrotron emission, both the – and –mode spectrum are well approximated by power laws. Best fits to equation
| (1) |
as functions of the multipole 111The multipole is related to the angular scale by the relation are reported in Figure 3 and Table 2.


| Spectrum | [ K2] | |
|---|---|---|
The slopes and are compatible with the value of () typical of other sky areas when the Faraday rotation does not strongly modify the polarized emission structure (Bruscoli et al., 2002; Carretti et al., 2005a).
A comparison with the spectra of the southern deep field observed with the ATCA at the same frequency (Bernardi et al., 2003; Carretti et al., 2005a) can be done in the 800–1400 –range, which is common to the two observations (Figure 3). We find that the emission of the northern area is fainter by a factor .
However, this comparison could not be reliable because of Faraday rotation effects. Carretti et al. (2005a) find that a power transfer from large to small angular scales occurs, as the Faraday rotation is strongly modifying the emission pattern. This results both in a steeper slope and power enhancement of the power spectrum on subdegree scales. In addition, these authors find that a transition region separates latitudes with strong and negligible Faraday rotation effects at 1.4-GHz. In fact, modifications of the polarized emission look negligible at Galactic latitude –. This is also supported by the new 1.4 GHz maps of Wolleben et al. (2005), who imaged the northern sky with an angular resolution of 36 arcmin and a pixel sensitivity of 12 mK. Their maps show the signal is almost depolarized at – with just a patchy structure on scales smaller than few degrees. Beyond a transition region the emission looks smooth at –, again suggesting a negligible Faraday rotation action above these latitudes.
The application of these considerations to the Effelsberg area suggests the spectra of this patch are not significantly modified. In fact, the flat slopes and found here indicate no relevant action by Faraday effects, also supported by the Galactic location at , that is above the transition region at –. The regular pattern of the position angles further confirms this framework.
Carretti et al. (2005b) find a different situation in the southern area. After comparison with 2.3 GHz data taken in the same area, the 1.4 GHz power spectra are found to be modified. For instance, they show power enhancement and slope steepening (even though the latter is marginal).
The enhancement of the southern area could explain at least part of the power gap between the two fields, and makes unreliable a direct comparison at this frequency.
A more reliable comparison can be done using the 2.3-GHz emission of the southern area (Carretti et al., 2005b), although with the uncertainty due to the different frequencies. In addition, the 2.3-GHz Parkes data (single-dish observations of a patch with a FWHM of 8.8-arcmin) cover an -range similar to the Effelsberg one. The comparison is shown in Figure 4 where the spectra of Table 2 are scaled up to the 2.332-GHz frequency of the Parkes observations assuming an spectral slope, as typical of the synchrotron emission at such frequencies (Platania et al., 1998).


Differences are still present on smallest angular scales in the –mode, although the two spectra converge to similar values on largest scales, where they look very similar. The –mode emission observed with the Effelsberg telescope, instead, still remains fainter than that of the southern area throughout the -range surveyed by the two observations. The northern region thus results even more promising than the southern one to search for the CMBP signal, especially the –mode.
4 discussion
In Section 3 we find indications that the Effelsberg area should not be affected by significant Faraday rotation effects. Therefore, it is likely that the power spectra we find are not significantly modified and can be safely scaled up to the CMBP frequency range. It is worth noting that, in any case, Faraday effects would enhance the power on these angular scales. Therefore, our results would be an upper limit of the real synchrotron emission, providing us with a worst case analysis of the contamination of the CMB by this foreground.
Extrapolations have been performed assuming the brightness temperature frequency slope typical of the synchrotron emission in the 1.4–23 GHz range (Bernardi et al., 2004). Considering that Bennett et al. (2003) find a continuous steepening of this slope from K (23-GHz) to W band (94-GHz), our assumption should provide worst case estimates when applied to the 30–90 GHz range. Brightness temperatures are converted into CMB thermodynamic temperatures by the factor
| (2) |
where is the frequency and K (Mather et al., 1999).
Figure 5 reports the –mode spectrum extrapolated to 32-GHz, which is the lower frequency of the BaR-SPOrt experiment and at the low end of the frequency range relevant for CMBP aims [both the DASI (Leitch et al., 2005) and CBI experiment (Readhead et al., 2004) observed in such a band]. The synchrotron contribution is well below the cosmic component throughout the peak region (–1500). Even the low out-of-horizon feature at looks well accessible.
A comparison with the southern region is done using the 2.3-GHz data taken in that area, more reliable for extrapolation than the 1.4-GHz ones. The contamination in the two areas look similar, apart from lower values of the northern one on smallest scales, so that our results substantially confirm the conclusions of Carretti et al. (2005b). This result is also supported by the analyses of both the DASI and CBI experiment teams, who find indications that, in other two regions, the emission of this foreground is not dominant at 30-GHz. This scenario suggests the detectability of CMBP –mode is achievable at high Galactic latitudes even in the Ka-band.


Figure 6 reports the –mode spectrum extrapolated to 90-GHz, that is in the frequency range expected to be the best trade-off between Galactic synchrotron and dust contamination. Even though the peak near (angular scale ) is marginally accessible by our data, the result is very promising. The comparison with the expected CMBP signal for different values suggests that the properties of Inflation models with a GW amount as low as can be explored here, when only the synchrotron contribution is considered. This result is even better than the one obtained in the southern region, where values down to 0.01 were estimated to be accessible.
As already pointed out by Carretti et al. (2005b), this low level of the polarized synchrotron emission can make the ISM dust the major contaminant of CMBP at 90–100 GHz. No estimate of the polarized dust emission is available in our region, and a real comparison is not possible. However, we can attempt a comparison using the existing data. The most proper one for our area would be the upper limit obtained by Ponthieu et al. (2005) with the data of the ARCHEOPS experiment, our area being included in the sky region they surveyed. However, their result looks too pessimistic to be applied to our low emission area. In fact, besides being an upper limit, it refers to the whole portion of the region mapped by that experiment. Moreover, the value they provided (0.2-K2 at 100-GHz) is much higher than the upper limit deduced by Carretti et al. (2005b) relative to a large high Galactic latitude area. Instead, we prefer to use the dust total intensity measurements recently obtained at high Galactic latitudes in the area surveyed with the 2003 BOOMERanG experiment (Masi et al., 2005). They also find that the dust emission in that area is representative of a large fraction of the high latitude sky (40 per cent of the sky). As polarization fraction we consider both 5 and 20 per cent, which brackets the 10 per cent deduced by Benoît et al. (2004) for the high Galactic latitudes.
The frequency behaviours are plotted in Figure 7, where the quantity at is used as good indicator of the emission on the scale of the –mode peak. The dust actually looks to be the leading contaminant at 90–100 GHz, even assuming the case of 5 per cent polarization. As a consequence, the best frequency window where the total foreground contamination is minimum can be red-shifted toward GHz, as it happens for the CMB anisotropy (Bennett et al., 2003). To give an idea of the situation at 70-GHz, Figure 8 shows the synchrotron angular behaviour at such a frequency.
Besides implications for the design of experiments devoted to the CMBP -mode, such a red-shift implies a reduction of the dust contamination, because of its frequency behaviour. As a result, even considering the dust contribution, it should be possible to study models with , and even lower in case of 5 per cent dust polarization. As mentioned above, this result is even better than that obtained in the other high Galactic latitude area, also reported in Figure 7 for comparison. Although observations in other sky regions are needed, this suggests that the southern area is not a special case, and that the possibility to reach the value estimated to be achievable in the southern area could be extended to large low emission regions at high Galactic latitudes. Foreground cleaning techniques can allow further improvements of the measurable (e.g. Tegmark et al. 2000; Tucci et al. 2005; Verde et al. 2005) opening wide possibilities in the explorable Inflation models, especially in view of the recent results of Boyle et al. (2005). In fact, these authors find that the interesting class of Inflation models with minimal fine-tuning have . Only models with an high degree of fine-tuning can have values less than 0.001. Thus, perspectives to detect the -mode in large low emission areas at high Galactic latitudes become realistic. However, a better assessment of the scenario requires direct measures of the polarized dust emission, possibly at higher frequency (hundreds of GHz) where this Galactic component is stronger.
Acknowledgments
This work has been carried out in the framework of the BaR-SPOrt experiment, a programme funded by ASI (Agenzia Spaziale Italiana). The paper is based on observations with the 100-m telescope of the MPIfR (Max-Planck-Institut für Radioastronomie) at Effelsberg. We like to thank an anonymous referee for useful comments, and O. Lochner for technical support with the 8-channel polarization measurements. We acknowledge the use of the CMBFAST package.


References
- Barkats et al. (2004) Barkats D., et al., 2004, ApJ, 619, L127
- Bennett et al. (2003) Bennett C.L., et al., 2003, ApJS, 148, 97
- Benoît et al. (2004) Benoît A., et al., 2004, A&A, 424, 571
- Bernardi et al. (2003) Bernardi G., Carretti E., Cortiglioni S., Sault R.J., Kesteven M.J., Poppi S., 2003, ApJ, 594, L5
- Bernardi et al. (2004) Bernardi G., Carretti E., Fabbri R., Sbarra C., Cortiglioni S., Poppi S., Jonas J.L., 2004, MNRAS, 351, 436
- Boyle et al. (2005) Boyle L.A., Steinhardt P.J., Turok N., 2005, astro-ph/0507455
- Bruscoli et al. (2002) Bruscoli M., Tucci M., Natale V., Carretti E., Fabbri R., Sbarra C., Cortiglioni S., 2002, New Astron., 7, 171
- Carretti et al. (2002) Carretti E., et al., 2002, in Experimental Cosmology at Millimetre Wavelengths, AIP Conf. Proc., 616, 140
- Carretti et al. (2005a) Carretti E., Bernardi G., Sault R.J., Cortiglioni S., Poppi S., 2005a, MNRAS, 358, 1
- Carretti et al. (2005b) Carretti E., McConnel D., McClure-Griffiths N. M., Bernardi G., Cortiglioni S., Poppi S., 2005b, MNRAS, 360, L10
- Cen (2003) Cen R., 2003, ApJ, 591, 12
- Cortiglioni et al. (2003) Cortiglioni S., et al., 2003, in Warmbein B., ed., 16th ESA Symposium on European Rocket and Balloon Programmes and Related Research, ESA Proc. SP-530, p. 271
- Emerson & Gräve (1988) Emerson D.T., Gräve R., 1988, A&A 190, 353
- Han et al. (1997) Han J.L., Manchester R.N., Berkhuijsen E.M., Beck R., 1997, A&A, 322, 98
- Haverkorn, Katgert & de Bruyn (2004) Haverkorn M., Katgert P., de Bruyn A.G., 2004, A&A, 427, 549
- Kamionkowski & Kosowsky (1998) Kamionkowski M., Kosowsky A., 1998, Phys. Rev. D, 57, 685
- (17) Kamionkowski M., Kosowsky A., Stebbins A., 1997, Phys. Rev. Lett., 78, 2058
- Kovac et al. (2002) Kovac J.M., et al., 2002, Nature, 420, 772
- Kinney (1999) Kinney W. H., 1999, Phys. Rev. D, 58, id. 123506
- Leitch et al. (2005) Leitch E.M., Kovac J.M., Halverson N.W., Carlstrom J.E., Pryke C., Smith M.W.E., 2005, ApJ, 624, 10
- Masi et al. (2005) Masi S., et al., 2005, A&A, submitted, astro-ph/0507509
- Mather et al. (1999) Mather J.C., Fixsen D.J., Shafer R.A., Mosier C., Wilkinson D.T., 1999, ApJ, 512, 511
- Montroy et al. (2005) Montroy T.E., 2005, ApJ, submitted, astro-ph/0507514
- Platania et al. (1998) Platania P., Bensadoun M., Bersanelli M., de Amici G., Kogut A., Levin S., Maino D., Smoot G.F., 1998, ApJ, 505, 473
- Ponthieu et al. (2005) Ponthieu N., et al., 2005, A&A, submitted, astro-ph/0501427
- Readhead et al. (2004) Readhead A.C.S., et al., 2004, Science, 306, 836
- Seljak (1997) Seljak U., 1997, ApJ, 482, 6
- Sofue & Reich (1979) Sofue Y., Reich W., 1979, A&AS 38, 251
- Spergel et al. (2003) Spergel D.N., et al., 2003, ApJS, 148, 175
- Tegmark et al. (2000) Tegmark M., Eisenstein D.J., Hu W., de Oliveira–Costa A., 2000, ApJ, 530, 133
- Uyanıker et al. (1998) Uyanıker B., Fürst E., Reich W., Reich P., Wielebinski R., 1998, A&AS, 132, 401
- Uyanıker et al. (1999) Uyanıker B., Fürst E., Reich W., Reich P., Wielebinski R., 1999, A&AS, 138, 31
- Tucci et al. (2005) Tucci M., Martínez-González E., Vielva P., Delabrouille J., 2005, MNRAS, 360, 935
- Verde et al. (2005) Verde L., Peiris H., Jimenez R., 2005, JCAP, submitted (astro-ph/0506036)
- Wolleben et al. (2005) Wolleben M., Landecker T.L., Reich W., Wielebinski R., A&A, in press, astro-ph/0510456
- Zaldarriaga & Seljak (1997) Zaldarriaga M., Seljak U., 1997, Phys. Rev. D, 55, 1830
- Zaldarriaga, Spergel & Seljak (1997) Zaldarriaga M., Spergel D.N., Seljak U., 1997, ApJ, 488, 1