22email: pau@physics.uoc.gr 33institutetext: GACE, ICMUV, Universidad de Valencia, P.O. Box 22085, E - 46071 Paterna-Valencia, Spain
Correlated X-ray spectral and timing variability of the Be/X-ray binary V0332+53/BQ Cam during a type II outburst
After more than 15 years of quiescence the Be/X-ray binary V0332+53 underwent a giant outburst in December 2004. We have investigated the timing properties of the source in correlation with its spectral states as defined by different positions in the colour-colour diagram. We have used RXTE and INTEGRAL light curves to obtain colour-colour diagrams, power spectra and phase-lag spectra. The power spectra were fitted with a multi-Lorentzian function. The source shows two distinct branches in the colour-colour diagram that resemble those of the sources. The hard branch (similar to the horizontal branch of sources) is characterised by a low-amplitude change of the hard colour compared to the change in the soft colour. In the soft branch (analogue to the normal branch) the amplitude of variability of the hard colour is about three times larger than that of the soft colour. As the count rate decreases the source moves up gradually through the soft to the hard branch. The aperiodic variability (excluding the pulse noise) consists of band-limited noise (represented by three broad Lorentzian components) and two QPOs at 0.05 Hz and 0.22 Hz. The strength of the lower frequency QPO increases as the source approaches the hard branch (similar to HBOs in sources). The higher frequency QPO reaches maximum significance when the source is in the middle of the branch (like NBOs). We have performed the first measurements of phase lags in the band limited noise below 8 Hz in an accreting X-ray pulsar and found that soft lags dominate at high frequencies. Above the pulse frequency (0.23 Hz), the amplitude of the lag increases as the X-ray flux increases. The topology appears to be a signature of the neutron star binaries as it is present in all types of neutron-star binaries (, atoll and, as we show here, in accreting pulsars as well). However, the motion along this track, the time scales through the different branches of the diagram and the aperiodic variability associated with portions of the Z track differ for each subclass of neutron-star binary.
Key Words.:
stars: individual: V0332+54, BQ Cam – X-rays: binaries – stars: neutron – stars: binaries close –stars: emission line, Be1 Introduction
V0332+53 is a hard X-ray transient, accreting X-ray pulsar and Be/X-ray binary that spends most of its life in a quiescent X-ray state. This quiescent state is occasionally interrupted by sudden increases of the X-ray flux in which the source reaches Eddington luminosities. V0332+53 was discovered during one of these large outbursts in 1973 by the Vela 5B satellite (Terrell & Priedhorsky 1984; Whitlock 1989). The outburst lasted for about 100 days and reached 1.4 Crab, or erg s-1 in the 3-12 keV energy range, assuming a distance of 7 kpc (Negueruela et al. 1999). V0332+53 reappeared in 1983 (Tanaka 1983) in the form of three small outbursts. EXOSAT observations of this activity period resulted in the discovery of X-ray pulsations with s and the determination of the orbital parameters, d and (Stella et al. 1985). Ginga detected V0332+53 again in 1989 with a peak flux of 0.4 Crab (1-20 keV). The analysis of this new outburst with improved technology allowed the discovery of a cyclotron resonant scattering feature at 28.5 keV (Makishima et al. 1990) and QPOs at 0.051 Hz (Takeshima et al. 1994). The last outburst took place in 2004 with a peak intensity in the 1.3-12.1 keV range of 1.1 Crab (Swank et al. 2004; Remillard 2004). INTEGRAL observations provided the first broad-band spectrum (5-100 keV) and detected three cyclotron lines (Kreykenbohm et al. 2005). Using RXTE observations obtained during the 2004 outburst, Zhang et al. (2005) refined the orbital parameters of the system and Qu et al. (2005) reported the discovery of a new QPO at 0.22 Hz.
The optical counterpart to V0332+53 is an O8-9Ve star at a distance of kpc, showing H in emission and strong and variable infrared emission (Bernacca et al. 1984; Corbet et al. 1986; Coe et al. 1987; Negueruela et al. 1999).
In this work we have analysed data from the JEM-X INTEGRAL and the PCA RXTE instruments during the last large 2004 outburst. Our aim is to perform a correlated timing an spectral analysis of the X-ray emission as the outburst decayed.
2 Observations and data analysis
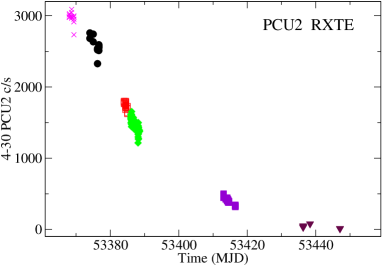
We have used data from the space missions Rossi X-ray timing Explorer (RXTE) and the INTErnational Gamma-ray Astrophysics Laboratory (INTEGRAL). The RXTE data correspond to public Target of Opportunity (TOO) observations performed between December 28, 2004 and March 17, 2005 (MJD 53368.24–53447.06). Given the high count rate and the fact that the PCU number 2 was on all the time we used data from this detector only. Data reduction was performed with FTOOLS v5.3.1. The total RXTE on-source time amounted to 113 ks.
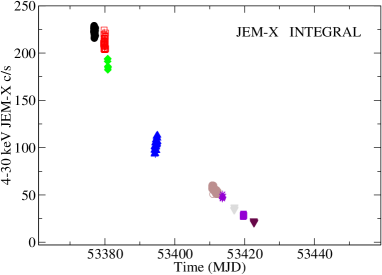
The INTEGRAL data were retrieved from the public archive and correspond to the Target of Opportunity (TOO) observations performed between January 5, 2005 and February 21, 2005 (MJD 53376.27–53422.05). We analysed JEM-X data for a total observing time of 338 ks, divided in 105 pointings (Science Windows) in revolutions 273–274, 278, 284–288. Data reduction was carried out with the standard Off-line Scientific Analysis (OSA) software version 5.0, available from the INTEGRAL Science Data Centre (ISDC)111http://isdc.unige.ch/index.cgi?Soft+download.
The timing analysis was done with the XRONOS software package v5.21 (Stella & Angelini 1992).
 |
 |
 |
 |
3 Results
3.1 The outburst
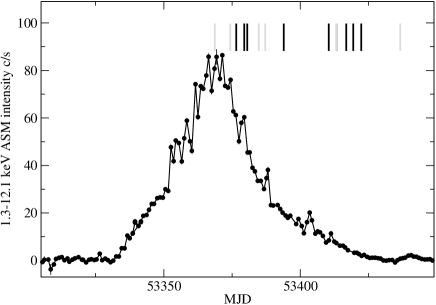
The X-ray outburst began in 2004 November (MJD 53330) and reached maximum flux about one month later ( MJD 53368). While RXTE observations coincided with the peak of the outburst, INTEGRAL observations started in 2005 January 5 (MJD 53376), i.e., a few days after the peak. Given that the observations only covered the decay of the outburst and in order to have a clear picture of the outburst profile we show the RXTE ASM light curve in Fig. 1. The total duration of the outburst was days, of which the INTEGRAL observations covered about 46 days and the RXTE observations the last 80 days (from maximum flux to quiescence). The peak flux, as measured by the ASM (1.3-12.1 keV) was 1.1 Crab (Remillard 2004).
The outburst profile is very symmetric, although the rise is somewhat faster than the decay. The difference appeared, however, at the end of the decay, with the profile displaying a longer tail at the base of the outburst. While a decrease in flux of about 30% is achieved in 5 days at the onset of the decay, such a drop requires 12 days at the end of the decay. Surprisingly, this behaviour contrasts with that observed in A 0535+262 during its June 2005 Type II outburst, where the longer tail was seen at the beginning of the outburst (Coe et al. 2005).
At the beginning of the RXTE observations the 4-30 keV PCU2 count rate was c/s, that is, 1.5 Crab. The intensity of the last observation reported here was 37 c/s, which corresponds to 0.02 Crab. Overall the decrease in flux was a factor 60, from erg cm-2 s-1 to erg cm-2 s-1.
In order to study the evolution of the timing and spectral properties of V0332+53 throughout the decay of the outburst we divided the INTEGRAL and RXTE light curves into several regions. The start time of these regions have been marked with black (INTEGRAL) and grey (RXTE) lines in Fig. 1. Table 1 gives the start and exposure time for each region.
3.2 Colour-colour diagram
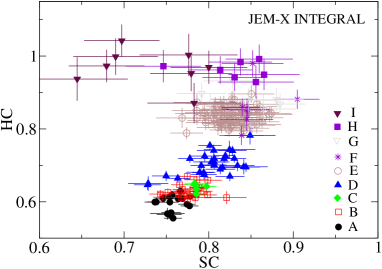
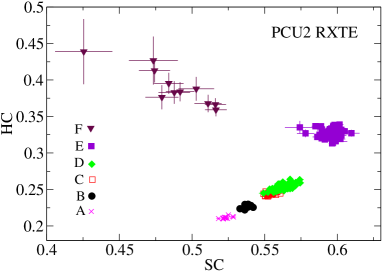
Background-subtracted light curves corresponding to the energy ranges keV, keV, keV and keV were used to define the soft colour (SC) as the ratio and the hard colour (HC) as the ratio between . The colour-colour diagram (CD) of V0332+53 was then constructed by plotting the hard colour as function of the soft colour (Fig. 2).
At the peak of the outburst the source was in a soft state. As the count rate decreased the source moved up and right in the CD, i.e. it became harder. At the end of the outburst (INTEGRAL regions H and I and RXTE regions E and F) the source moved to the left, that is, toward lower values of SC with little variation in the HC. Two spectral states or branches can be distinguished in the CD: a soft state that corresponds to higher count rates and a hard state that includes points with lower count rates. In the soft branch, the main parameter driving the spectral variability is the hard colour: while the HC changes by about 45%, the SC changes by about 15%. In the hard branch, the variability is more pronounced in the SC.
The pattern traced out in the CD by V0332+53 resembles that of the low-mass sources (see e.g van der Klis 1995), with the soft branch being the analogue to the normal branch and the hard branch being the counterpart of the horizontal branch. The flaring branch would be missing in V0332+53. As in Z sources, the hardest spectrum corresponds to a lower count rate state. Also, the source moves gradually through the different branches without jumps. The source took about 80 days to go from the softest point of the soft branch to the hardest point of the hard branch.
| Reg. | Start time | Exposure | Count | SC | HC | Fluxa,b |
| MJD | time (ks) | ratea | ||||
| INTEGRAL data | ||||||
| A | 53376.27 | 32.842 | 229 | 0.76 | 0.60 | 4.3 |
| B | 53379.06 | 42.656 | 216 | 0.77 | 0.63 | 4.2 |
| C | 53380.22 | 10.504 | 194 | 0.79 | 0.64 | 3.9 |
| D | 53393.64 | 52.193 | 104 | 0.80 | 0.70 | 2.1 |
| E | 53410.14 | 138.368 | 53 | 0.83 | 0.84 | 1.1 |
| F | 53413.07 | 13.316 | 46 | 0.85 | 0.86 | 0.9 |
| G | 53416.45 | 15.403 | 33 | 0.85 | 0.88 | 0.6 |
| H | 53419.05 | 14.725 | 23 | 0.84 | 0.96 | 0.4 |
| I | 53422.05 | 17.900 | 14 | 0.74 | 0.95 | 0.3 |
| RXTE data | ||||||
| A | 53368.24 | 6.688 | 2974 | 0.52 | 0.21 | 5.3 |
| B | 53374.03 | 5.520 | 2566 | 0.54 | 0.23 | 4.8 |
| C | 53384.36 | 14.928 | 1742 | 0.55 | 0.24 | 3.4 |
| D | 53386.86 | 41.984 | 1464 | 0.56 | 0.25 | 2.9 |
| E | 53413.06 | 38.608 | 406 | 0.60 | 0.31 | 0.9 |
| F | 53436.30 | 5.120 | 37 | 0.48 | 0.40 | 0.09 |
| : background subtracted 4-30 keV | ||||||
| : erg cm-2 s-1 | ||||||
| Region | /dof | |||||
| Central frequency (Hz) | ||||||
| A | 0 | 0.05 | … | 1.2/24 | ||
| B | 0 | 0.05 | … | 1.7/24 | ||
| C | 0 | … | 1.2/21 | |||
| D | 0 | … | 2.0/24 | |||
| E | 0 | … | 2.3/20 | |||
| F | 0 | … | … | 0.8/26 | ||
| Quality factor () | ||||||
| A | … | 0.1 | … | 2.1 | … | |
| B | … | 0.2 | … | 4.6 | … | |
| C | … | 0.4 | 0.8 | 1.2 | … | |
| D | … | 0.4 | 1.0 | 1.8 | … | |
| E | … | 0.5 | 1.2 | … | 0.3 | |
| F | … | 0.8 | … | … | 0.7 | |
| Fractional | ||||||
| A | … | |||||
| B | … | |||||
| C | … | |||||
| D | … | |||||
| E | … | |||||
| F | … | … | ||||
3.3 Power spectral analysis
In order to investigate the aperiodic variability of V0332+53 in relation with its spectral state we divided the CD into six regions and calculated power spectra for each region. The power spectra were obtained by dividing the 0.125-s resolution PCA light curves into 256-s segments and calculating the Fast Fourier Transform (FFT) of each segment. We obtained a mean power spectrum for each region by taking the average over the segments included in the region. See Table 1 to find the average values of the colours and intensity of each region. The power was normalised such that the integral gives the squared fractional variability. Given the superior quality, in terms of the signal-to-noise ratio, and the longer outburst coverage of the RXTE observations we only used RXTE data in the timing analysis.
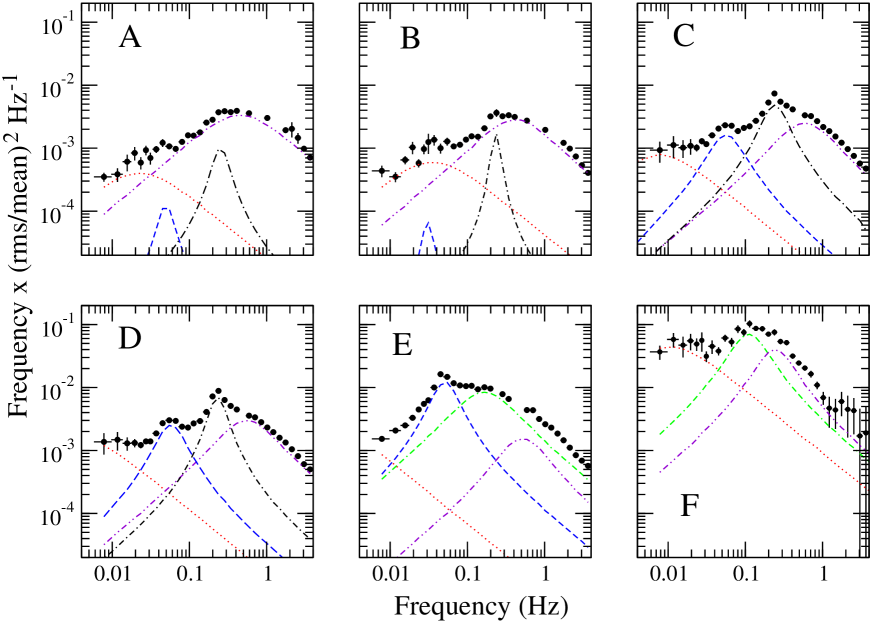
Figure 3 shows the power spectra associated with different positions in the CD. In order to fit the power spectra we followed the approach commonly employed recently for low-mass neutron-star and black-hole systems of using Lorentzian functions only (Nowak 2000; Belloni et al. 2002; van Straaten et al. 2002). Note that with the FrequencyPower representation used in Fig. 3, the central frequency, , of the Lorentzian function and the frequency at which the Lorentzian reaches maximum power, , do not coincide but are related by , where is the Lorentzian half-width at half-maximum.
The study of the aperiodic variability in V0332+53 is hampered by the presence of very narrow peaks in the power spectra. These spikes correspond to the spin period of the system. V0332+53 is an X-ray pulsar with s, which corresponds to a frequency of 0.228 Hz. This peak and up to four harmonics can be seen in the power spectra (see Fig. 6 or Qu et al. 2005). For the sake of clarity we deleted the peaks of the spin period and its harmonics in Fig. 3. Here we are interested in the aperiodic variability of V0332+53 only, that is, in the evolution of the broad-band noise and QPOs as the outburst decays. The coherence pulsation and its harmonics where fitted with narrow Lorentzians. The fundamental and the first two harmonics normally occupy one frequency bin. The third and fourth harmonic may not be resolved in some of the power spectra.
In addition to the pulse noise, the power spectra of V0332+53 contains band-limited noise (that may turn into peaked noise) and QPO noise. The band-limited noise is represented by three broad components that we shall call very-low frequency noise (), low-frequency noise () and high-frequency noise (). The QPO noise consists of two components at 0.05 Hz () and 0.22 Hz (). Only four Lorentzians (excluding the pulse noise) are present at any given time, though. is a zero-centred Lorentzian and describes the noise below Hz. and are present both, in the high/soft state (HSS) and in the low/hard state (LHS), while is exclusive of the LHS. In the LHS the QPOs are absent.
Table 2 gives the results for the power spectral fitting procedure.
3.3.1 Noise in the high/soft state (HSS)
The soft branch comprises the intervals A-B-C-D. Interval E can be considered as a transition state between the HSS and the LHS. It would correspond to the so-called apex in sources. As the flux decreases the of increases, (from 5% in region A to 12% in region E), while the of shows an overall decreasing trend. QPO noise is present throughout the decay of the outburst but reaches its maximum significance at intermediate fluxes. A QPO, i.e., peaked noise with a quality factor , centred at 0.2 Hz is weakly present in regions A and B and reaches maximum strength in region C and D. A second QPO at 0.05 Hz emerges in region C (it is only marginally present in regions A and B) and increases its power as the flux decreases, reaching maximum strength in region E with a fractional of 13%. The central frequencies of these QPOs do not change significantly. Note also, that the best-fit spectral parameters of the 0.22 HZ QPO given in Table 2 might be affected by the coupling of the QPO and the spin period components.
3.3.2 Noise in the low/hard state (LHS)
The study of the aperiodic variability in the hard branch is hampered by low statistics. The hard branch correspond to the lower count rates and it is reached when the 3-40 keV flux goes below erg cm-2 s-1 ( erg s-1). The overall 0.01-1 Hz fractional amplitude in the LHS is considerably larger than in the HSS. in region F is %, compared to, for example, region C where %.
The 0.22 Hz QPO () that characterised the HSS disappears in the LHS. The 0.05 Hz QPO () is still present in region E but not in region F. Instead, a new peaked noise component shows up, namely , which occupies the place left by the QPO noise. It first appears in interval E, but becomes very strong in interval F. , which during the HSS had , becomes narrower in the LHS, with . The pulse noise is highly suppressed, which may be a consequence of the overall increase in the strength of the continuum.

3.4 Phase-lag spectra
Since the power spectra has the disadvantage of ignoring phase information, we also calculated the cross spectrum between two concurrent light curves with different energies. If and are two such light curves and and denote their Fourier transform, then the power spectra of these light curves are respectively and , while the cross spectrum is defined as . The indicates the complex conjugate. The Fourier phase lag is the phase, i.e. the argument, of the complex quantity . We obtained a mean phase-lag spectrum for each region of the CD (Fig. 4). The lags were calculated between the 7-20 keV photons (hard band) with respect to 2-7 keV photons (soft band).
Although the phase-lag behaviour of V0332+53 as the outbursts decays is rather complex, showing both, positive (hard photons lag soft photons) and negative lags (vice versa), soft lags dominate at high frequencies. Below 0.1 Hz, no lags seem to be present. As in low-mass neutron-star and black-hole binaries, it is the phase lags, and not the time lags, that are roughly constant with Fourier frequency.
Figure 5 shows the average time lag as a function of the 4-30 keV flux for four frequency ranges. Two significant results can be drawn: i) since the phase lags are constant, the average amplitude of the time lags decreases with frequency and ii) at frequencies above the spin frequency the amplitude of the lags increases as the X-ray flux increases, i.e., as the source becomes softer (the hard colour decreases). At lower frequencies the lags do not show any particular trend.
4 Discussion
The X-ray behaviour of transient Be/X-ray binaries is characterised by two types of outbursting activity: i) Type I outbursts are regular and (quasi)periodic, normally peaking at or close to periastron passage of the neutron star. The X-ray flux increases by about one order of magnitude with respect to the pre-outburst state, reaching erg s-1, ii) Type II are unexpected giant outbursts with increases in luminosity of . They tend to last for several orbits and not necessarily coincide with periastron passage.
Although aperiodic variability studies of HMXBs have been carried out in the past (Belloni & Hasinger 1990), this is the first time that the aperiodic variability of a Be/X-ray binary has been systematically studied in correlation with the spectral evolution in the CD during a type II outburst. For a discussion on the origin of the QPOs and the variation of their spectral parameters with flux during this same outburst the reader is referred to Qu et al. (2005).
4.1 Comparison with low-mass X-ray binaries
Two spectral states can be distinguished in the colour-colour diagram (CD): a hard branch that corresponds to a low-intensity state (LHS) and a soft branch that corresponds to a high-intensity state (HSS). The hard branch is characterised by a low-amplitude change of the hard colour compared to the change in the soft colour. In the soft branch the amplitude of variability of the hard colour is about three times larger than that of the soft colour. The result is a pattern in the CD that resembles that of the sources. Like in sources the source moves gradually in the CD without jumps. However, there are also some differences which mainly affect the typical time scales and X-ray flux variations. Z sources trace out the Z track on time scales of hours to a day, while the motion of V0332+53 in the CD is of the order of (tens of) days. Also, the amplitude of the X-ray luminosity change over the Z track is typically less than a factor of 2 (di Salvo et al. 2000, 2002) while the X-ray luminosity changes throughout the CD of V0332+53 are about a factor 60.
In addition to the noise due to the X-ray pulsations we have identified three broad noise components and two QPOs in the 1/256–4 Hz power spectra of V0332+53. The QPO noise is somewhat reminiscent of the horizontal (HBO) and normal branch (NBO) oscillations in Z sources: the 0.05 Hz QPO, being only present near the hard branch or LHS (analogue to the ”horizontal branch”), would correspond to the HBO. The 0.2 Hz QPO, whose frequency is independent of the position in the soft branch or HSS (analogue to the ”normal branch”) and it is strongest in the middle of it, would be the counterpart to the NBO. Also, as in sources, the LFN is very weak or absent in the HSS (”normal branch”) but very strong in the LHS (”horizontal branch”). Note, however, that although we have designated these components with the traditional names used in sources, namely, very-low (VLFN), low (LFN) and high-frequency noise (HFN), the time scales involved in V0332+53 are much longer than in sources. In particular, the central frequency of the LFQPO is three orders of magnitudes lower than typical values of HBOs, and the central frequency of the HFQPO is one order of magnitude lower than NBO values. Other difference between V0332+53 and sources is the variation of the amplitude of the VLFN. In sources it decreases as the source approaches the horizontal branch, while in V0332+53 the opposite is seen.
It has been found (Muno et al. 2002; Gierlinski & Done 2002) that low-mass neutron-star atoll sources that display large amplitude intensity variations () also trace out three-branch patterns in the colour-colour diagram similar to those of Z sources. However, the analysis of the rapid aperiodic variability in relation to the different regions of the colour-colour diagram and the actual time scales of the motion of the source through the diagram have revealed very different behaviour between atoll and sources (van Straaten et al. 2003; Reig et al. 2004). Here we find a similar result in a high-mass X-ray binary, namely, the source shows a track in the CD but the details of the motion in this track and time scales involved differ from those of low-mass sources. It seems that the topology might be a signature of the presence of a neutron star (hard surface) and that the details of the behaviour along this track depend on other factors like the type of optical companion, strength of the magnetic field or mass transfer mechanism and deposition.
Due to the transient nature of V0332+53, the unpredictability of type II outbursts and operational constraints, the observations (both RXTE and INTEGRAL) covered the decay of the outburst only. It would be very interesting to study the transition from low-intensity to high-intensity states and whether the source follow the reverse path in the CD or there is some degree of hysteresis (i.e., the fact that the transition between states in one direction does not occur for the same value of the spectral and timing parameters as in the reverse direction) as have been seen in low-mass atoll sources (e.g. Reig et al. 2004) and BHC (e.g Belloni et al. 2005). Note that hysteresis is not present in sources.


4.2 Coupling of the periodic and aperiodic noise components
Lazzati & Stella (1997) investigated the relationship between the periodic and aperiodic variability in three accreting X-ray pulsars and found that a highly significant coupling is present. These authors used a shot noise model to account for the aperiodic component and argued that if the shots represent inhomogeneities in the accretion flow (blobs or clumps of matter) and are produced close to the neutron star surface then they should be also modulated by the same mechanism that gives rise to the periodic signal. This coupling manifests itself by the broadening of the wings of the narrow peaks due to the periodic modulation and becomes more apparent when the red-noise power increases short-ward of the pulsar frequency. The width of the wings are strongly dependent of the ratio of the pulsar period to the characteristic decay time of the shots . If then the wings are so broad that they become indistinguishable from the power spectra continuum.
The 0.22 Hz QPO detected in V0332+53 constitutes the first detection of a QPO riding on the spin frequency of a neutron star (Qu et al. 2005) and points toward a strong coupling between the periodic and red-noise components. Figure 6 shows the power spectra of V0332+53 corresponding to various spectral states without the removal of the peaks that result from the spin period and its harmonics. The coupling between the periodic and aperiodic variability is strong during intervals C to E and weak in intervals A and B. Since the spin period does not change substantially, the characteristic decay time of the shots must be significantly smaller at the beginning of the outburst decay. If the shots arise from blobs in the accretion flow, and if the shot life time is associated with the blob size then we conclude that at high luminosities the blobs are smaller than at low luminosities. Maybe the radiation pressure breaks the accretion flow into small discrete clumps of matter. Alternatively, the weak coupling in intervals A and B could be due to the flatter continuum short-ward of the spin frequency (Lazzati & Stella 1997).
4.3 Phase lags
Figure 5 shows the time lags as a function of X-ray flux for four frequency ranges. If we assume the interpretation that each Fourier component is emitted by a specific spatial scale in the accretion flow then the highest frequencies would correspond to the closest distances to the compact object. The different behaviour of the lags depending on the frequency range considered allows us to put some constraints on the size of the accretion column. At high X-ray flux the amplitude of the time lags in the frequency range 1–8 Hz is 3 ms, which measured as light crossing time corresponds to a length of scale of cm or 0.3 magnetospheric radii. We have assumed the radius of the magnetosphere to be cm (see e.g. Frank et al. 1992). As the flux decreases, i.e., as the source spectrum hardens, the magnitude of the lags decreases, which would imply that the X-ray emitting region (presumably the accretion column) reduces its size. At the end of the outburst, close to quiescence, the lag is consistent with zero, which can be interpreted as the disappearance of the accretion column. An increase of the magnitude of the lags (associated with QPO noise) as the flux increases has been also reported for the black-hole system XTE J1550-564 (Cui et al. 2000). Further support in favour of the reduction in size of the accretion column as the source gets fainter is provided by the fact that the cyclotron resonance energy increases during the burst decline (Mowlavi et al. 2006). This is in agreement with Mihara’s model (Mihara et al. 2004) that predicts this behaviour as due to the reduction of the accretion column scale height as a function of source intensity.
At lower frequencies there is not a clear pattern of variability of the lags versus the X-ray flux. In fact, below the frequency that corresponds to the pulse peak, no significant time delays are present in the data for most frequencies. Low frequencies sample photons produced further away from the compact object, perhaps in the region where the accretion flow interacts with the magnetosphere. A time lag of 0.05 s corresponds to a length scale of cm or 5 magnetospheric radii. The lack of significant lags at low frequencies may also indicate that most of the X-ray radiation is produced in the vicinity of the neutron star.
The phase-lag spectra of neutron-star (Ford et al. 1999; Olive & Barret 2001) and Galactic black-holes binaries (Nowak et al. 1999; Wijnands et al. 1999) are very similar but incompatible with the assumption of a lag constant in time as predicted by Comptonisation in a uniform medium. Instead, observations show the phase lag to be roughly independent of Fourier frequency. The same result is now seen in the accreting X-ray pulsar V0332+53. In V0332+53, however, soft lags dominate the 0.1-10 Hz phase-lag spectra. Soft lags are not a rare phenomenon. They have been observed in neutron-star (Qu et al. 2004) and black-hole systems (Wijnands et al. 1999; Cui et al. 2000; Lin et al. 2000; Reig et al. 2000). While models based on Comptonisation of low-energy photons in a non-uniform corona can reproduce the amplitude and energy dependence of the hard lags the change in sign of the lags are hard to explain by invoking light-travel time differences between photons at different energies (but see Ohkawa et al. 2005). Recently, Varnière (2005) has proposed that partial absorption (related to the jet mechanism) of the signal can account for the phase lag reversal in microquasars. Since X-ray pulsars do not show radio jets, other mechanisms producing the absorption of the soft/low-energy X-rays must be at work if the phase lag behaviour of V0332+53 is to be explained with this model.
5 Conclusion
The study of the evolution of the X-ray colours of the high-mass X-ray pulsar V0332+53 through the decay of a type II outburst has shown that these type of systems can also trace out -shaped pattern in the colour-colour diagram, like its low-mass cousins, making this feature a possible signature of the presence of a neutron star. While colour-colour diagrams may represent a useful tool for the detection of spectral states, they cannot unveil the true nature of the source. Analysis of the rapid aperiodic variability, allowing the study of the noise components in different regions of the colour-colour diagram and the actual time scales of the motion of the source through the diagram, is crucial to identify source type and state. Unlike black-hole binaries and atoll sources but similarly to the source GX 5–1, the phase-lag spectra of the noise below 10 Hz in V0332+53 are dominated by soft lags. We conclude then that although the mechanism responsible for the lags does not depend on the presence or absence of a hard surface it may be affected by the magnetic field, which in turn may dictate the geometry of the accretion flow, that is, whether an accretion column is formed.
Acknowledgements.
This research has made use of NASA’s Astrophysics Data System Bibliographic Services and of the SIMBAD database, operated at the CDS, Strasbourg, France. The ASM light curve was obtained from the definitive results provided by the ASM/RXTE team.References
- Belloni & Hasinger (1990) Belloni, T., & Hasinger, G. 1990, A&A, 230, 103
- Belloni et al. (2002) Belloni, T., Psaltis, D. & van der Klis, M. 2002, ApJ, 572, 392
- Belloni et al. (2005) Belloni, T., Homan, J., Casella, P. et al. 2005, A&A, 440, 207
- Bernacca et al. (1984) Bernacca P.L., Iijima T., Stagni R. 1984, A&A, 132, L8
- Coe et al. (1987) Coe M.J., Longmore A.J., Payne B.J., Hanson C.G. 1987, MNRAS, 226, 455
- Coe et al. (2005) Coe M.J., Reig, P. McBride, V.A., Galache, J.L., Fabregat, J., MNRAS, in press
- Corbet et al. (1986) Corbet R.H.D., Charles P.A., van der Klis M. 1986, A&A, 162, 117
- Cui et al. (2000) Cui, W., Zhang, S.N., Chen, W. 2000, ApJ, 531, L45
- di Salvo et al. (2000) di Salvo, T., Stella, L., Robba, N. R., et al. 2000, ApJ, 544, L119
- di Salvo et al. (2002) di Salvo, T., Farinelli, R., Burderi, L. et al. 2002, A&A, 386, 535
- Ford et al. (1999) Ford, E. C., van der Klis, M., Méndez, M., van Paradijs, J., Kaaret, P. 1999, ApJ, 512, L31
- Frank et al. (1992) Frank, J., King, A., Raine, D. 1992, in Accretion power in Astrophysics, Cambridge University Press, p.122
- Gierlinski & Done (2002) Gierlinski, M., Done, C. 2002, MNRAS, 331, L47
- Kreykenbohm et al. (2005) Kreykenbohm, I., Mowlavi, N., Produit, N. et al. 2005, A&A, 433, L45
- Lazzati & Stella (1997) Lazzati, D. & Stella, L. 1997, ApJ, 476, 267
- Lin et al. (2000) Lin, D., Smith, I. A., Liang, E. P., B ttcher, M. 2000, ApJ, 543, L141
- Makishima et al. (1990) Makishima K., Mihara T., Ishida M., et al. 1990, ApJ, 365, L59
- Mihara et al. (2004) Mihara, T., Makishima, K., Nagase, F. 2004, ApJ, 610, 390
- Mowlavi et al. (2006) Mowlavi, N., Kreykenbohm, I., Shaw, S.E., et al. (2006), submitted to A&A
- Muno et al. (2002) Muno, M.P., Remillard, R.A., Chakrabarty, D. 2002, ApJ, 568, L35
- Nowak et al. (1999) Nowak, M.A., Vaughan, B.A., Wilms, J., Dove, J.B., Begelman, M.C. 1999, ApJ, 510, 874
- Nowak (2000) Nowak, M.A. 2000, MNRAS, 318, 361
- Negueruela et al. (1999) Negueruela I., Roche P., Fabregat J., Coe M.J. 1999, MNRAS, 307, 695
- Olive & Barret (2001) Olive, J.-F. & Barret, D. 2001, AIPC, 599, 814
- Ohkawa et al. (2005) Ohkawa, Y., Kitamoto, S., Kohmura, T. 2005, ApJ, 621, 951
- Qu et al. (2004) Qu, J. L., Chen, Y., Wu, M., Chen, L., Song, L.M. 2004, Ap&SS, 293, 441
- Qu et al. (2005) Qu, J. L., Zhang, S., Song, L. M. & Falanga, M. 2005, ApJ, 629, L33
- Reig et al. (2000) Reig, P., Belloni, T., van der Klis, M., M ndez, M., Kylafis, N.D., Ford, E.C. 2000, ApJ, 541, 883
- Reig et al. (2004) Reig, P., van Straaten, S. & van der Klis, M. 2004, ApJ, 602, 918
- Remillard (2004) Remillard, R. 2004, ATel, 371
- Stella et al. (1985) Stella L., White N.E., Davelaar J., Parmar A.N., van der Klis M., Blissett R.J. 1985, ApJ, 288, L45
- Stella & Angelini (1992) Stella, L. & Angelini, L. 1992, in Astronomical Data Analysis and Systems (ADASS. I.D.M. Worral and C. Biemesderfer eds. ASP Conference Series vol. 25, p 103
- Swank et al. (2004) Swank J., Remillard R., Smith E. 2004, ATel 349
- Takeshima et al. (1994) Takeshima T., Dotani T., Mitsuda K., Nagase F. 1994, ApJ, 436, 871
- Tanaka (1983) Tanaka, Y. 1983, IAUC 3891
- Terrell & Priedhorsky (1984) Terrell J., & Priedhorsky W.C. 1984, ApJ, 285, L15
- van der Klis (1995) van der Klis, M., 1995, in X-ray binaries, Cambridge University Press, p.252
- van Straaten et al. (2002) van Straaten, S., van der Klis, M., di Salvo, T. & Belloni, T. 2002, ApJ, 568, 912
- van Straaten et al. (2003) van Straaten, S., van der Klis, M., & Méndez, M. 2003, ApJ, 596, 1155
- Varnière (2005) Varnière, P. 2005, A&A, 434, L5
- Whitlock (1989) Whitlock L. 1989, ApJ, 344, 371
- Wijnands et al. (1999) Wijnands, R., Homan, J., van der Klis, M. 1999, ApJ, 526, L33
- Zhang et al. (2005) Zhang, S., Qu, J.L., Song, L.M. & Torres, D.F. 2005, ApJ, 630, L65