Boxy/peanut “bulges”: comparing the structure of galaxies with the underlying families of periodic orbits.
Abstract
The vertical profiles of disc galaxies are built by the material trapped around stable periodic orbits, which form their “skeletons”. According to this, the knowledge of the stability of the main families of periodic orbits in appropriate 3D models, can predict possible morphologies for edge-on disc galaxies. In a pilot survey we compare the orbital structures which lead to the appearance of “peanuts” and “X”-like features with the edge-on profiles of three disc galaxies (IC 2531, NGC 4013 and UGC 2048). The subtraction from the images of a model representing the axisymmetric component of the galaxies reveals the contribution of the non-axisymmetric terms. We find a direct correspondence between the orbital profiles of 3D bars in models and the observed main morphological features of the residuals. We also apply a simple unsharp masking technique in order to study the sharpest features of the images. Our basic conclusion is that the morphology of the boxy “bulges” of these galaxies can be explained by considering disc material trapped around stable 3D periodic orbits. In most models these building-blocks periodic orbits are bifurcated from the planar central family of a non-axisymmetric component, usually a bar, at low order vertical resonances. In such a case the boxy “bulges” are parts of bars seen edge-on. For the three galaxies we study the families associated with the “peanut” or “X”-shape morphology are most probably bifurcations at the vertical 2/1 or 4/1 resonance.
keywords:
galaxies: kinematics and dynamics; ISM: dust, extinction – Infrared: galaxies – Infrared: ISM1 Introduction
In Patsis & Grosbøl (1996), Patsis, Athanassoula, Grosbøl et al. (2002a), and Patsis, Skokos & Athanassoula (2002b, hereafter PSA), have been presented boxy orbital profiles of 3D, time-independent, models of disc galaxies. They have been built by combinations of stable, 3D, orbits belonging in most cases to families of periodic orbits bifurcated from the planar x1 family (see e.g. Contopoulos 2002, or Contopoulos & Grosbøl 1989) at the vertical resonances. The most efficient dynamical mechanism for introducing vertical resonances in a system is the presence of non-axisymmetric components, especially bars.
Vertical profiles of 3D bars have been constructed by PSA, based on the orbital analysis of 3D Ferrers bars (Pfenniger 1984, 1985; Skokos, Patsis & Athanassoula 2002a,b). A profile of a single family includes stable orbits in a range of “energies” (Jacobi constants - ). In order to construct a family profile one needs to know its stable orbits. Out of this library of stable periodic orbits any subgroup that helps in matching the observed morphological structure can be chosen. Every family has its own characteristic orbital profile, and the profiles of the same family in several models are similar. Combinations of the profiles of several families of a model comprise a model profile. Particular useful representations of the orbital profiles that allow comparisons with real galaxies, or with snapshots of -body simulations, are their weighted images (PSA). The advantage of these images is that they show the relative importance of every orbit in a profile. They also show the details of the morphology in locations where more than one orbit contribute. The images are composed by periodic orbits weighted by the mean density of the model at the points visited by the orbit. Along each orbit one picks points at equal time steps. The density of the model is calculated at each of these points and the mean density is taken as the weight of the orbit. Having constructed images for every orbit (normalized over its total intensity), we can combine them to built a profile for a family of orbits. For the profile of a family are used orbits equally spaced in their mean radius.
The basic conclusions of the orbital analysis relevant to the present study are:
-
1.
The morphology supported by the composite orbital profile of a family may differ from the morphology of the individual periodic orbits calculated at a particular . Thus, in order to get the backbone of a structure to be compared with the morphology of a galaxy, one needs to know the evolution of the shape of the stable orbits of a family as a function of .
-
2.
The radial extent of the profile of an orbital 3D family is usually confined within a radius corresponding to a certain value. Orbits with a Jacobi constant larger than this , increase their size by increasing practically only in the vertical dimension, and this leads to models with stair-type edge-on profiles (for more details see Patsis et al. 2002a).
To these two, one should add that it is the presence of the vertical resonances and not the detailed kind of perturbation in the models that shapes the boxiness of the orbital profiles. However, “X”-like features as these we discuss here are typical of strong bar components.
Recently, unsharp masking techniques applied to images of galaxies (Aronica, Athanassoula, Bureau et al. 2003; Aronica, Bureau, Athanassoula et al. 2004; Bureau, Athanassoula, Chung et al. 2004) as well as to images of snapshots of -body simulations (Athanassoula 2005a,b) have shown excellent agreement between the image morphologies and what is predicted by the orbital theory in PSA. In particular, Aronica et al. (2003), compared the image of ESO 597-036 after unsharp masking with a model in PSA. They found besides a conspicuous “X”-shape feature in the central part, surface brightness enhancements along the equatorial plane of the galaxy. Both features have their counterparts in the orbital models and can be explained by material trapped around stable periodic orbits. Similar features are indicated by Aronica et al. (2004) also for ESO-443G042 and by Bureau et al. (2004) for the case of NGC 128. The comparison of features between orbital and -body models on the other hand show agreement in even finer details. In both papers by Athanassoula (2005a,b) one can find in the edge-on views of the models besides “X”-like features, density enhancements on the equatorial plane and features like “parentheses” (see e.g. Fig. 6 in Athanassoula 2005a). This is a strong indication that a large percentage of the material in the -body simulation follows orbits around the families bifurcated at the vertical resonances with small .
In the present paper we apply two image processing techniques on the images of three edge-on disc galaxies with rather boxy “bulges” in order to detect structures similar to those predicted by the orbital theory. We focus our attention to the structures observed in the central regions of IC 2531, NGC 4013 and UGC 2048 (NGC 973). First we subtract from the I-band images of the galaxies an axisymmetric model that was found by Xilouris, Kylafis, Papamastorakis et al. (1997) to describe best the smooth distribution of stars and dust in these objects. The models are used to isolate the non-axisymmetric term in the profiles of the galaxies. This term is expected to reflect in a straightforward way the presence of vertical resonances (PSA). A second technique we apply is just a gaussian filtering (unsharp masking) on the images. In Section 2 we give information about the observations of the galaxies, in Section 3 we describe the different image processing techniques, in Section 4 we give the results of the image processing we performed and finally we discuss our results and present our conclusions in Section 5.
2 Observations
The observations and the data reduction of the galaxies analyzed in this study are presented in Xilouris, Kylafis, Papamastorakis et al. (1997), and Xilouris, Byun, Kylafis et al. (1999). We briefly repeat here both.
Observations of the galaxies UGC 2048 and NGC 4013, were made at Skinakas observatory in Crete, using the 1.3 m telescope, where a Thomson CCD camera is installed at the prime focus of the Ritchey-Cretien telescope. The 19m pixels of this camera correspond to 0.39 arcseconds on the sky giving a total field of view . IC 2531 was observed with the 1 m Australian National University telescope (ANU) at the Siding Spring Observatory. The CCD camera in this case is an EEV giving a pixel size of 0.56 arcseconds at the Cassegrain focus. The I passband comparable to that of the Cousin’s photometric system is used in both cases. The exposure times are 20, 25 and 25 minutes for UGC 2048, NGC 4013 and IC 2531 respectively.
In Table 1 we summarize the basic observational properties of the galaxies as well as some characteristic parameters describing the axisymmetric stellar and dust components (see Section 3).
Out of the samples of the galaxies in Xilouris et al. (1997) and Xilouris et al. (1999), for which models for the axisymmetric light and dust distribution exist, we have selected three of them with boxy profiles to apply our image processing techniques.
| Name | Pixel size | Exp. time | Inclination | |||||||||
|---|---|---|---|---|---|---|---|---|---|---|---|---|
| ″ | (min) | (Mpc) | (degrees) | (kpc) | (kpc) | (kpc) | (kpc) | (kpc) | (mag) | (mag) | ||
| UGC 2048 | 0.39 | 20 | 63 | 89.6 | 11.0 | 16.5 | 1.0 | 0.57 | 2.4 | 18.4 | 9.1 | |
| NGC 4013 | 0.39 | 25 | 12 | 89.6 | 1.8 | 2.6 | 0.2 | 0.10 | 1.6 | 17.3 | 10.5 | |
| IC 2531 | 0.56 | 25 | 22 | 89.7 | 5.0 | 8.4 | 0.4 | 0.20 | 1.6 | 18.2 | 11.0 |
3 Determining the underlying structure of the galaxy
Disc galaxies are not axisymmetric systems. Their surface brightness can be described as the sum of an axisymmetric and a perturbing term. The latter refers to the presence of spirals or bars. The axisymmetric component is the most important and can be described by simple smooth functions (like axisymmetric exponential discs for the stars and the dust in the plane of the galaxy and a de Vaucouleurs law for the bulge). Besides the global perturbations we have clumps and star forming regions that cause deviations from smoothness locally. In the present paper we are interested in the global non-axisymmetric components.
Studying the smooth distributions is not only instructive (one gets a very good description of the galaxy with as few parameters as possible) but can also be a very helpful tool to uncover features due to non-axisymmetric components (e.g. bars). This is done by subtracting the axisymmetric model from the image of the galaxy. If the axisymmetric model is able to describe well the large-scale structure, then, with this method, what it left, i.e. the residuals, will indicate features that mainly have to do with either the non-smooth distribution of the dust (seen as absorption features) or the non-axisymmetric component of the stars (seen as excess of starlight). Assuming a constant mass–to–light ratio (M/L), this light excess will indicate regions of enhanced stellar density and will be comparable with the orbital models. Good agreement will indicate that large percentages of stars are trapped around stable periodic orbits.
The model that we use is described in great detail in Xilouris et al. (1997). The stellar emissivity (luminosity per unit volume) that we use consists of an exponential (in both radial and vertical directions) disc and a bulge described by the law, namely
| (1) |
with and being the scalelength and scaleheight of the disc and
| (2) |
with being the effective radius of the bulge and and the semi-major and semi-minor axis respectively. Here and are the normalization constants for the stellar emissivity of the disc () and the bulge (). The central value for the surface brightness of the disc and the bulge, if the model galaxy is seen edge-on and there is no dust, are given by and .
For the extinction coefficient we use a double exponential law, namely
| (3) |
where is the extinction coefficient at wavelength at the center of the disc and and are the scalelength and scaleheight respectively of the dust.
The radiative transfer model that we have used is the one described by Kylafis & Bahcall (1987) (see also Xilouris et al. 1997). The results are summarized in Table 1, where we give the values of the most important parameters in the best fittings.
The unsharp masking has been done by means of standard ESO-MIDAS commands. First we apply on the image a gaussian filter with radius of 5 pixels around the central pixel and with mean and sigma values of 5 and 2 pixels respectively in both directions. With this procedure a blurred image of the galaxy is created. Then, after subtracting the filtered from the original image the residual indicates the presence of the sharpest features on the images.
4 Results
In Fig. 1 we show the residual maps created by subtracting the model images of Xilouris et al. (1997, 1999) from the observed images of the three galaxies (NGC 4013 (a), IC 2531 (b) and UGC 2048 (c)). The images have been rotated so that the major axis of the galaxies is along the large dimension of the frame. The difference between the models and the observations are relatively small, indicating the “perturbation” character of the non-axisymmetric components (on average 15% - Xilouris et al. 1997, 1999). However, this procedure offers a straightforward tracer exactly of this excess light we are interested in.
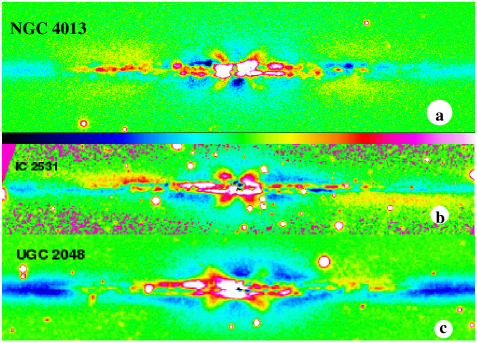
The main characteristic feature is an “X”-shaped structure revealed in the central parts of the galaxies. By comparing the residual with the full images of the galaxies we observe that the “X” features are in the region, where we have the boxy bulges.
The images after unsharp masking show sharp features that resemble the wings of an “X”. This can be seen in Fig. 2 for the same galaxies.
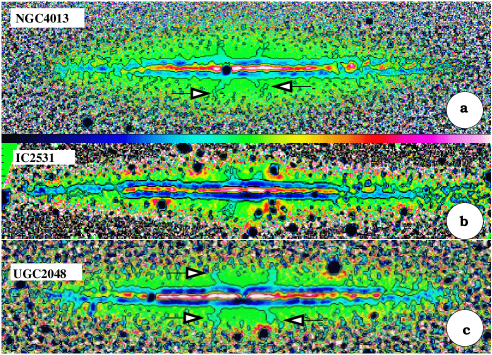
Characteristic contours underline the main structure observed. In this case we can better distinguish the highest contrast features. Again they are located at the region occupied by the boxy bulges. They should be compared to features expected in the central parts of 3D bars viewed almost, edge-on. The “X-shape” is encountered only in models for bars, while boxy bulges in general can be found also in non-barred models (Patsis et al. 2002a).
5 Discussion and Conclusions
Both image processing techniques revealed a kind of “X” structure in the central components of the three edge-on galaxies with boxy profiles we studied. In Fig. 1, where we give the residuals after subtracting a Xilouris et al. (1997) model we see the overall shape of the non-axisymmetric component. The unsharp masking in Fig. 2 shows more clearly the high intensity features of the “bulges”. They emerge out of the equatorial plane as distinct branches.
In most cases of the models in PSA an “X” is supported by material trapped around x1v1 orbits (Skokos et al. 2002a), i.e. by stable 3D orbits introduced in the system at the vertical 2/1 resonance. However, there are other 3D families as well, which could support straight line segments emerging out of the equatorial plane in the edge-on projections of the orbital models. Such is the case of x1v5, according to the nomenclature of Skokos et al. (2002a), which is a family born at the vertical 4/1 resonance. This family has been associated with boxy central components already by Pfenniger (1985). A typical orbital profile is given in Fig. 7a in PSA.
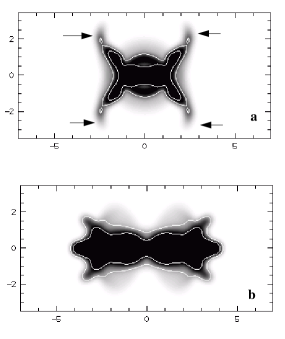
In models (orbital or -body), a visual difference can be found if we compare the side-on views. The distance between the wings of the “X” feature in the x1v5 case is larger than the distance of the corresponding wings in x1v1 profiles. The difference can be seen in Fig. 3, where we give in (a) a side-on typical x1v1 profile and in (b) a profile dominated by the presence of the x1v5 family. They correspond to models D and B in PSA. As we mentioned in the introduction, there is a certain value of , beyond which the orbits of a family grow practically only in the direction. So, for each family, there is a maximum radius on the equatorial plane, within which the projections of its orbits are confined. In the side-on views we can measure the length of the projection along the major axis of the bar. In the two specific examples we give here, the projection of the x1v1 orbits on the major axis of the bar in Fig. 3a corresponds roughly to a length 45% of the longest bar supporting orbits, i.e. the length of the bar in our orbital model. On the other hand in Fig. 3b, this percentage reaches almost 90%.
Unfortunately this criterion cannot in general apply on the images of real galaxies since we are missing the essential information about the orientation of the boxy structure with respect to the line-of-sight. Thus, at the level of the current analysis, we cannot point to a single vertical resonance and attribute to it the observed morphological feature. A galaxy may lack a vertical 2/1 (or even 3/1) resonance, in which case material may be trapped by stable orbits bifurcated at the vertical 4/1 resonance. The corresponding profile in such a case will look like what we see in Fig. 3b. It consists of stable orbits of the following families: (a) x1v5, (b) a bifurcation of it, and (c) z3.1s (PSA).
Another point that has to be mentioned, is the inwards bending or break of the wings of “X” close to their maximum height above the equatorial plane. According to the orbital models this can be explained by the fact that the orbits of a family increase their size practically only in the vertical direction beyond a certain value. In Fig. 3a we point with arrows to these breaks at the x1v1 profile. However, this is expected to happen to the profiles of other families as well if they are populated with orbits with high energies () (see a characteristic case in PSA, Fig.18). This tendency can be observed at the wings of the “X” features in Fig. 2a (NGC 4013) and Fig. 2c (UGC 2048). We indicate these breaks with arrows.
The main conclusion of the present study is that the careful subtraction of axisymmetric components from the profiles of the three edge-on disk galaxies (NGC 4013, IC 2531 and UGC 2048) reveals an “X”-like morphology, which indicates the presence of a bar. With this method we could isolate the light coming from the non-axisymmetric components. The similarity of these components with the morphology of the orbital profiles is a strong indication that the boxy “bulges” of these three galaxies are parts of bar structures observed edge-on. If the “X”-like structure of the residuals is due to stars trapped around stable periodic orbits, then we expect the presence of sharp features (the wings of the “X”) inside the bar region. By applying the unsharp masking on the images we find, in the foreseen by the orbital models regions, sharp features. The two methods are complementary. The unsharp masking does not give any information about the overall shape of the non-axisymmetric component. It shows however that in the regions we see the residuals we have the expected sharp features. These features show a nice correspondence with the dense parts of published orbital models (see PSA, Fig.1a, 3b, 7a, 9a). These techniques, and especially the study of the residuals after subtracting axisymmetric models, should be applied in a large sample of galaxies in order to estimate the frequency of these features in the profiles of boxy edge-on galaxies.
6 Acknowledgments
This work was partly supported by the Research Committee of the Academy of Athens. It is a pleasure to acknowledge fruitful discussions and valuable comments by G. Contopoulos and N. Kylafis. We thank the referee, Michael Pohlen, for very useful comments that helped us improve the paper.
References
- (1) Aronica G., Athanassoula E., Bureau M., Bosma A., Dettmar R.-J., Vergani D., Pohlen M., 2003, Astroph. Sp. Sci. 284, 753
- (2) Aronica G., Bureau M., Athanassoula E., Dettmar R.-J. 2004, in “Baryons in Dark matter halos”, p. 61.1, SISSA, (astro-ph/0502215)
- (3) Athanassoula E., 2005a, MNRAS 358, 1477
- (4) Athanassoula E., 2005b, Cel. Mech. Dyn. Astr. 91, 9
- (5) Bureau M., Athanassoula E., Chung A., Aronica G., 2004, in “Penetrating Bars through Masks of Cosmic Dust: the Hubble Tuning Fork Strikes a New Note”, eds. D.L. Block, K.C. Freeman, I. Puerari, & R. Groess (Kluwer: Dordrecht), pg. 139
- (6) Contopoulos G., 2002, Order and Chaos in Dynamical Astronomy, Springer Verlag Berlin.
- (7) Contopoulos G., Grosbøl P., 1989, A&AR 1, 261
- (8) Kylafis N., Bahcall J., 1987, ApJ 317, 367
- (9) Patsis P.A., Grosbøl P., 1996, A&A 1996, 315, 371
- (10) Patsis P.A., Athanassoula E., Grosbøl P., Skokos Ch., 2002a, MNRAS 335, 1049
- (11) Patsis P.A., Skokos Ch., Athanassoula E., 2002b, MNRAS 337, 578 (PSA)
- (12) Skokos Ch., Patsis P.A., Athanassoula E., 2002a, MNRAS 333, 847
- (13) Skokos Ch., Patsis P.A., Athanassoula E., 2002b, MNRAS 333, 861
- (14) Pfenniger D., 1984, A&A 134, 373
- (15) Pfenniger D., 1985, A&A 150, 112
- (16) Xilouris E. M., Kylafis N. D., Papamastorakis J., Paleologou, E. V., Haerendel G. 1997, A&A 325, 135
- (17) Xilouris E. M., Byun Y.I., Kylafis N. D., Paleologou, E. V., Papamastorakis J., 1999, A&A 344, 868